Demographics of Prince Edward Island
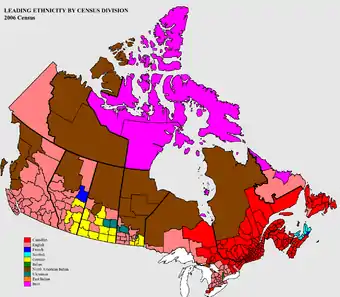
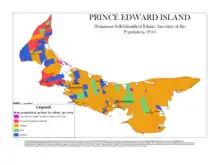
Demographics of the province of Prince Edward Island, Canada. According to the 2011 National Household Survey, the largest ethnic group consists of people of Scottish descent (39.2%), followed by English (31.1%), Irish (30.4%), French (21.1%), German (5.2%), and Dutch (3.1%) descent. Prince Edward Island is mostly a white community and there are few visible minorities. Chinese people are the largest visible minority group of Prince Edward Island, comprising 1.3% of the province's population. Almost half of respondents identified their ethnicity as "Canadian." Prince Edward Island is by a strong margin the most Celtic and specifically the most Scottish province in Canada and perhaps the most Scottish place (ethnically) in the world, outside Scotland. 38% of islanders claim Scottish ancestry, but this is an underestimate and it is thought that almost 50% of islanders have Scottish roots. When combined with Irish and Welsh, almost 80% of islanders are of some Celtic stock, albeit most families have resided in PEI for at least two centuries. Few places outside Europe can claim such a homogenous Celtic ethnic background. The only other jurisdiction in North America with such a high percentage of British Isles heritage is Newfoundland.
Population
Census Metropolitan Areas
| City | 2016 | 2011 | 2006 | Land Area km² | Density /km² |
|---|---|---|---|---|---|
| Charlottetown | 69,325 | 65,523 | 59,325 | 917.47 | 75.6 |
| Summerside | 16,587 | 16,488 | 16,153 | 92.43 | 179.5 |
Cities and towns
All statistics according to Canada 2016 Census, unless otherwise specified
| Town | Population | Population (2011) | Population Ranking | Land Area km2 | Area Ranking | Density /km2 | Density Ranking |
|---|---|---|---|---|---|---|---|
| Alberton | 1,145 | 1,135 | 7 | 4.52 | 6 | 253.5 | 8 |
| Borden-Carleton | 724 | 750 | 9 | 12.99 | 5 | 55.7 | 10 |
| Charlottetown | 36,094 | 34,562 | 1 | 44.34 | 1 | 814.1 | 1 |
| Cornwall | 5,348 | 5,162 | 4 | 28.19 | 3 | 189.7 | 9 |
| Georgetown | 555 | 675 | 10 | 1.59 | 10 | 348.1 | 6 |
| Kensington | 1,619 | 1,513 | 6 | 3.01 | 9 | 537.8 | 3 |
| Montague | 1,961 | 1,895 | 5 | 3.16 | 8 | 620.8 | 2 |
| Souris | 1,053 | 1,173 | 8 | 3.47 | 7 | 303.7 | 7 |
| Stratford | 9,706 | 8,574 | 3 | 22.53 | 4 | 430.8 | 5 |
| Summerside | 14,829 | 14,751 | 2 | 28.49 | 2 | 520.5 | 4 |
Population of Prince Edward Island since 1851
| Year | Population | Mean annual % change |
Five Year % change |
Ten Year % change |
Rank Among Provinces |
|---|---|---|---|---|---|
| 1850 | 62,678 | n/a | n/a | n/a | 5 |
| 1861 | 80,857 | 2.6 | n/a | 29.0 | 5 |
| 1871 | 94,021 | 1.5 | n/a | 16.3 | 5 |
| 1881 | 108,891 | 1.5 | n/a | 15.8 | 5 |
| 1891 | 109,078 | 0.017 | n/a | 0.2 | 6 |
| 1901 | 103,259 | −0.55 | n/a | -5.3 | 7 |
| 1911 | 93,728 | −0.96 | n/a | -9.2 | 9 |
| 1921 | 88,615 | −0.56 | n/a | -5.4 | 9 |
| 1931 | 88,038 | −0.065 | n/a | -0.7 | 9 |
| 1941 | 95,047 | 0.77 | n/a | 8.0 | 9 |
| 1951 | 98,429 | 0.35 | n/a | 3.6 | 10 |
| 1956 | 99,285 | 0.17 | 0.9 | n/a | 10 |
| 1961 | 104,629 | 1.1 | 5.4 | 6.3 | 10 |
| 1966 | 108,535 | 0.74 | 3.7 | 9.3 | 10 |
| 1971 | 111,635 | 0.56 | 2.9 | 6.7 | 10 |
| 1976 | 118,225 | 1.2 | 5.9 | 8.9 | 10 |
| 1981 | 122,506 | 0.7 | 3.6 | 9.7 | 10 |
| 1986 | 126,640 | 0.67 | 3.4 | 7.1 | 10 |
| 1991 | 129,765 | 0.49 | 2.5 | 5.9 | 10 |
| 1996 | 134,557 | 0.73 | 3.7 | 6.3 | 10 |
| 2001 | 135,294 | 0.11 | 0.5 | 4.2 | 10 |
| 2006 | 138,581 | 0.47 | 2.4 | 2.9 | 10 |
| 2011 | 140,204 | 0.25 | 1.2 | 3.6 | 10 |
| 2016 | 142,907 | n/a | 1.9 | 3.1 | 10 |
- Source: Statistics Canada[1][2]
Visible minorities and Aboriginals
| Visible minority and Aboriginal population (Canada 2016 Census) | |||
|---|---|---|---|
| Population group | Population | % of total population | |
| European | 130,310 | 93.3% | |
| Visible minority group Source:[3] | Chinese | 2,570 | 1.8% |
| South Asian | 920 | 0.7% | |
| Black | 825 | 0.6% | |
| Filipino | 670 | 0.5% | |
| Latin American | 255 | 0.2% | |
| Southeast Asian | 145 | 0.1% | |
| Arab | 585 | 0.4% | |
| West Asian | 215 | 0.2% | |
| Korean | 210 | 0.2% | |
| Japanese | 110 | 0.1% | |
| Visible minority, n.i.e. | 55 | 0% | |
| Multiple visible minority | 85 | 0.1% | |
| Total visible minority population | 6,640 | 4.8% | |
| Aboriginal group Source:[4] | First Nations | 1,870 | 1.3% |
| Métis | 710 | 0.5% | |
| Inuit | 75 | 0.1% | |
| Multiple Aboriginal identity | 20 | 0% | |
| Aboriginal, n.i.e. | 60 | 0% | |
| Total Aboriginal population | 2,735 | 2% | |
| Total population | 139,685 | 100% | |
Ethnic origins
| Ethnic Origin | Population | Percent |
|---|---|---|
| Canadian | 60,000 | 44.98% |
| Scottish | 50,700 | 38.01% |
| English | 38,330 | 28.74% |
| Irish | 37,170 | 27.87% |
| French | 28,410 | 21.30% |
| German | 5,400 | 4.05% |
| Dutch (Netherlands) | 4,130 | 3.10% |
| Acadian | 3,020 | 2.26% |
| North American Indian | 2,360 | 1.77% |
| Welsh | 1,440 | 1.08% |
| American (USA) | 640 | |
| Polish | 615 | |
| Italian | 605 | |
| Lebanese | 525 | |
| Danish | 420 | |
| Norwegian | 325 | |
| Ukrainian | 320 | |
| Swedish | 315 | |
| Belgian | 240 | |
| Métis | 245 | |
| Chinese | 225 | |
| Hungarian (Magyar) | 225 | |
| British, not included elsewhere | 210 | |
| Spanish | 175 | |
| Jewish | 165 | |
| Russian | 160 | |
| Swiss | 145 | |
| Finnish | 135 | |
| Inuit | 120 |
- Information taken from the Canada 2001 Census..[5]
- * These percentages sum to more than 100% due to dual responses (e.g. "French-Canadian" generating an entry in both "French" and "Canadian" categories.) Groups with greater than 1,000 responses are included.
Languages
Knowledge of languages
The question on knowledge of languages allows for multiple responses. The following figures are from the 2016 Canadian Census,[6] and lists languages that were selected by at least one per cent of respondents.
| Language | Responses | % |
|---|---|---|
| English | 138,735 | 99.32 |
| French | 17,875 | 12.80 |
| Mandarin | 2,105 | 1.51 |
Mother tongue
The 2006 Canadian census showed a population of 135,851. Of the 133,570 singular responses to the question concerning mother tongue the most commonly reported languages were:
| Place | Language | Population | Percentage |
|---|---|---|---|
| 1 | English | 125,260 | 93.78% |
| 2 | French | 5,345 | 4.00% |
| 3 | Dutch | 865 | 0.65% |
| 4 | German | 275 | 0.21% |
| 5 | Spanish | 220 | 0.16% |
| 6 | Chinese languages | 190 | 0.14% |
| Mandarin | 45 | 0.03% | |
| Cantonese | 15 | 0.01% | |
| 7 | Arabic | 150 | 0.11% |
| 8 | Hungarian | 120 | 0.09% |
| 9 | Algonquian languages | 95 | 0.07% |
| Mi'kmaq | 90 | 0.07% | |
| 10 | Serbo-Croatian languages | 85 | 0.07% |
| Serbian | 35 | 0.03% | |
| Croatian | 20 | 0.01% | |
| Bosnian | 15 | 0.01% | |
| Serbo-Croatian | 15 | 0.01% | |
| 11 | Japanese | 80 | 0.06% |
| 12 | Bantu languages | 70 | 0.05% |
| 12 | Polish | 70 | 0.05% |
| 14 | Korean | 65 | 0.05% |
| 14 | Scandinavian languages | 65 | 0.05% |
| Danish | 40 | 0.03% | |
| Swedish | 15 | 0.01% | |
| Icelandic | 10 | 0.01% | |
| 16 | Frisian | 55 | 0.04% |
| 16 | Italian | 55 | 0.04% |
| 18 | Flemish | 40 | 0.03% |
| 18 | Hindi | 40 | 0.03% |
| 20 | Creole | 35 | 0.03% |
| 20 | Urdu | 35 | 0.03% |
There were also 30 single-language responses for Greek and Niger-Congo languages n.i.e.; 25 for Russian; 20 for Ukrainian; 15 for Finnish, Germanic languages n.i.e., Inuktitut, Maltese, Persian and Tagalog; and 10 for Czech, Estonian, Portuguese, Slovenian, Turkish and Vietnamese. In addition, there were also 105 responses of English and a non-official language; 25 of French and a non-official language; 495 of English and French; and 10 of English, French, and a non-official language. (Figures shown are for the number of single language responses and the percentage of total single-language responses.)[7]
Migration
Immigration
The 2006 Canadian census counted a total of 4,785 immigrants living in Prince Edward Island.
The most commonly reported origins for these immigrants were:
[8]
| Place | Country | Population |
|---|---|---|
| 1 | United States | 1,255 |
| 2 | United Kingdom | 1,165 |
| 3 | Netherlands | 500 |
| 4 | Germany | 225 |
| 5 | Yugoslavia | 140 |
| 6 | Belgium | 85 |
| 7 | Colombia | 70 |
| 7 | South Korea | 70 |
| 9 | Australia | 65 |
| 9 | New Zealand | 65 |
| 11 | China | 60 |
| 11 | Lebanon | 60 |
There were also about fifty-five immigrants from Denmark; about fifty each from India, Japan, and Poland; about forty-five each from Hungary, Sierra Leone, and Syria; and about thirty-five from Zimbabwe.
Internal migration
Since 1971, Prince Edward Island mostly had years of positive interprovincial migration. However, in the 2010s, it turned to the negative. This interprovincial migration exceeded all immigration to the province in 2015.[9]
| In-migrants | Out-migrants | Net migration | |
|---|---|---|---|
| 2008–09 | 2,522 | 3,058 | −536 |
| 2009–10 | 2,709 | 2,649 | 60 |
| 2010–11 | 2,494 | 2,704 | −210 |
| 2011–12 | 2,620 | 3,238 | −618 |
| 2012–13 | 2,294 | 3,195 | −901 |
| 2013–14 | 2,198 | 3,139 | −941 |
| 2014–15 | 2,367 | 3,049 | −682 |
| 2015–16 | 2,874 | 2,844 | 30 |
| 2016–17 | 3,124 | 2,680 | 444 |
| 2017–18 | 3,193 | 3,016 | 177 |
| 2018–19 | 3,922 | 3,793 | 129 |
Source: Statistics Canada
Religious Groups
| Religion | Population | Percent |
|---|---|---|
| Total population | 133,385 | 100.0% |
| Roman Catholic | 63,240 | 47.4% |
| United Church | 26,570 | 19.9% |
| No religion | 8,705 | 6.5% |
| Presbyterian | 7,885 | 5.9% |
| Anglican | 6,525 | 4.9% |
| Baptist | 5,950 | 4.5% |
| Protestant not included elsewhere | 5,105 | 3.8% |
| Christian not included elsewhere | 3,210 | 2.4% |
| Pentecostal | 975 | 0.7% |
| Jehovah's Witnesses | 475 | 0.4% |
| Salvation Army | 340 | 0.3% |
| Mormon | 215 | 0.2% |
| Christian Reformed Church | 205 | 0.2% |
| Muslim | 195 | 0.1% |
| Brethren in Christ | 165 | 0.1% |
| Non-denominational | 165 | 0.1% |
| Lutheran | 160 | 0.1% |
| Buddhist | 140 | 0.1% |
| Greek Orthodox | 110 | 0.1% |
| Orthodox not included elsewhere | 70 | 0.1% |
| Jewish | 55 | 0.0% |
| Aboriginal spirituality | 50 | 0.0% |
| Pagan | 45 | 0.0% |
| Seventh-day Adventist | 35 | 0.0% |
| Hindu | 35 | 0.0% |
| Ukrainian Catholic | 15 | 0.0% |
| Evangelical Missionary Church | 10 | 0.0% |
| Mennonite | 10 | 0.0% |
| Methodist | 10 | 0.0% |
- Information taken from the 2001 Canadian Census.[5]
The Roman Catholic Diocese of Charlottetown comprises the entire Island and is the second oldest English diocese in Canada. The Archdiocese of Kingston is the oldest.
References
- Statistics Canada Archived 2007-02-21 at the Wayback Machine - PEI Population trend
- Population urban and rural, by province and territory (Nova Scotia) Archived 2006-11-21 at the Wayback Machine. Statistics Canada, 2005.
- "2006 Canada Census: Community Profiles". Statistics Canada. March 13, 2007. Retrieved November 3, 2017.
- "2006 Census: Aboriginal Population Profile". Statistics Canada. January 15, 2008. Retrieved November 3, 2017.
- "PEI 2001 Canadian Census". Archived from the original on 2007-03-23. Retrieved 2007-01-29.
- "Census Profile, 2016 Census - Prince Edward Island [Province] and Newfoundland and Labrador [Province] - Language". statcan.gc.ca. Statistics Canada. 9 August 2019. Retrieved 15 October 2019.
- "2006 Census of Canada: Topic-based tabulations". statcan.ca. Retrieved 4 July 2015.
- "2006 Census of Canada: Topic-based tabulations". statcan.ca. Retrieved 4 July 2015.
- Aug 16, Kevin Yarr · CBC News · Posted; August 16, 2016 11:00 AM AT | Last Updated; 2016. "Immigration not keeping pace with people leaving P.E.I. | CBC News". CBC. Retrieved 2018-12-28.CS1 maint: numeric names: authors list (link)
| Subdivisions | |
|---|---|
| Cities | |
| Towns | |
| Rural municipalities |
|
| Resort municipalities | |
| Unincorporated communities | |
| |
| Provinces | |
|---|---|
| Territories | |
| |
| Ethnic ancestry |
| ||||||||||||||||||||||||||||||||||||||||||||||||
|---|---|---|---|---|---|---|---|---|---|---|---|---|---|---|---|---|---|---|---|---|---|---|---|---|---|---|---|---|---|---|---|---|---|---|---|---|---|---|---|---|---|---|---|---|---|---|---|---|---|
| Demographics |
| ||||||||||||||||||||||||||||||||||||||||||||||||
| Culture and society | |||||||||||||||||||||||||||||||||||||||||||||||||
| List of Canadians |
| ||||||||||||||||||||||||||||||||||||||||||||||||
| |||||||||||||||||||||||||||||||||||||||||||||||||