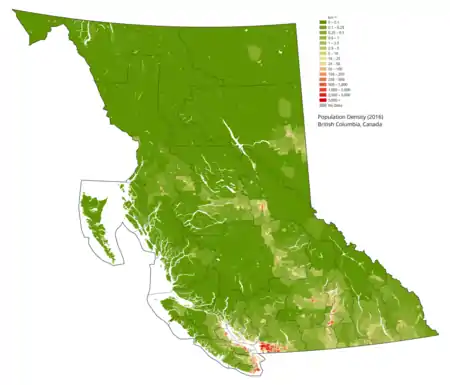
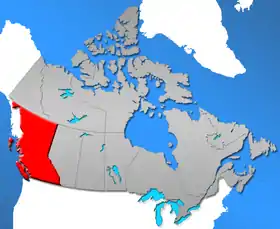
Demographics of British Columbia
Population of British Columbia 5.071 million (2019)
Percentage of National Population: 13.2% (unchanged)
Population Growth Rate: 5.6%
Vital statistics
Birth rate: 9.7 births per 1,000[1] (Canadian average ≈ 11)
Death rate: 2.3 deaths per 1,000
Infant mortality rate: 4.0 deaths per 1,000 live births[2]
Life expectancy at birth: 81.12 years[3]
Total fertility rate: 1.4 children born per woman[4] (Canadian average = 1.61)
Population of British Columbia since 1851
| Year | Population | Five year % change |
Ten year % change |
Rank among provinces |
|---|---|---|---|---|
| 1851 | 55,000 | n/a | n/a | n/a |
| 1861 | 51,524 | n/a | -6.3 | n/a |
| 1871 | 36,247 | n/a | -29.7 | 7 |
| 1881 | 49,459 | n/a | 36.4 | 8 |
| 1891 | 98,173 | n/a | 98.5 | 8 |
| 1901 | 178,657 | n/a | 82.0 | 6 |
| 1911 | 392,480 | n/a | 119.7 | 6 |
| 1921 | 524,582 | n/a | 33.7 | 6 |
| 1931 | 694,263 | n/a | 32.3 | 6 |
| 1941 | 817,861 | n/a | 17.8 | 4 |
| 1951 | 1,165,210 | n/a | 42.5 | 3 |
| 1956 | 1,398,464 | 20.0 | n/a | 3 |
| 1961 | 1,629,082 | 16.5 | 39.8 | 3 |
| 1966 | 1,873,674 | 15.0 | 34.0 | 3 |
| 1971 | 2,184,620 | 16.6 | 34.1 | 3 |
| 1976 | 2,466,610 | 12.9 | 31.6 | 3 |
| 1981 | 2,744,467 | 11.3 | 25.6 | 3 |
| 1986 | 2,883,370 | 5.1 | 16.9 | 3 |
| 1991 | 3,282,061 | 13.8 | 19.6 | 3 |
| 1996 | 3,724,500 | 13.5 | 29.2 | 3 |
| 2001 | 3,907,738 | 4.9 | 19.1 | 3 |
| 2006 | 4,113,487 | 5.4 | 10.4 | 3 |
| 2011 | 4,400,057 | 7.0 | 12.6 | 3 |
| 2016 | 4,648,055 | 5.6 | 13.0 | 3 |
- Source: Statistics Canada[5]
Age structure
| Males | Females | |||
|---|---|---|---|---|
| Age Group |
Number | Percent | Number | Percent |
| 0-4 | 105,808 | 2.4% | 100,116 | 2.2% |
| 5-9 | 117,909 | 2.8% | 111,383 | 2.6% |
| 10-14 | 133,809 | 3.1% | 126,388 | 3.0% |
| 15-19 | 143,449 | 3.4% | 136,227 | 3.2% |
| 20-24 | 155,369 | 3.7% | 147,770 | 3.5% |
| 25-29 | 139,521 | 3.3% | 138,299 | 3.3% |
| 30-34 | 144,788 | 3.4% | 145,869 | 3.4% |
| 35-39 | 155,429 | 3.7% | 158,364 | 3.7% |
| 40-44 | 177,381 | 4.2% | 179,216 | 4.2% |
| 45-49 | 172,786 | 4.1% | 177,082 | 4.2% |
| 50-54 | 157,596 | 3.7% | 159,965 | 3.8% |
| 55-59 | 138,096 | 3.2% | 139,772 | 3.3% |
| 60-64 | 101,610 | 2.4% | 103,764 | 2.4% |
| 65-69 | 80,051 | 1.9% | 82,363 | 1.9% |
| 70-74 | 70,060 | 1.6% | 72,493 | 1.7% |
| 75-79 | 54,572 | 1.3% | 64,344 | 1.5% |
| 80-84 | 36,304 | 0.8% | 53,047 | 1.2% |
| 85+ | 24,544 | 0.6% | 48,978 | 1.1% |
| Totals | 2,109,082 | 49.6% | 2,145,440 | 50.4% |
- Source: BCStats[6]
Ethnicity
British Columbia has a very diverse ethnic population. First-generation immigrants from the British Isles remain a strong component of local society despite limitations on immigration from Britain since the ending of special status for British subjects in the 1960s. Also present in large numbers relative to other cities in Canada (except Toronto), and also present in BC ever since the province was first settled (unlike Toronto), are many European ethnicities of the first and second generation, notably Germans, Ukrainians, Scandinavians, Yugoslavs and Italians; third-generation Europeans are generally of mixed lineage, and traditionally intermarried with other ethnic groups more than in any other Canadian province.
In recent decades, the proportion of those of Chinese and Indian ethnicity has risen sharply, though still outnumbered by the historically-strong population of those of German ancestry. Visible minorities have become an important factor in ethnic-based politics, though most visible minorities are less numerous than the long-standing non-British European ethnicities making up BC's "invisible minorities".
Note: The following statistics represent both single (e.g., "German") and multiple (e.g., "part Chinese, part English") responses to the 2006 and 2016 Census, and thus add up to more than 100%.
| Ethnic Origin | Population (2016)[7] | Percent (2016) | Population (2006)[8] | Percent (2006) |
|---|---|---|---|---|
| English | 1,203,540 | 26.39% | 1,207,245 | 29.63% |
| Canadian | 866,530 | 19% | 720,200 | 17.67% |
| Scottish | 860,775 | 18.88% | 828,145 | 20.32% |
| Irish | 675,135 | 14.80% | 618,120 | 15.17% |
| German | 603,265 | 13.23% | 561,570 | 13.78% |
| Chinese | 540,155 | 11.84% | 432,435 | 10.60% |
| French | 388,815 | 8.53% | 361,215 | 8.86% |
| Indian | 309,315 | 6.78% | 232,370 | 5.70% |
| Ukrainian | 229,205 | 5.03% | 197,265 | 4.84% |
| First Nations | 220,245 | 4.83% | 193,060 | 4.74% |
| Dutch (Netherlands) | 213,670 | 4.69% | 196,420 | 4.82% |
| Italian | 166,095 | 3.64% | 143,155 | 3.51% |
| Polish | 149,635 | 3.28% | 128,360 | 3.15% |
| Norwegian | 138,430 | 3.04% | 129,420 | 3.18% |
| Russian | 131,060 | 2.87% | 114,105 | 2.80% |
| Welsh | 113,905 | 2.5% | 104,275 | 2.56% |
| Swedish | 110,030 | 2.41% | 104,025 | 2.55% |
| Filipino | 158,215 | 3.47% | 94,255 | 2.3% |
| Métis | 90,515 | 1.98% | 62,570 | 1.5% |
| American (USA) | 78,170 | 1.71% | 66,765 | 1.6% |
| Spanish | 64,470 | 1.41% | 52,640 | 1.3% |
| Korean | 63,300 | 1.39% | 51,860 | 1.3% |
| Danish | 58,205 | 1.28% | 56,125 | 1.4% |
| Hungarian (Magyar) | 56,535 | 1.24% | 49,870 | 1.2% |
| Japanese | 51,150 | 1.12% | 41,585 | 1.0% |
| Austrian | 48,510 | 1.06% | 46,620 | 1.1% |
| Iranian | 47,985 | 1.05% | 29,265 | 0.7% |
| Portuguese | 41,770 | 0.92% | 34,660 | 0.9% |
| Vietnamese | 41,435 | 0.91% | 30,835 | 0.8% |
| Punjabi | 38,725 | 0.85% | 18,525 | 0.5% |
| Finnish | 34,150 | 0.75% | 29,875 | 0.7% |
| Swiss | 31,390 | 0.69% | 28,240 | 0.7% |
| Romanian | 31,250 | 0.69% | 25,670 | 0.6% |
| Icelandic | 26,410 | 0.58% | 22,110 | 0.5% |
| Greek | 24,460 | 0.54% | 21,770 | 0.5% |
| Croatian | 23,845 | 0.52% | 18,815 | 0.5% |
| Czech | 23,375 | 0.51% | 21,150 | 0.5% |
| Belgian | 19,980 | 0.44% | 17,510 | 0.4% |
| Jewish | 17,580 | 0.39% | 30,830 | 0.8% |
Projections
| Group | 2016[9] | 2036[10][11] | ||
|---|---|---|---|---|
| Number | % of 2016 population (4,560,240) | Number | % of 2036 estimated population (5,709,000) | |
| European origins | 2,908,420 | 63.8% | 2,907,000 | 50.9% |
| East and Southeast Asian origins | 820,065 | 18% | 1,339,000 | 23.5% |
| South Asian and Middle Eastern origins | 434,240 | 9.5% | 767,000 | 13.5% |
| Aboriginal origins | 270,585 | 5.9% | 428,000 | 7.5% |
| Latin, Central and South American origins | 44,115 | 1% | 91,000 | 1.6% |
| African origins | 43,500 | 1% | 80,000 | 1.4% |
| Other | 49,225 | 1.1% | 97,000 | 1.7% |
| *Percentages total over 100% due to multiple responses, e.g. German-Indian, Norwegian-Irish. | ||||
Indo-Canadians
Visible minorities and Aboriginal Peoples
- Note: Statistics Canada defines visible minorities as defined in the Employment Equity Act which defines visible minorities as "persons, other than Aboriginal peoples, who are non-Caucasian in race or non-white in colour".
| Visible minority and Aboriginal population (Canada 2016 Census) | |||
|---|---|---|---|
| Population group | Population | % of total population | |
| European | 2,908,420 | 63.8% | |
| Visible minority group Source:[12] | South Asian | 365,705 | 8% |
| Chinese | 508,480 | 11.2% | |
| Black | 43,500 | 1% | |
| Filipino | 145,025 | 3.2% | |
| Latin American | 44,115 | 1% | |
| Arab | 19,840 | 0.4% | |
| Southeast Asian | 54,920 | 1.2% | |
| West Asian | 48,695 | 1.1% | |
| Korean | 60,495 | 1.3% | |
| Japanese | 51,145 | 1.1% | |
| Visible minority, n.i.e. | 8,760 | 0.2% | |
| Multiple visible minority | 40,465 | 0.9% | |
| Total visible minority population | 1,381,235 | 30.3% | |
| Aboriginal group Source:[13] | First Nations | 172,520 | 3.8% |
| Métis | 89,405 | 2% | |
| Inuit | 1,610 | 0% | |
| Aboriginal, n.i.e. | 2,695 | 0.1% | |
| Multiple Aboriginal identity | 4,350 | 0.1% | |
| Total Aboriginal population | 270,585 | 5.9% | |
| Total population | 4,560,240 | 100% | |
Migration
Immigration
A large number of immigrants have lived in British Columbia for 30 years or less.[7]
| Immigrants to British Columbia by place of birth (2011 to 2016)[14] | |||
|---|---|---|---|
| Rank | Country | Population # | % of immigrants |
| 1 | China | 38,110 | 21.7% |
| 2 | India | 27,460 | 15.6% |
| 3 | Philippines | 26,685 | 15.2% |
| 4 | Iran | 8,645 | 4.9% |
| 5 | South Korea | 8,025 | 4.6% |
| 6 | United Kingdom | 6,535 | 3.7% |
| 7 | United States | 6,485 | 3.7% |
| 8 | Mexico | 2,880 | 1.6% |
| 9 | Taiwan | 2,505 | 1.4% |
| 10 | Japan | 2,285 | 1.3% |
| 11 | Syria | 2,185 | 1.2% |
| 12 | Pakistan | 1,960 | 1.1% |
| 13 | Australia | 1,920 | 1.1% |
| 14 | Iraq | 1,910 | 1.1% |
| 15 | Hong Kong | 1,805 | 1.0% |
Interprovincial Migration

British Columbia has also traditionally been gaining from interprovincial migration. Over the last 50 years, British Columbia had 12 years of negative interprovincial immigration: the lowest in the country. The only time the province significantly lost population to this phenomenon was during the 1990s, when it had a negative interprovincial migration for 5 consecutive years.[15]
| In-migrants | Out-migrants | Net migration | |
|---|---|---|---|
| 2009–10 | |||
| 2010–11 | |||
| 2011–12 | |||
| 2012–13 | |||
| 2013–14 | |||
| 2014–15 | |||
| 2015–16 | |||
| 2016–17 | |||
| 2017–18 | |||
| 2018–19 | |||
| 2019–20 |
Source: Statistics Canada[16]
Religions
The largest denominations by number of adherents according to the 2011 census were Christianity with 1,930,415 (44.6%); Irreligion (atheist, agnostic, and so on.) with 1,908,285 (44.1%); Sikhism with 201,110 (4.7%); Buddhism with 90,620(2.1%); Islam with 79,310 (1.8%); and Hinduism with 45,795 (1.1%).
| Population by religion, Canada and BC (2011 Census) |
Canada | B.C. | ||
|---|---|---|---|---|
| number | % | number | % | |
| Total population | 32,852,320 | 100% | 4,324,455 | 100% |
| No religious affiliation | 7,850,605 | 23.9% | 1,908,285 | 44.1% |
| Christian | 22,102,745 | 67.3% | 1,930,415 | 44.6% |
| Sikh | 454,965 | 1.4% | 201,110 | 4.7% |
| Buddhist | 366,830 | 1.1% | 90,620 | 2.1% |
| Muslim | 1,053,945 | 3.2% | 79,310 | 1.8% |
| Hindu | 497,960 | 1.5% | 45,795 | 1.1% |
| Jewish | 329,495 | 1% | 23,130 | 0.5% |
| Traditional (Aboriginal) Spirituality | 64,935 | 0.2% | 10,295 | 0.2% |
| Other religions | 130,835 | 0.4% | 35,500 | 0.8% |
| Source: Statistics Canada 2011 Census [18] | ||||
Languages
Knowledge of languages
The question on knowledge of languages allows for multiple responses. The following figures are from the 2016 Canadian Census, and lists languages that were selected by at least one per cent of respondents.
| Language | Responses | % |
|---|---|---|
| English | 4,560,235 | 96.60 |
| French | 314,225 | 6.89 |
| Mandarin | 265,635 | 5.83 |
| Punjabi | 244,485 | 5.36 |
| Cantonese | 234,445 | 5.14 |
| Spanish | 115,115 | 2.52 |
| Tagalog | 113,265 | 2.48 |
| German | 95,005 | 2.08 |
| Hindi | 81,330 | 1.78 |
| Korean | 57,490 | 1.26 |
| Persian | 49,835 | 1.09 |
Mother tongue
Figures shown are for the number of single language responses and the percentage of total single-language responses. Numerous other languages were also counted, but only languages with more than 2,000 native speakers are shown.
| Language | 2016 Census | % | 2006 Census | % |
|---|---|---|---|---|
| English | 3,170,110 | 70.5% | 2,875,770 | 71.5% |
| Punjabi | 198,805 | 4.4% | 158,750 | 3.9% |
| Cantonese | 193,530 | 4.3% | 131,245 | 3.3% |
| Mandarin | 186,325 | 4.1% | 72,160 | 1.8% |
| Tagalog (Filipino) | 78,770 | 1.8% | 50,425 | 1.3% |
| German | 66,885 | 1.5% | 86,690 | 2.2% |
| French | 55,325 | 1.2% | 54,745 | 1.4% |
| Korean | 52,160 | 1.2% | 46,500 | 1.2% |
| Spanish | 47,010 | 1.0% | 34,075 | 0.9% |
| Persian | 43,470 | 1.0% | 28,150 | 0.7% |
| Vietnamese | 27,150 | 0.6% | 24,560 | 0.7% |
| Hindi | 26,720 | 0.6% | 23,240 | 0.6% |
| Russian | 25,955 | 0.6% | 19,320 | 0.5% |
| Italian | 22,680 | 0.5% | 27,020 | 0.7% |
| Japanese | 21,350 | 0.5% | 20,040 | 0.5% |
| Dutch | 21,020 | 0.5% | 26,355 | 0.7% |
| Arabic | 17,480 | 0.4% | 8,440 | 0.2% |
| Portuguese | 17,450 | 0.4% | 14,385 | 0.4% |
| Polish | 16,910 | 0.4% | 17,565 | 0.4% |
| Chinese, n.o.s. | 10,050 | 0.2% | 132,755 | 3.2% |
| Urdu | 9,885 | 0.2% | 7,025 | 0.2% |
| Hungarian | 9,025 | 0.2% | 10,670 | 0.3% |
| Romanian | 8,730 | 0.2% | 6,335 | 0.2% |
| Ukrainian | 8,630 | 0.2% | 12,285 | 0.3% |
| Croatian | 7,475 | 0.2% | 8,505 | 0.2% |
| Serbian | 7,045 | 0.2% | 6,180 | 0.2% |
| Gujarati | 6,895 | 0.2% | 6,565 | 0.2% |
| Greek | 6,115 | 0.1% | 6,620 | 0.2% |
| Czech | 5,920 | 0.1% | 6,000 | 0.1% |
| Ilocano | 5,240 | 0.1% | 3,100 | 0.1% |
| Danish | 4,665 | 0.1% | 6,720 | 0.2% |
| Malay | 3,895 | 0.1% | 3,100 | 0.1% |
| Finnish | 3,760 | 0.1% | 4,770 | 0.1% |
| Tamil | 3,615 | 0.1% | 3,200 | 0.1% |
| Slovak | 3,400 | 0.1% | 3,490 | 0.1% |
| Turkish | 3,145 | 0.1% | 2,255 | 0.1% |
| Swedish | 2,520 | 0.1% | 2,875 | 0.1% |
| Athabaskan languages | 2,310 | 0.1% | 3,500 | 0.1% |
| Salish languages | 2,270 | 0.1% | 3,190 | 0.1% |
| Norwegian | 2,005 | 0.1% | 3,275 | 0.1% |
| Source: Statistics Canada 2006 & 2016 Census[19][20] | ||||
See also
- Demographics of Canada
- Population of Canada by province and territory
- Demographics of Vancouver
- Demographics of Abbotsford, British Columbia
References
- BC's birth rate, teen births lowest in Pacific Northwest — Sightline Institute
- "25_imr.FH10" (PDF). Archived from the original (PDF) on 2006-02-27. Retrieved 2006-06-30.
- http://www.bcstats.gov.bc.ca/DATA/pop/vital/exp0_bc.csv
- Northwest's birth rate, teen births hit record lows — Sightline Institute
- Statistics Canada - Population
- "Archived copy". Archived from the original on 2012-06-29. Retrieved 2006-06-30.CS1 maint: archived copy as title (link)
- "Census Profile, 2016 Census British Columbia [Province]". Retrieved 25 November 2018.
- "2006 Canadian Census". Statistics Canada. Retrieved September 21, 2014.
- "Census Profile, 2016 Census British Columbia [Province]". Retrieved 25 November 2018.
- "Population by visible minority group, place of residence and projection scenario, Canada, 2011 and 2036". Retrieved 25 November 2018.
- "Projections of the Aboriginal Population and Households in Canada, 2011 to 2036" (PDF). Retrieved 25 November 2018.
- , Community Profiles from the 2006 Census, Statistics Canada - Province/Territory
- , Aboriginal Population Profile from the 2006 Census, Statistics Canada - Province/Territory
- "Immigrant population by place of birth, period of immigration, 2016 counts, both sexes, age (total), British Columbia, 2016 Census – 25% Sample data".
- "Interprovincial Migration in Canada: Quebeckers Vote with Their Feet" (PDF). www.fraserinstitute.org. Retrieved 2018-12-26.
- Statistics Canada, table 051-0012: Interprovincial migrants, by age group and sex, Canada, provinces and territories, annual.
- "NHS Profile, British Columbia, 2011". Statistics Canada. Retrieved 27 March 2019.
- "NHS Profile, British Columbia, 2011". Statistics Canada. Retrieved 27 March 2019.
- "Detailed Mother Tongue (148), Single and Multiple Language Responses (3) and Sex (3) for the Population of Canada, Provinces, Territories, Census Metropolitan Areas and Census Agglomerations, 2006 Census – 20% Sample Data". Statistics Canada. 2007.
- "Census Profile, 2016 Census British Columbia [Province]". Statistics Canada. 2019.
| Provinces | |
|---|---|
| Territories | |
| |
| Ethnic ancestry |
| ||||||||||||||||||||||||||||||||||||||||||||||||
|---|---|---|---|---|---|---|---|---|---|---|---|---|---|---|---|---|---|---|---|---|---|---|---|---|---|---|---|---|---|---|---|---|---|---|---|---|---|---|---|---|---|---|---|---|---|---|---|---|---|
| Demographics |
| ||||||||||||||||||||||||||||||||||||||||||||||||
| Culture and society | |||||||||||||||||||||||||||||||||||||||||||||||||
| List of Canadians |
| ||||||||||||||||||||||||||||||||||||||||||||||||
| |||||||||||||||||||||||||||||||||||||||||||||||||