Demographics of Ontario
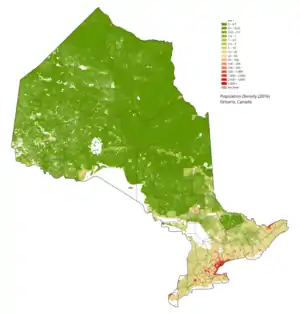
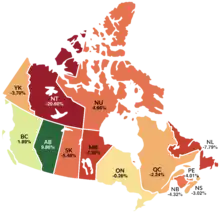
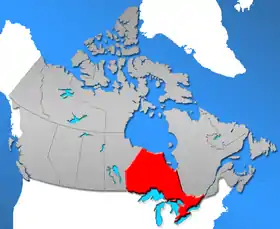
Ontario, one of the 13 provinces and territories of Canada, is located in east-central Canada. It is Canada's most populous province by a large margin, accounting for nearly 40 per cent of all Canadians, and is the second-largest province in total area. Ontario is fourth-largest in total area when the territories of the Northwest Territories and Nunavut are included. It is home to the nation's capital city, Ottawa, and the nation's most populous city, Toronto.
Vital statistics
Birth Rate: 10.8/1,000 people [1]
Death Rate: 7.1/1,000 people [2]
Life Expectancy at birth: 81 years (2006 est) [3]
Infant Mortality rate: 5.2 (2007 est) [4]
Historic populations
| Year | Population | 5 year % change |
10 year % change |
% Canadian population |
|---|---|---|---|---|
| 1824 | 150,066 | - | - | n/a |
| 1830 | 213,156 | - | - | n/a |
| 1840 | 432,159 | - | 102.7% | 39.93%[a] |
| 1851 | 952,004 | - | - | 51.32%[a] |
| 1861 | 1,396,091 | - | 46.6% | 55.58%[a] |
| 1871 | 1,620,851 | - | 16.1% | 43.9% |
| 1881 | 1,926,922 | - | 18.8% | 45.4% |
| 1891 | 2,114,321 | - | 9.7% | 48.9% |
| 1901 | 2,182,947 | - | 3.2% | 40.6% |
| 1911 | 2,527,292 | - | 15.8% | 35.1% |
| 1921 | 2,933,662 | - | 16.1% | 33.4% |
| 1931 | 3,431,683 | - | 17.0% | 33.1% |
| 1941 | 3,787,655 | - | 10.4% | 32.9% |
| 1951 | 4,597,542 | - | 21.3% | 32.8% |
| 1956 | 5,404,933 | 17.6% | - | 33.6% |
| 1961 | 6,236,092 | 15.4% | 35.6% | 34.2% |
| 1966 | 6,960,870 | 11.6% | 28.8% | 34.9% |
| 1971 | 7,703,105 | 10.7% | 23.5% | 35.7% |
| 1976 | 8,264,465 | 7.3% | 18.7% | 35.9% |
| 1981 | 8,625,107 | 4.4% | 12.0% | 35.4% |
| 1986 | 9,101,695 | 5.5% | 10.1% | 36.0% |
| 1991 | 10,084,885 | 10.8% | 16.9% | 36.9% |
| 1996 | 10,753,573 | 10.7% | 18.2% | 37.3% |
| 2001 | 11,410,046 | 6.1% | 13.2% | 38.0% |
| 2006 | 12,160,282 | 6.6% | 13.1% | 38.4% |
| 2011 | 12,851,821 | 5.7% | 12.6% | 38.4% |
| 2016 | 13,448,494 | 4.6% | 9.6% | 38.3% |
Source: Statistics Canada [5] [6]
- a % Province of Canada population
Age structure
| Age Groups | Total | Percentage | Male | Female |
|---|---|---|---|---|
| 0 to 4 years | 723,016 | 4.91% | 370,982 | 352,034 |
| 5 to 9 years | 762,654 | 5.18% | 389,331 | 373,323 |
| 10 to 14 years | 792,947 | 5.38% | 403,611 | 389,336 |
| 15 to 19 years | 852,405 | 5.79% | 436,529 | 415,876 |
| 20 to 24 years | 1,039,661 | 7.06% | 543,213 | 496,448 |
| 25 to 29 years | 1,077,433 | 7.31% | 555,954 | 521,479 |
| 30 to 34 years | 1,041,952 | 7.07% | 527,137 | 514,815 |
| 35 to 39 years | 992,844 | 6.74% | 493,399 | 499,445 |
| 40 to 44 years | 921,378 | 6.25% | 446,692 | 474,686 |
| 45 to 49 years | 932,058 | 6.33% | 454,915 | 477,143 |
| 50 to 54 years | 968,546 | 6.57% | 478,610 | 489,936 |
| 55 to 59 years | 1,073,519 | 7.29% | 532,834 | 540,685 |
| 60 to 64 years | 961,243 | 6.52% | 469,926 | 491,317 |
| 65 to 69 years | 803,962 | 5.46% | 383,637 | 420,325 |
| 70 to 74 years | 673,546 | 4.57% | 316,777 | 356,769 |
| 75 to 79 years | 461,015 | 3.13% | 212,100 | 248,915 |
| 80 to 84 years | 319,548 | 2.17% | 140,109 | 179,439 |
| 85 to 89 years | 204,227 | 1.39% | 81,946 | 122,281 |
| 90 to 94 years | 98,638 | 0.67% | 33,530 | 65,108 |
| 95 to 99 years | 29,527 | 0.20% | 7,515 | 22,012 |
| 100 years and over | 3,895 | 0.03% | 701 | 3,194 |
| Total | 14,734,014 | 100% | 7,279,448 | 7,454,566 |
Visible minorities and Aboriginals
| Visible minority and Aboriginal population (Canada 2016 Census) | 2011 NHS | 2006 Census | 2001 Census | 1996 Census | |||||||
|---|---|---|---|---|---|---|---|---|---|---|---|
| Population group | Population | % | Population | % | Population | % | Population | % | Population | % | |
| European | 8,982,180 | 67.8% | 8,930,835 | 70.6% | 8,879,900 | 73.8% | 8,944,190 | 79.3% | 8,714,680 | 81.9% | |
| Visible minority group Source:[9] | South Asian | 1,150,415 | 8.7% | 965,990 | 7.6% | 794,170 | 6.6% | 554,870 | 4.9% | 390,055 | 3.7% |
| Chinese | 754,550 | 5.7% | 629,140 | 5.0% | 576,980 | 4.8% | 481,505 | 4.3% | 391,090 | 3.7% | |
| Black | 627,715 | 4.7% | 539,205 | 4.3% | 473,765 | 3.9% | 411,095 | 3.6% | 356,215 | 3.3% | |
| Filipino | 311,675 | 2.4% | 275,380 | 2.2% | 203,220 | 1.7% | 156,515 | 1.4% | 117,365 | 1.1% | |
| Arab | 210,435 | 1.6% | 151,645 | 1.2% | 111,405 | 0.9% | 88,540 | 0.8% | |||
| Latin American | 195,950 | 1.5% | 172,560 | 1.4% | 147,135 | 1.2% | 106,835 | 0.9% | 85,745 | 0.8% | |
| West Asian | 154,670 | 1.2% | 122,530 | 1% | 96,615 | 0.8% | 67,100 | 0.6% | |||
| Southeast Asian | 133,855 | 1% | 137,875 | 1.1% | 110,045 | 0.9% | 86,410 | 0.8% | 75,910 | 0.7% | |
| Korean | 88,935 | 0.7% | 78,295 | 0.6% | 69,540 | 0.6% | 53,955 | 0.5% | 35,400 | 0.3% | |
| Japanese | 30,830 | 0.2% | 29,085 | 0.2% | 28,080 | 0.2% | 24,925 | 0.2% | 24,275 | 0.2% | |
| Arab/West Asian | 118,655 | 1.1% | |||||||||
| Visible minority, not included elsewhere | 81,130 | 0.6% | 81,130 | 0.6% | 56,845 | 0.5% | 78,915 | 0.7% | 52,170 | 0.5% | |
| Multiple visible minority | 97,970 | 0.7% | 96,735 | 0.8% | 77,405 | 0.6% | 42,375 | 0.4% | 35,160 | 0.3% | |
| Total visible minority population | 3,885,585 | 29.3% | 3,279,565 | 25.9% | 2,745,205 | 22.8% | 2,153,045 | 19.1% | 1,682,045 | 15.8% | |
| Aboriginal group | First Nations | 236,680 | 1.8% | 338,480 | 2.7% | 311,830 | 2.5% | 131,560 | 1.2% | ||
| Métis | 120,585 | 0.9% | 89,975 | 0.7% | 81,320 | 0.7% | 48,340 | 0.4% | |||
| Inuit | 3,860 | 0% | 5,310 | 0% | 4,250 | 0% | 1,380 | 0% | |||
| Aboriginal, n.i.e. | 7,540 | 0.1% | 5,345 | 0% | |||||||
| Multiple Aboriginal identity | 5,730 | 0% | 7,630 | 0.1% | 6,395 | 0.1% | 1,690 | 0% | |||
| Total Aboriginal population | 374,395 | 2.8% | 441,395[10] | 3.5% | 403,790 | 3.4% | 188,315 | 1.7% | 246,065 | 2.3% | |
| Total population | 13,242,160 | 100% | 12,651,795 | 100% | 12,028,895 | 100% | 11,285,550 | 100% | 10,642,790 | 100% | |
There is a striking difference between the Toronto CMA[11] (5,862,850) and the rest of Ontario (7,379,310); in particular, in the Toronto CMA visible minorities account for 51.4% of the population (3,011,900), whereas in the rest of Ontario the percentage of visible minorities in the overall population is much lower, at 11.8% (873,685). Back in 1996,1,338,095 of 4,232,905 Toronto CMA residents belonged to a visible minority,[12] i.e. 31.6% of its population; regarding the rest of Ontario, only 343,950 of its 6,409,885 residents, i.e. 5.4%, were visible minorities.[13]
Ethnic groups
As of 2016 census.[14]
| Ethnic group | Responses | % |
|---|---|---|
| Canadian | 3,109,770 | 23.48 |
| English | 2,808,810 | 21.21 |
| Scottish | 2,107,290 | 15.91 |
| Irish | 2,095,465 | 15.82 |
| French | 1,349,255 | 10.19 |
| German | 1,189,670 | 8.98 |
| Italian | 931,805 | 7.04 |
| Chinese | 849,340 | 6.41 |
| East Indian | 774,495 | 5.85 |
| Dutch (Netherlands) | 527,750 | 3.99 |
| Polish | 523,490 | 3.95 |
| North American Indian | 385,505 | 2.91 |
| Ukrainian | 376,440 | 2.84 |
| Filipino | 337,760 | 2.55 |
| Portuguese | 324,930 | 2.45 |
| British, not included elsewhere | 323,180 | 2.44 |
| Jamaican | 257,055 | 1.94 |
| Russian | 220,850 | 1.67 |
| Welsh | 198,470 | 1.50 |
| Spanish | 171,145 | 1.29 |
| Hungarian (Magyar) | 163,500 | 1.23 |
| Pakistani | 149,060 | 1.13 |
| Greek | 148,555 | 1.12 |
| American (USA) | 140,165 | 1.06 |
| Métis | 137,485 | 1.04 |
Note: The table takes dual responses (for example if someone is French-Canadian he/she would be added to both French and Canadian). Some places of one's ethnic origin do not refer to a single specified country of origin, i.e. Spanish refers to people from Spanish speaking countries such as Colombia, Spain, Mexico, Cuba and others; or East Indian where the respondents origin could be from Pakistan, India, Nepal, Bangladesh, etc.; and the list contains about 200 nationalities known to reside in the province. However, there are options for the respondent to identify the country alone.
Future Projections
| Group | 2016[15] | 2036[16][17] | ||
|---|---|---|---|---|
| Number | % of 2016 population (13,448,494) | Number | % of 2036 estimated population (16,944,000) | |
| European origins | 8,982,180 | 67.8% | 9,235,000 | 54.5% |
| South Asian and Middle Eastern origins | 1,515,520 | 11.5% | 3,030,000 | 17.9% |
| East and Southeast Asian origins | 1,319,845 | 10% | 2,254,000 | 13.3% |
| African origins | 627,715 | 4.7% | 1,093,000 | 6.5% |
| Aboriginal origins | 374,395 | 2.8% | 616,000 | 3.6% |
| Latin, Central and South American origins | 195,950 | 1.5% | 352,000 | 2.1% |
| Other | 179,100 | 1.3% | 363,000 | 2.1% |
| *Percentages total over 100% due to multiple responses, e.g. German-Indian, Norwegian-Irish. | ||||
Migration
Immigration
Ontario is a very diverse province. For example, 54.8% of the population of Toronto was born outside Canada,[18] which is the second-largest percentage of immigrants in a single city on Earth, after Miami. Hamilton is ranked the third-most diverse urbanized area in Canada (after Toronto and Vancouver).
Interprovincial Migration
Ontario's interprovincial migration rate have shifted over they years. It was negative in the 1970s, positive in the 1980s, but then negative again in the 1990s. It went back to the positive in around the time of the turn of the millennium for a few years, but has been in the negatives constantly from 2003 to 2015, and has been in the positives since then. Over the period from 1971 to 2015, Ontario was the province who experience the second lowest levels of interprovincial in-migration and out-migration, second only to Quebec.[19]
| In-migrants | Out-migrants | Net migration | |
|---|---|---|---|
| 2008–09 | 57,458 | 73,059 | −15,601 |
| 2009–10 | 59,741 | 64,403 | −4,662 |
| 2010–11 | 58,317 | 62,324 | −4,007 |
| 2011–12 | 60,459 | 71,070 | −10,611 |
| 2012–13 | 54,678 | 68,579 | −13,901 |
| 2013–14 | 57,415 | 71,979 | −14,564 |
| 2014–15 | 62,874 | 71,569 | −8,695 |
| 2015–16 | 71,790 | 62,713 | 9,077 |
| 2016–17 | 71,717 | 58,335 | 13,382 |
| 2017–18 | 69,918 | 59,974 | 9,944 |
| 2018–19 | 77,281 | 65,550 | 11,731 |
| 2019–20 | 97,031 | 89,210 | 7,821 |
Source: Statistics Canada
Language
The following figures are from the 2016 census.[8] The tables includes languages that were selected by at least 0.99 per cent of respondents. Respondents to the census are able to provide multiple responses for questions relating to knowledge of languages, and mother tongue.
Knowledge of languages
| Language | Responses | % |
|---|---|---|
| English | 12,879,045 | 97.26 |
| French | 1,521,020 | 11.49 |
| Mandarin | 385,452 | 2.91 |
| Cantonese | 341,875 | 2.58 |
| Spanish | 337,615 | 2.55 |
| Italian | 333,645 | 2.52 |
| Punjabi | 282,065 | 2.13 |
| Hindi | 250,095 | 1.89 |
| Arabic | 246,015 | 1.86 |
| Tagalog | 232,935 | 1.76 |
| Urdu | 231,500 | 1.75 |
| Portuguese | 193,520 | 1.46 |
| German | 189,035 | 1.43 |
| Tamil | 157,700 | 1.19 |
| Persian | 145,465 | 1.10 |
| Polish | 142,985 | 1.08 |
Mother tongue
| Language | Responses | %[note 1] |
|---|---|---|
| English | 8,902,320 | 66.87 |
| French | 490,715 | 3.68 |
| Mandarin | 283,735 | 2.13 |
| Cantonese | 275,315 | 2.07 |
| Italian | 231,040 | 1.74 |
| Punjabi | 197,060 | 1.48 |
| Spanish | 191,025 | 1.43 |
| Arabic | 171,370 | 1.29 |
| Urdu | 152,385 | 1.14 |
| Portuguese | 150,000 | 1.13 |
| Tagalog | 163,415 | 1.23 |
| German | 131,525 | 0.99 |
| English and French | 54,045 | 0.51 |
| English and non-official language | 288,285 | 2.17 |
| French and non-official language | 12,565 | 0.09 |
| English, French, and non-official language | 11,010 | 0.08 |
Religious groups
| Christian denominations in Canada |
|---|
| Religion | People | % |
|---|---|---|
| Total | 12,651,795 | 100 |
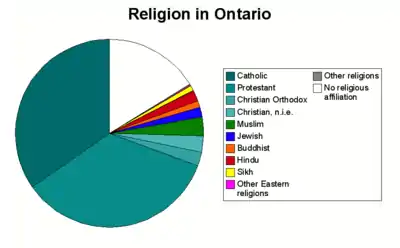
| Christian | 8,167,295 | 64.6 |
| No Religious Affiliation | 2,927,790 | 23.1 |
| Muslim | 581,950 | 4.6 |
| Hindu | 366,720 | 2.9 |
| Jewish | 195,540 | 1.5 |
| Sikh | 179,765 | 1.4 |
| Buddhist | 163,750 | 1.3 |
| Traditional Aboriginal (Spirituality) | 15,905 | 0.1 |
| Other Religions | 53,080 | 0.4 |
- Of Christian faith: Catholic at 3,976,610 (31.4%); United Church 952,465 (7.5%); Anglican 774,560 (6.1%); Presbyterian 319,585 (2.5%); Christian Orthodox 297,710 (2.4%); Baptist 244,650 (1.9%); Pentecostal 213,945 (1.7%); Lutheran 163,460 (1.3%); Other Christian 1,224,300 (9.7%)
Source: Statistics Canada [9] StatsCan 2011 National Household Survey
Census Metropolitan Areas
| City | 2016 [20] | 2011 [21] | 2006 [22] | 2001 [23] | 1996 [24] | 1991 [24] |
|---|---|---|---|---|---|---|
| Toronto | 5,928,040 | 5,583,064 | 5,113,149 | 4,682,897 | 4,263,757 | 3,898,933 |
| Ottawa-Gatineau | 1,323,783 | 1,236,324 | 1,130,761 | 1,063,664 | 1,010,498 | 941,814 |
| Hamilton | 747,545 | 721,053 | 692,911 | 662,401 | 624,360 | 599,760 |
| Kitchener-Cambridge-Waterloo | 523,894 | 477,160 | 451,235 | 414,284 | 382,940 | 356,421 |
| London | 494,069 | 474,786 | 457,720 | 432,451 | 398,616 | 381,522 |
| St. Catharines-Niagara | 406,074 | 392,184 | 390,317 | 377,009 | 372,406 | 364,552 |
| Oshawa | 379,848 | 356,177 | 330,594 | 296,298 | 268,773 | 240,104 |
| Windsor | 329,144 | 319,246 | 323,342 | 307,877 | 278,685 | 262,075 |
| Barrie | 197,059 | 187,013 | 177,061 | 148,480 | 118,695 | 97,150 |
| Greater Sudbury | 164,689 | 160,770 | 158,258 | 155,601 | 160,488 | 157,613 |
| Kingston | 161,175 | 159,561 | 152,358 | 146,838 | 143,416 | 136,401 |
| Guelph | 151,984 | 141,097 | 127,009 | 117,344 | 105,420 | 97,667 |
| Brantford | 134,203 | 135,501 | 124,607 | 86,417 | 100,238 | 97,106 |
| Peterborough | 121,721 | 118,975 | |102,423 | 100,193 | 98,060 | - |
| Thunder Bay | 121,621 | 121,596 | 122,907 | 121,986 | 125,562 | 124,925 |
| Belleville | 103,472 | 101,668 | 91,518 | 87,395 | 87,871 | - |
As regards ethnic origins and CMA of highest concentration (minimum: 1%):
| Ethnic Origin | CMA | % of population |
|---|---|---|
| Chinese | Toronto | 12.0 |
| East Indian | Toronto | 11.0 |
| Filipino | Toronto | 4.7 |
| Jamaican | Toronto | 3.4 |
| Russian | Toronto | 2.4 |
| Pakistani | Toronto | 2.1 |
| Sri Lankan | Toronto | 2.0 |
| Spanish | Toronto | 1.8 |
| Greek | Toronto | 1.7 |
| Iranian | Toronto | 1.7 |
| Korean | Toronto | 1.3 |
| Other African origins, n.i.e | Toronto | 1.1 |
| Jewish | Toronto | 1.0 |
| Haitian | Ottawa-Gatineau | 1.1 |
| Croatian | Hamilton | 1.9 |
| German | Kitchener-Cambridge-Waterloo | 21.8 |
| Portuguese | Kitchener-Cambridge-Waterloo | 4.1 |
| Romanian | Kitchener-Cambridge-Waterloo | 1.9 |
| Swiss | Kitchener-Cambridge-Waterloo | 1.5 |
| Belgian | London | 1.1 |
| Lebanese | Windsor | 3.3 |
| Iraqi | Windsor | 2.2 |
| American | Windsor | 1.7 |
| Serbian | Windsor | 1.4 |
| Arab, n.o.s. | Windsor | 1.0 |
| British Isles origins, n.i.e. | Barrie | 3.7 |
| Canadian | Greater Sudbury | 45.6 |
| French | Greater Sudbury | 37.7 |
| Vietnamese | Guelph | 1.6 |
| Dutch | Brantford | 8.0 |
| Hungarian | Brantford | 3.2 |
| English | Peterborough | 39.1 |
| Irish | Peterborough | 32.5 |
| Scottish | Peterborough | 26.3 |
| Welsh | Peterborough | 2.6 |
| Italian | Thunder Bay | 14.0 |
| Ukrainian | Thunder Bay | 13.5 |
| Finnish | Thunder Bay | 11.4 |
| First Nations | Thunder Bay | 10.5 |
| Polish | Thunder Bay | 7.1 |
| Swedish | Thunder Bay | 4.5 |
| Métis | Thunder Bay | 2.9 |
| Norwegian | Thunder Bay | 2.8 |
| Slovak | Thunder Bay | 2.0 |
| Danish | Thunder Bay | 1.1 |
See also
Notes
- The following is the total figure from all respondents, including single, and multi-answered respondents.
References
- "Archived copy". Archived from the original on June 23, 2013. Retrieved August 2, 2010.CS1 maint: archived copy as title (link)
- "Archived copy". Archived from the original on January 14, 2011. Retrieved August 2, 2010.CS1 maint: archived copy as title (link)
- "Archived copy". Archived from the original on October 5, 2011. Retrieved August 2, 2010.CS1 maint: archived copy as title (link)
- "Population and Dwelling Count Highlight Tables, 2016 Census". 12.statcan.gc.ca. February 8, 2017. Retrieved May 27, 2018.
- "Estimated population of Canada, 1605 to present". 12.statcan.gc.ca. Retrieved May 27, 2018.
- https://www150.statcan.gc.ca/t1/tbl1/en/tv.action?pid=1710000501&pickMembers%5B0%5D=1.7&pickMembers%5B1%5D=2.1&cubeTimeFrame.startYear=2016&cubeTimeFrame.endYear=2020&referencePeriods=20160101%2C20200101
- "Archived copy". Archived from the original on September 14, 2017. Retrieved October 31, 2017.CS1 maint: archived copy as title (link)
- "2011 National Household Survey Profile - Province/Territory". 12.statcan.gc.ca. May 8, 2013. Retrieved May 27, 2018.
- Government of Canada, Statistics Canada (May 8, 2013). "2011 National Household Survey: Data tables – Aboriginal Ancestry (6), Single and Multiple Aboriginal Ancestry Responses (3), Age Groups (6) and Sex (3) for the Population in Private Households of Canada, Provinces, Territories, Census Metropolitan Areas and Census Agglomerations, 2011 National Household Survey". www12.statcan.gc.ca. Retrieved August 29, 2019.
- "Demographics of Toronto", Wikipedia, October 1, 2019, retrieved October 1, 2019
- "1996 Census - Toronto CMA".
- "1996 Census - Ontario Visible Minority".
- "Immigration and Ethnocultural Diversity Highlight Tables - Ethnic Origin, both sexes, age (total), Ontario, 2016 Census – 25% Sample data". 12.statcan.gc.ca. October 25, 2017. Retrieved May 27, 2018.
- "Census Profile, 2016 Census Ontario [Province]". Statistics Canada. November 29, 2017. Retrieved January 6, 2019.
- "Population by visible minority group, place of residence and projection scenario, Canada, 2011 and 2036". Statistics Canada. Retrieved January 6, 2019.
- "Projections of the Aboriginal Population and Households in Canada, 2011 to 2036" (PDF). Statistics Canada. September 17, 2015. Retrieved January 6, 2019.
- "TMMIS - Committees" (PDF). Toronto.ca. Retrieved May 27, 2018.
- "Interprovincial Migration in Canada: Quebeckers Vote with Their Feet" (PDF). www.fraserinstitute.org. Retrieved December 26, 2018.
- "Population and Dwelling Count Highlight Tables, 2016 Census". 12.statcan.gc.ca. Retrieved May 27, 2018.
- "Population and dwelling counts, for Canada, provinces and territories, census metropolitan areas and census agglomerations, 2011 and 2006 censuses". 12.statcan.gc.ca. Retrieved May 27, 2018.
- "Population and dwelling counts, for Canada, provinces and territories, census metropolitan areas and census agglomerations, 2006 and 2001 censuses - 100% data". 12.statcan.gc.ca. Retrieved May 27, 2018.
- "Population and Dwelling Counts, for Canada, Provinces and Territories, Census Metropolitan Areas and Census Agglomerations, 2001 and 1996 Censuses - 100% Data". 12.statcan.gc.ca. Retrieved May 27, 2018.
- "Population and Dwelling Counts, for Census Metropolitan : Areas in Decreasing Order of 1996 Population, 1991 and 1996 Censuses - 100% Data". Statcan.gc.ca. Retrieved May 27, 2018.
| Provinces | |
|---|---|
| Territories | |
| |
| Ethnic ancestry |
| ||||||||||||||||||||||||||||||||||||||||||||||||
|---|---|---|---|---|---|---|---|---|---|---|---|---|---|---|---|---|---|---|---|---|---|---|---|---|---|---|---|---|---|---|---|---|---|---|---|---|---|---|---|---|---|---|---|---|---|---|---|---|---|
| Demographics |
| ||||||||||||||||||||||||||||||||||||||||||||||||
| Culture and society | |||||||||||||||||||||||||||||||||||||||||||||||||
| List of Canadians |
| ||||||||||||||||||||||||||||||||||||||||||||||||
| |||||||||||||||||||||||||||||||||||||||||||||||||