Demographics of Newfoundland and Labrador
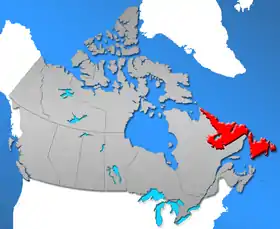
Newfoundland and Labrador is a province of Canada on the country's Atlantic coast in northeastern North America. The province has an area of 405,212 square kilometres (100,130,000 acres) and a population in 2011 of 514,563, with approximately 95% of the provincial population residing on the Island of Newfoundland (including its associated smaller islands), with nearly half of the population residing on the Avalon Peninsula. People from Newfoundland and Labrador are called "Newfoundlanders," "Labradorians" (as appropriate), or "Newfoundlanders and Labradorians".
Historical population
Since entering confederation, Newfoundland and Labrador has always been ranked 9th among provinces in population.
| Year | Pop. | ±% |
|---|---|---|
| 1825 | 55,719 | — |
| 1836 | 73,705 | +32.3% |
| 1845 | 96,295 | +30.6% |
| 1851 | 101,600 | +5.5% |
| 1857 | 124,288 | +22.3% |
| 1869 | 146,536 | +17.9% |
| 1874 | 197,335 | +34.7% |
| 1884 | 202,040 | +2.4% |
| 1891 | 220,984 | +9.4% |
| 1901 | 242,619 | +9.8% |
| 1911 | 263,033 | +8.4% |
| 1921 | 289,588 | +10.1% |
| 1935 | 361,416 | +24.8% |
| 1951 | 361,416 | +0.0% |
| 1956 | 415,074 | +14.8% |
| 1961 | 457,853 | +10.3% |
| 1966 | 493,396 | +7.8% |
| 1971 | 522,100 | +5.8% |
| 1976 | 557,720 | +6.8% |
| 1981 | 567,681 | +1.8% |
| 1986 | 568,350 | +0.1% |
| 1991 | 568,475 | +0.0% |
| 1996 | 551,790 | −2.9% |
| 2001 | 512,930 | −7.0% |
| 2006 | 505,469 | −1.5% |
| 2011 | 514,536 | +1.8% |
| 2016 | 519,716 | +1.0% |
| Source: [1][2]and Statistics Canada | ||
Source: Statistics Canada[3][4]
Ethnicity
More than half the population identified their ethnocultural ancestry as Canadian, while two-fifths identified English ancestry, and one-fifth identified Irish ancestry.
More than 100,000 Newfoundlanders have applied for membership in the Qalipu Mi'kmaq First Nation Band, equivalent to one-fifth of the total population.[5]
| Ethnicity | 2001 | % |
|---|---|---|
| Canadian | 271,345 | 53.41% |
| English | 200,120 | 39.39% |
| Irish | 100,260 | 19.73% |
| Scottish | 30,295 | 5.96% |
| French | 27,785 | 5.47% |
| North American Indian | 16,030 | 3.16% |
| Inuit | 7,445 | 1.47% |
| German | 6,275 | 1.24% |
| Métis | 6,120 | 1.20% |
| Newfoundlander | 3,585 | 0.71% |
| Welsh | 2,790 | 0.55% |
| Dutch (Netherlands) | 1,385 | 0.27% |
| Italian | 1,180 | 0.23% |
| Norwegian | 1,180 | 0.23% |
| Chinese | 1,110 | 0.22% |
| American (USA) | 1,065 | 0.21% |
| East Indian | 940 | 0.19% |
| British | 925 | 0.18% |
| Spanish | 765 | 0.15% |
| Portuguese | 735 | 0.14% |
| Polish | 665 | 0.13% |
| Swedish | 655 | 0.13% |
| Ukrainian | 580 | 0.11% |
| Lebanese | 515 | 0.10% |
| Danish | 455 | 0.09% |
| Jewish | 370 | 0.07% |
| Filipino | 340 | 0.07% |
| Russian | 285 | 0.06% |
| Greek | 245 | 0.05% |
| Hungarian (Magyar) | 245 | 0.05% |
| Austrian | 225 | 0.04% |
| African (Black), n.i.e. | 180 | 0.04% |
| Egyptian | 165 | 0.03% |
| Finnish | 145 | 0.03% |
| Black | 120 | 0.02% |
| Jamaican | 120 | 0.02% |
| Acadian | 115 | 0.02% |
| Arab, n.i.e. | 115 | 0.02% |
| Belgian | 115 | 0.02% |
| Czech | 115 | 0.02% |
| Romanian | 115 | 0.02% |
| South African | 105 | 0.02% |
The same data on ethnocultural ancestry, grouped more geographically by Statistics Canada, are shown below:
| Origins | 2001 | % |
|---|---|---|
| North American | 274,755 | 54.08% |
| British Isles | 266,010 | 52.36% |
| Aboriginal | 28,065 | 5.52% |
| French | 27,835 | 5.48% |
| Western European | 7,705 | 1.52% |
| Southern European | 3,285 | 0.65% |
| Northern European | 2,510 | 0.49% |
| Eastern European | 2,050 | 0.40% |
| East and Southeast Asian | 1,685 | 0.33% |
| Origins | 2001 | % |
|---|---|---|
| South Asian | 1,110 | 0.22% |
| Arab | 915 | 0.18% |
| Other European | 520 | 0.10% |
| African | 465 | 0.09% |
| Caribbean | 270 | 0.05% |
| West Asian | 130 | 0.03% |
| Latin, Central and South American |
75 | 0.01% |
| Oceania | 45 | 0.01% |
Percentages are calculated as a proportion of the total number of respondents (508,075) and may total more than 100% due to dual responses.
Only groups of more than 0.02% are shown[6]
Visible minorities and Aboriginals
| Visible minority and Aboriginal population (Canada 2016 Census) | |||
|---|---|---|---|
| Population group | Population | % of total population | |
| European | 454,710 | 88.8% | |
| Visible minority group Source:[9] | South Asian | 2,645 | 0.5% |
| Chinese | 2,325 | 0.5% | |
| Black | 2,355 | 0.5% | |
| Filipino | 1,390 | 0.3% | |
| Latin American | 635 | 0.1% | |
| Arab | 1,375 | 0.3% | |
| Southeast Asian | 340 | 0.1% | |
| West Asian | 220 | 0% | |
| Korean | 80 | 0% | |
| Japanese | 60 | 0% | |
| Visible minority, n.i.e. | 150 | 0% | |
| Multiple visible minority | 255 | 0% | |
| Total visible minority population | 11,810 | 2.3% | |
| Aboriginal group Source:[10] | First Nations | 28,375 | 5.5% |
| Métis | 7,790 | 1.5% | |
| Inuit | 6,450 | 1.3% | |
| Aboriginal, n.i.e. | 2,560 | 0.5% | |
| Multiple Aboriginal identity | 555 | 0.1% | |
| Total Aboriginal population | 45,730 | 8.9% | |
| Total population | 512,250 | 100% | |
Languages
Languages of Newfoundland and Labrador (2016):[11]
The 2006 Canadian census showed a population of 505,469.
Of the 499,830 singular responses to the census question concerning mother tongue the most commonly reported languages were:
| 2006 | % | 2001 | % | ||
|---|---|---|---|---|---|
| 1. | English | 488,405 | 97.71% | 499,750 | 98.49% |
| 2. | French | 1,885 | 0.38% | 2,180 | 0.43% |
| 3. | Algonquian languages | 1,625 | 0.33% | 1,510 | 0.30% |
| Montagnais–Naskapi | 1,585 | 0.32% | 1,495 | 0.29% | |
| 4. | Chinese | 1,080 | 0.22% | 525 | 0.10% |
| Cantonese | 185 | 0.04% | 55 | 0.01% | |
| Mandarin | 120 | 0.02% | 25 | ~ | |
| 5. | Spanish | 670 | 0.13% | 50 | 0.01% |
| 6. | German | 655 | 0.13% | 340 | 0.07% |
| 7. | Inuktitut | 595 | 0.12% | 550 | 0.11% |
| 8. | Urdu | 550 | 0.11% | 90 | 0.02% |
| 9. | Arabic | 540 | 0.11% | 210 | 0.04% |
| 10. | Dutch | 300 | 0.06% | 95 | 0.02% |
| 11. | Russian | 225 | 0.05% | 75 | 0.01% |
| 12. | Scandinavian languages | 220 | 0.04% | 125 | 0.02% |
| Norwegian | 85 | 0.02% | 40 | 0.01% | |
| Danish | 65 | 0.01% | 55 | 0.01% | |
| Swedish | 65 | 0.01% | 25 | ~ | |
| 13. | Italian | 195 | 0.04% | 115 | 0.02% |
| 14. | Germanic languages n.i.e. | 180 | 0.04% | 75 | 0.01% |
| 15. | Tagalog (Filipino) | 180 | 0.04% | 130 | 0.03% |
| 16. | Serbo-Croatian (all) | 170 | 0.03% | 130 | 0.03% |
| Serbian | 135 | 0.03% | 15 | ~ | |
| Croatian | 35 | 0.01% | 40 | 0.01% | |
| Serbo-Croatian | 0 | ~ | 75 | 0.01% | |
| 2006 | % | 2001 | % | ||
|---|---|---|---|---|---|
| 17. | Bengali | 165 | 0.03% | 55 | 0.01% |
| 18. | Portuguese | 150 | 0.03% | 105 | 0.02% |
| 19. | Hungarian | 140 | 0.03% | 45 | 0.01% |
| 20. | Panjabi (Punjabi) | 120 | 0.02% | 95 | 0.02% |
| 21. | African languages n.i.e. | 100 | 0.02% | 10 | ~ |
| 21. | Non-verbal languages | 100 | 0.02% | N | N |
| 23. | Bantu languages | 95 | 0.02% | 0 | ~ |
| 23. | Bulgarian | 95 | 0.02% | 75 | 0.01% |
| 25. | Niger–Congo languages n.i.e. | 85 | 0.13% | 40 | 0.1% |
| 26. | Romanian | 75 | 0.02% | 15 | ~ |
| 27. | Greek | 70 | 0.01% | 40 | 0.01% |
| 27. | Japanese | 70 | 0.01% | 45 | 0.01% |
| 29. | Telugu | 65 | 0.01% | 45 | 0.01% |
| 30. | Persian | 60 | 0.01% | 70 | 0.01% |
| 30. | Ukrainian | 60 | 0.01% | 20 | ~ |
| 32. | Czech | 50 | 0.01% | 15 | ~ |
| 32. | Gujarati | 50 | 0.01% | 50 | 0.01% |
| 32. | Hindi | 50 | 0.01% | 55 | 0.01% |
| 32. | Korean | 50 | 0.01% | 50 | 0.01% |
| 36. | Malayalam | 40 | 0.01% | 10 | ~ |
| 37. | Turkish | 40 | 0.01% | 25 | ~ |
| 38. | Welsh | 35 | 0.01% | 20 | ~ |
| 39. | Gaelic languages | 30 | 0.01% | 10 | ~ |
| 40. |
Note: "n.i.e.": not included elsewhere
There were also about 25 single-language responses for Amharic, 25 for Bisayan languages, 20 for Sinhala and 20 for Slovak. In addition, there were also 435 responses of English and a non-official language; 30 of French and a non-official language; 295 of English and French; and 10 of English, French, and a non-official language. (Figures shown are for the number of single language responses and the percentage of total single-language responses.)[12]
Migration
Immigration
The 2006 Canadian census counted a total of 8,380 immigrants living in Newfoundland and Labrador.
The most commonly reported origins for these immigrants were:[13]
| Rank | Origin | # Immigrants |
|---|---|---|
| 1. | United Kingdom | 2,335 |
| 2. | United States | 1,405 |
| 3. | India | 440 |
| 4. | Germany | 390 |
| 5. | China | 345 |
| 6. | Pakistan | 170 |
| 7. | Philippines | 160 |
| 8= | Rep. of Ireland | 150 |
| 8= | Netherlands | 150 |
| 10= | Egypt | 125 |
| 10= | South Africa | 125 |
| 12. | Colombia | 120 |
There were also about 115 immigrants from Portugal; about 105 each from Hong Kong and from Sudan; about 100 from the former Yugoslavia; about 95 each from El Salvador and from France; about 85 from Iraq; and about 75 each from Sri Lanka and from Russia.
Internal migration
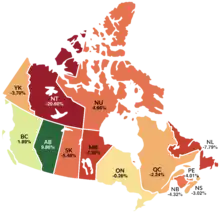
Since it started being recorded in 1971, Newfoundland and Labrador is the province that has lost the biggest share of its population to interprovincial migration, which was especially high in the 1990s. Out-migration from the province was curtailed in 2008 and net migration stayed positive through 2014, when it again dropped due to bleak finances and rising unemployment (caused by falling oil prices). With the announcement of the 2016 provincial budget, St. John's Telegram columnist Russell Wangersky published the column "Get out if you can", which urged young Newfoundlanders to leave the province to avoid future hardships.[14]
| In-migrants | Out-migrants | Net migration | |
|---|---|---|---|
| 2008–09 | 10,262 | 8,385 | 1,877 |
| 2009–10 | 8,998 | 7,440 | 1,558 |
| 2010–11 | 7,785 | 7,755 | 30 |
| 2011–12 | 8,173 | 7,628 | 545 |
| 2012–13 | 7,283 | 6,788 | 495 |
| 2013–14 | 6,994 | 6,760 | 234 |
| 2014–15 | 7,012 | 6,851 | 161 |
| 2015–16 | 6,600 | 6,368 | 232 |
| 2016–17 | 5,400 | 6,830 | −1,430 |
| 2017–18 | 5,187 | 7,920 | −2,733 |
| 2018–19 | 5,207 | 9,706 | −4,501 |
Source: Statistics Canada
Cities and towns
Census Metropolitan Areas and Census Agglomerations in the province by population[15]
| Urban Area | 2016 |
|---|---|
| St. John's (CMA) | 205,955 |
| Corner Brook (CA) | 31,917 |
| Grand Falls-Windsor (CA) | 14,171 |
| Gander (CA) | 13,234 |
| Bay Roberts (CA) | 11,083 |
Municipalities by population
Religion
A 93.2% majority of Newfoundlanders identify as Christian. Among this group, Roman Catholics form a plurality of 38.4%. As Newfoundland and Labrador has received less recent immigration than the rest of Canada, a relatively small number of Christian denominations are represented in the province.
One well-established feature of Newfoundland's religious landscape is the Salvation Army, whose members are more widespread in Newfoundland and Labrador than any other province. Also notable are missionaries of the Moravian Church, who have a long history with the Labrador Inuit of Nunatsiavut, although they were not active in other regions of the province.
- Newfoundland and Labrador census statistics
Religious affiliation (2011):[16]
Christian sub-affiliation (2011):[16]
See also
References
- "Census of Newfoundland and Labrador, 1935, vol. 1 : population by districts and settlements :: NL Books - Reference Sources, Directories, Etc". collections.mun.ca. Retrieved 2020-04-01.
- "Population urban and rural, by province and territory - Newfoundland and Labrador". 2008-05-01. Archived from the original on 2008-03-21. Retrieved 2020-03-30.
- StatCan 2001 Census Archived 2006-12-31 at the Wayback Machine - population
- "Population and dwelling counts (2006 Census)". Statistics Canada. Retrieved 2011-01-10.
- https://www.theglobeandmail.com/news/politics/ottawa-moves-to-tighten-aboriginal-membership-criteria/article17954032/
- Ethnic Origin (232), Sex (3) and Single and Multiple Responses (3) (2001 Census)
- "Aboriginal Peoples Highlight Tables". 2016 Census. Statistics Canada. 2019. Retrieved July 16, 2019.
- "Immigration and Ethnocultural Diversity Highlight Tables". 2016 Census. Statistics Canada. 2019. Retrieved July 16, 2019.
- and Labrador&SearchType=Begins&SearchPR=01&B1=All&Custom=, Community Profiles from the 2006 Census, Statistics Canada - Province/Territory
- and Labrador&SearchType=Begins&SearchPR=01&B1=All&Custom=, Aboriginal Population Profile from the 2006 Census, Statistics Canada - Province/Territory
- "Language Highlight Tables". 2016 Census. Statistics Canada. 2019. Retrieved July 16, 2019.
- Detailed Mother Tongue (186), Knowledge of Official Languages (5), Age Groups (17A) and Sex (3) (2006 Census)
- Immigrant Status and Period of Immigration (8) and Place of Birth (261) (2006 Census)
- Bailey, Sue (19 April 2016). "Exodus? Newfoundland and Labrador's bleak finances fuel angst for the future". CBC News. The Canadian Press. Retrieved 2018-12-28.
- Population and dwelling counts, for urban areas, 2006 and 2001 censuses - 100% data
- "Religion (108) for the Population in Private Households of Canada". 2011 National Household Survey. Statistics Canada. 2019. Retrieved July 16, 2019.
| Ethnic ancestry |
| ||||||||||||||||||||||||||||||||||||||||||||||||
|---|---|---|---|---|---|---|---|---|---|---|---|---|---|---|---|---|---|---|---|---|---|---|---|---|---|---|---|---|---|---|---|---|---|---|---|---|---|---|---|---|---|---|---|---|---|---|---|---|---|
| Demographics |
| ||||||||||||||||||||||||||||||||||||||||||||||||
| Culture and society | |||||||||||||||||||||||||||||||||||||||||||||||||
| List of Canadians |
| ||||||||||||||||||||||||||||||||||||||||||||||||
| |||||||||||||||||||||||||||||||||||||||||||||||||
| Census divisions | |
|---|---|
| Cities | |
| Other communities |
|
| |
| Provinces | |
|---|---|
| Territories | |
| |