Demographics of Saskatchewan
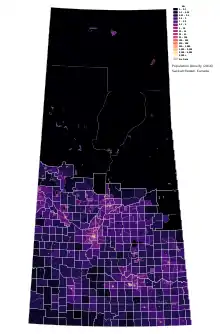
Saskatchewan is the middle province of Canada's three Prairie Provinces. It has an area of 651,900 km² (251,700 mi²) and a population of 1,117,503 (Saskatchewanians) as of January 2014. Most of its population lives in the southern half of the province. The most populous city is Saskatoon with a population of 260,600 (2011) in the Census Metropolitan Area (CMA), followed by the province's capital, Regina with a population of 210,556 (2011) in the CMA. The province's population makeup is also notable for German being the largest European ethnic group and also for the second-largest proportion of people of indigenous descent of any of the provinces, after Manitoba.
Population since 1901
| Year | Population | Five-year % change |
Ten-year % change |
Rank among provinces |
|---|---|---|---|---|
| 1901 | 91,279 | n/a | n/a | 8 |
| 1911 | 492,432 | n/a | 439.5 | 3 |
| 1921 | 757,510 | n/a | 53.8 | 3 |
| 1931 | 921,785 | n/a | 21.7 | 3 |
| 1941 | 895,992 | n/a | -2.8 | 3 |
| 1951 | 831,728 | n/a | -7.2 | 5 |
| 1956 | 880,665 | 5.9 | n/a | 5 |
| 1961 | 925,181 | 5.1 | 11.2 | 5 |
| 1966 | 955,344 | 3.3 | 8.5 | 6 |
| 1971 | 926,242 | -3.0 | 0.1 | 6 |
| 1976 | 921,325 | -0.5 | 3.6 | 6 |
| 1981 | 968,313 | 5.1 | 4.5 | 6 |
| 1986 | 1,009,613 | 4.3 | 9.6 | 6 |
| 1991 | 988,928 | -2.0 | 2.1 | 6 |
| 1996 | 976,615 | -1.2 | -3.3 | 6 |
| 2001 | 978,933 | 0.2 | -1.0 | 6 |
| 2006 | 985,386 | 0.7 | 0.9 | 6 |
| 2011 | 1,053,960 | 7.0 | 7.6 | 6 |
| 2016 | 1,098,352 | 6.3 | 11.4 | 6 |
Source: Statistics Canada.[1][2]
Visible minorities and Aboriginals
| Visible minority and Aboriginal population (Canada 2016 Census) | |||
|---|---|---|---|
| Population group | Population | % of total population | |
| European | 779,665 | 72.8% | |
| Visible minority group Source:[5] | South Asian | 29,960 | 2.8% |
| Chinese | 15,545 | 1.5% | |
| Black | 14,925 | 1.4% | |
| Filipino | 32,340 | 3% | |
| Latin American | 4,195 | 0.4% | |
| Arab | 4,300 | 0.4% | |
| Southeast Asian | 5,745 | 0.5% | |
| West Asian | 2,065 | 0.2% | |
| Korean | 1,875 | 0.2% | |
| Japanese | 955 | 0.1% | |
| Visible minority, n.i.e. | 1,150 | 0.1% | |
| Multiple visible minority | 2,820 | 0.3% | |
| Total visible minority population | 115,875 | 10.8% | |
| Aboriginal group Source:[6] | First Nations | 114,570 | 10.7% |
| Métis | 57,880 | 5.4% | |
| Inuit | 360 | 0% | |
| Aboriginal, n.i.e. | 905 | 0.1% | |
| Multiple Aboriginal identity | 1305 | 0.1% | |
| Total Aboriginal population | 175,020 | 16.3% | |
| Total population | 1,070,560 | 100% | |
Ethnic origins
Note: The following statistics include a combination of individual and multiple responses from the 2001 Census, and therefore do not add up to 100%.[7]
- German 28.6%
- Canadian 25.0%
- English 24.5%
- Scottish 17.9%
- Irish 14.5%
- Ukrainian 12.6%
- French 11.4%
- North American Indian 10.6%
- Norwegian 6.3% (the highest proportion of Canadians of Norwegian descent of any province)
- Polish 5.3%
- Métis 4.2%
- Dutch (Netherlands) 3.4%
- Swedish 3.1%
- Russian 2.9%
- Hungarian (Magyar) 2.5%
- Austrian 1.5%
- Welsh 1.4%
- American (USA) 1.2%
- Romanian 1.1%
- Danish 1.0%
- Chinese 1.0%
Future projections
| Group | 2016[8] | 2036[9][10] | ||
|---|---|---|---|---|
| Number | % of 2016 population (1,098,352) | Number | % of 2036 estimated population (1,378,000) | |
| European origins | 779,665 | 72.8% | 756,000 | 54.9% |
| Aboriginal origins | 175,020 | 16.3% | 289,000 | 21.0% |
| East and Southeast Asian origins | 56,460 | 5.3% | 175,000 | 12.7% |
| South Asian and Middle Eastern origins | 36,325 | 3.4% | 103,000 | 7.5% |
| African origins | 14,925 | 1.4% | 35,000 | 2.5% |
| Latin, Central and South American origins | 4,195 | 0.4% | 11,000 | 0.8% |
| Other | 3,970 | 0.4% | 10,000 | 0.7% |
| *Percentages total over 100% due to multiple responses, e.g. German-Indian, Norwegian-Irish. | ||||
Languages
Knowledge of languages
The question on knowledge of languages allows for multiple responses. The following figures are from the 2016 Canadian Census,[11] and lists languages that were selected by at least one per cent of respondents.
| Language | Responses | % |
|---|---|---|
| English | 1,062,275 | 99.23 |
| French | 51,325 | 4.79 |
| Tagalog | 28,655 | 2.68 |
| Cree[note 1] | 21,870 | 2.04 |
| German | 17,390 | 1.62 |
| Ukrainian | 13,090 | 1.22 |
Mother tongue
Languages of Saskatchewan (2016):[12]
The 2006 census showed a population of 968,157. Of the 946,250 singular responses to the census question concerning mother tongue the languages most commonly reported were:
| Language | 2006 | % | 2001 | % | |
|---|---|---|---|---|---|
| 1. | English | 811,275 | 85.7% | 817,955 | 85.8% |
| 2. | German | 28,555 | 3.0% | 32,515 | 3.4% |
| 3. | Algonquian languages | 26,525 | 2.8% | 23,735 | 2.5% |
| Cree | 24,255 | 2.6% | 22,055 | 2.1% | |
| Ojibway | 1,745 | 0.2% | 1,375 | 0.1% | |
| 4. | Ukrainian | 16,350 | 1.7% | 19,650 | 2.1% |
| 5. | French | 16,060 | 1.7% | 17,775 | 1.9% |
| 6. | Chinese | 7,475 | 0.8% | 6,015 | 0.6% |
| Cantonese | 1,720 | 0.2% | 1,425 | 0.2% | |
| Mandarin | 715 | 0.1% | 395 | <0.1% | |
| 7. | Athapaskan languages | 7,145 | 0.8% | 6,315 | 0.7% |
| Dene | 7,135 | 0.8% | 6,310 | 0.7% | |
| 8. | Polish | 2,510 | 0.4% | 3,015 | 0.3% |
| 9. | Hungarian | 2,190 | 0.2% | 2,700 | 0.3% |
| 10. | Tagalog (Filipino/Pilipino) | 2,170 | 0.2% | 1,545 | 0.2% |
| 11. | Dutch | 1,785 | 0.2% | 1,930 | 0.20% |
| 12. | Scandinavian languages | 1,690 | 0.2% | 2,320 | 0.2% |
| Norwegian | 830 | 0.1% | 1,260 | 0.1% | |
| Danish | 420 | <0.1% | 430 | 0.1% | |
| Swedish | 355 | <0.1% | 525 | 0.1% | |
| 13. | Arabic | 1,525 | 0.12% | 1,090 | 0.11% |
| 14. | Russian | 1,400 | 0.2% | 1,440 | 0.2% |
| 15. | Vietnamese | 1,305 | 0.1% | 1,390 | 0.2% |
| 16. | Serbo-Croatian languages | 1,250 | 0.1% | 1,235 | 0.1% |
| Croatian | 450 | 0.1% | 435 | 0.1% | |
| Bosnian | 335 | <0.1% | N | N | |
| Serbian | 270 | <0.1% | 210 | <0.1% | |
| Serbo-Croatian | 195 | <0.1% | 590 | 0.1% | |
| 17. | Greek | 1,060 | 0.1% | 980 | 0.1% |
| 18. | Panjabi (Punjabi) | 850 | 0.1% | 540 | 0.1% |
| 19. | Persian | 785 | 0.1% | 415 | <0.1% |
| 20. | Romanian | 770 | 0.1% | 775 | 0.1% |
| 21. | Italian | 735 | 0.1% | 895 | 0.1% |
| 22. | Korean | 675 | 0.1% | 425 | <0.1% |
| 23. | Germanic languages n.i.e. | 605 | 0.1% | 375 | <0.1% |
| 24. | Siouan languages (Dakota/Sioux) | 410 | <0.1% | 345 | <0.1% |
| 25. | African languages n.i.e. | 405 | <0.1% | 130 | 0.01% |
| 26. | Portuguese | 380 | <0.1% | 405 | <0.1% |
| 27. | Finnish | 365 | <0.1% | 435 | <0.1% |
| 28. | Hindi | 355 | <0.1% | 320 | <0.1% |
| 29. | Lao | 340 | <0.1% | 275 | 0.03% |
| 30. | Urdu | 330 | <0.1% | 425 | <0.1% |
| 31= | Bantu languages | 325 | <0.1% | 170 | <0.1% |
| Swahili | 105 | <0.1% | 110 | <0.1% | |
| 31= | Czech | 325 | <0.1% | 415 | <0.1% |
| 33. | Berber | 310 | <0.1% | 185 | <0.1% |
| 34. | Japanese | 290 | <0.1% | 185 | <0.1% |
| 35. | Niger–Congo languages n.i.e. | 285 | <0.1% | 100 | <0.1% |
| 36. | Tigrigna | 215 | <0.1% | 190 | <0.1% |
| 37= | Gujarati | 210 | <0.1% | 225 | 0.02% |
| 37= | Slovak | 210 | <0.1% | 100 | <0.1% |
| 37= | Somali | 210 | <0.1% | 35 | ~ |
| 40. | Bengali | 190 | <0.1% | 70 | <0.1% |
Note: "n.i.e.": not included elsewhere
There were also 175 single-language responses for Non-verbal languages (Sign languages); 170 for Amharic; 155 for Turkish; 140 for Sinhala; 135 for Slavic languages n.i.e.; 130 for Slovenian; 120 for Pashto; 115 for Malay; 115 for Malayalam; 115 for Thai; 110 for Ilocano; 110 for Khmer; 100 for Celtic languages; and 100 for Sino-Tibetan languages n.i.e. In addition there were also 6,080 responses of both English and a non-official language; 245 of both French and a non-official language; 1,130 of both English and French; and 140 of English, French and a non-official language. Figures shown are for the number of single language responses and the percentage of total single-language responses.[13]
Migration
Immigration
The 2016 Canadian census counted a total of 112,490 immigrants living in Saskatchewan, 47,935 of whom arrived in the previous 5 years.
The most commonly reported countries of birth for all immigrants living in Saskatchewan were:[14]
| 1. | Philippines | 26,865 |
| 2. | India | 9,630 |
| 3. | China | 7,485 |
| 4. | United Kingdom | 7,020 |
| 5. | Pakistan | 6,860 |
| 6. | United States | 4,845 |
| 7. | Ukraine | 3,280 |
| 8. | Vietnam | 2,620 |
| =9. | Germany | 2,575 |
| =9. | Bangladesh | 2,575 |
| 11. | South Africa | 1,775 |
| 12. | Nigeria | 1,695 |
| 13. | Poland | 1,390 |
| 14. | Mexico | 1,330 |
| 15. | Netherlands | 1,220 |
| 16. | Iraq | 1,175 |
| 17. | Syria | 1,155 |
| 18. | South Korea | 1,125 |
| 19. | Ireland | 840 |
| 20. | Jamaica | 815 |
There were also about 800 immigrants from Russia; 785 from Iran; 770 from Hong Kong; 695 from Romania; 635 from Ethiopia and Somalia; 630 from El Salvador; 605 from Greece; 595 from Eritrea; 585 from Serbia; 570 from Italy; 560 from Myanmar; and 555 from Colombia;
Internal migration
Interprovincial migration has long been a demographic challenge for Saskatchewan, and it was often said that "Saskatchewan's most valuable export [was] its young people".[15] The trend reversed in 2006 as the nascent oil fracking industry started growing in the province, but returned to negative net migration starting in 2013. Most people migrating from Saskatchewan move west to Alberta or British Columbia.[16]
| In-migrants | Out-migrants | Net migration | |
|---|---|---|---|
| 2008–09 | 18,127 | 15,144 | 2,983 |
| 2009–10 | 17,237 | 15,084 | 2,153 |
| 2010–11 | 16,602 | 16,057 | 545 |
| 2011–12 | 19,386 | 17,508 | 1,878 |
| 2012–13 | 16,982 | 16,590 | 392 |
| 2013–14 | 16,371 | 18,210 | −1,839 |
| 2014–15 | 15,346 | 19,874 | −4,528 |
| 2015–16 | 15,260 | 19,532 | −4,272 |
| 2016–17 | 13,130 | 18,890 | −5,760 |
| 2017–18 | 11,637 | 20,112 | −8,475 |
| 2018–19 | 11,637 | 23,607 | −9,688 |
Source: Statistics Canada
Religion
- Saskatchewan Religion statistics
Religious affiliation (2011):[17]
Christian sub-affiliation (2011):[17]
According to the Canada 2001 Census, the most practiced religions in the province were:[18]
- Christianity:
- Protestantism: 449,195;
- Roman Catholicism: 305,390;
- Christian (n.i.e.): 27,070
- Orthodox: 14,280;
- Buddhism: 3,050;
- Islam: 2,230;
- Sikhism: 1,655;
- Hinduism: 1,585;
- Judaism: 865;
With increase immigration from highly religious countries such as the Philippines, the Christian population continues to rise, particularly the Catholic denomination, as well as small amounts of Protestants. 151,455 people declared themselves as without religion.
See also
Notes
- Includes Cree-Montagnais languages not otherwise specified
References
- The history of Saskatchewan's population from Statistics Canada
- Canada's population Archived November 4, 2008, at the Wayback Machine. Statistics Canada. Last accessed September 28, 2006.
- "Aboriginal Peoples Highlight Tables". 2016 Census. Statistics Canada. 2019. Retrieved July 16, 2019.
- "Immigration and Ethnocultural Diversity Highlight Tables". 2016 Census. Statistics Canada. 2019. Retrieved July 16, 2019.
- , Community Profiles from the 2016 Census, Statistics Canada - Province/Territory
- , Aboriginal Population Profile from the 2006 Census, Statistics Canada - Province/Territory
- Ethnic origins Archived 2007-03-13 at the Wayback Machine from Statistics Canada
- "Census Profile, 2016 Census Saskatchewan [Province] and Canada [Country]". Retrieved 19 April 2020.
- "Population by visible minority group, place of residence and projection scenario, Canada, 2011 and 2036". Retrieved 19 April 2020.
- "Projections of the Aboriginal Population and Households in Canada 2011 to 2036" (PDF). Retrieved 19 April 2020.
- "Census Profile, 2016 Census - Saskatchewan [Province] and Quebec [Province] - Language". statcan.gc.ca. Statistics Canada. 9 August 2019. Retrieved 15 October 2019.
- "Language Highlight Tables". 2016 Census. Statistics Canada. 2019. Retrieved July 16, 2019.
- Detailed Mother Tongue (186), Knowledge of Official Languages (5), Age Groups (17A) and Sex (3) (2006 Census)
- Immigrant Status and Period of Immigration (11), Place of Birth (272), Age (7A) and Sex (3) for the Population in Private Households of Canada, Provinces and Territories, Census Divisions and Census Subdivisions, 2016 Census - 25% Sample Data
- Elliot, Doug (2005). Interprovincial Migration - in the Encyclopedia of Saskatchewan. Regina: Canadian Plains Research Center, University of Regina. pp. 483–484.
- "Exodus of Saskatchewan residents to Alberta, British Columbia, continues to plague province | Globalnews.ca". globalnews.ca. 2018-06-06. Archived from the original on 2018-12-29. Retrieved 2018-12-28.
- "Religion (108) for the Population in Private Households of Canada". 2011 National Household Survey. Statistics Canada. 2019. Retrieved July 16, 2019.
- Statistics Canada. "Population by religion, by province and territory (2001 Census) (Quebec, Ontario, Manitoba, Saskatchewan)". Retrieved 26 July 2015.
| History | |
|---|---|
| Politics | |
| Geography |
|
| Law |
|
| Economy |
|
| Culture of Saskatchewan |
|
| Communities | |
| |
| Provinces | |
|---|---|
| Territories | |
| |
| Ethnic ancestry |
| ||||||||||||||||||||||||||||||||||||||||||||||||
|---|---|---|---|---|---|---|---|---|---|---|---|---|---|---|---|---|---|---|---|---|---|---|---|---|---|---|---|---|---|---|---|---|---|---|---|---|---|---|---|---|---|---|---|---|---|---|---|---|---|
| Demographics |
| ||||||||||||||||||||||||||||||||||||||||||||||||
| Culture and society | |||||||||||||||||||||||||||||||||||||||||||||||||
| List of Canadians |
| ||||||||||||||||||||||||||||||||||||||||||||||||
| |||||||||||||||||||||||||||||||||||||||||||||||||