Demographics of Manitoba
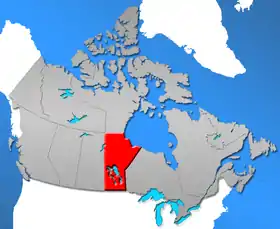
Manitoba is one of Canada's 10 provinces. It is the easternmost of the three Prairie provinces.
Manitoba's capital and largest city (containing over half its population) is Winnipeg. Other important cities and towns include Brandon, Thompson, Dauphin, Swan River, Churchill, The Pas, Selkirk, Portage la Prairie, Gimli, Flin Flon, Steinbach, Morden, Virden, Minnedosa, Emerson, Lockport, Neepawa, and Winkler.
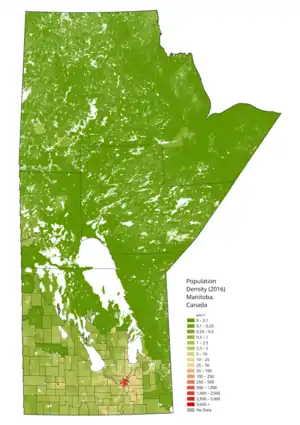
Over one million people live in Manitoba's southern regions, in a small string of cities and towns (Winnipeg, Brandon, etc.) about the size of Ontario's Golden Horseshoe.
Principal Urban Areas
Winnipeg
More than half of Manitoba's 1,148,801 population live in the urban area surrounding the city of Winnipeg. The urban area (UA) covers 448.92 square kilometres and had a 2006 census population of 641,483 (which was an increase of 2.3% from 2001). The City of Winnipeg itself had a 2011 census population of 636,617 (an increase of 4.8% over 2006).
Manitoba Census Division No. 11, which includes both the City of Winnipeg and the Rural Municipality of Headingley, had a 2011 population of 666,832 (an increase of 4.8%). The Rural Municipality of Headingley had a 2011 census population of 3,215 (an increase of 17.9% from 2006) but is not counted as part of the Urban Area by Census Canada.
The Winnipeg Census Metropolitan Area (CMA) includes all of Census Division No. 11 as well as parts of Divisions 02, 10, 12, 13, and 14, and had a 2006 population of 694,668 (which was an increase of 2.7%). The Winnipeg Capital Region comprises the CMA and additional portions of Census Divisions 10, 13, and 14.
Census Division No. 13 includes the Regional Municipality of East St. Paul (with a population of 8,733, of whom 7,475 were included in the population of the UA) and the Regional Municipality of West St. Paul (with a population of 4,357 of whom 2,234 were included in the population of the UA). The Regional Municipality of St. Clements (population 9,706) and the Indian Reservation of Brokenhead 4 (population 467) are also part of the CMA. The Regional Municipality of St. Andrews (population 11,359) along with the City of Selkirk (population 9,515) are to some degree a distinct Urban Area (See 6. below) and while they are part of the Winnipeg Capital Region they are not part of the CMA. The Village of Dunnottar (population 692) is also not part of the CMA.
Census Division No. 02 includes the Regional Municipality of Taché which had a population of 9,083 including the unincorporated Urban Area of Lorette (1,447), and also includes the Regional Municipality of Ritchot which had a population of 5,051 including the unincorporated Urban Area of St. Adolphe (1,048). These Regional Municipalities are both part of the CMA and of the Region. The Regional Municipality of Hanover (population 11,871) and the City of Steinbach (population 11,066) are to some degree a distinct Urban Area (see 5. below). The Town of Niverville (population 2,464) is wedged in between the Regional Municipalities of Hanover and Taché. Census Division No. 02 also includes several other subdivisions.
Census Division No. 12 includes the Rural Municipality of Springfield which had a population of 12,990 including the unincorporated Urban Area of Oakbank (2,075), and which is part of the CMA and the Region. The only other subdivisions of Census Division No. 12 are the City of Beasejour (2,823) and the Rural Municipality of Brokenhead (3,940) both of which are not part of the CMA or the Region.
Census Division No. 10 includes the Regional Municipalities of Macdonald (5,653) and St. François Xavier (1,087).both of which are part of the CMA and the Region. The only other subdivision of Census Division No. 10 is the Regional Municipality of Cartier (3,162) which is part of the Region but not of the CMA.
Census Division No. 14 includes the Regional Municipality of Rosser (1,364) which is part of the CMA. The Regional Municipality of Rockwood with a population of 7,692 including the unincorporated Urban Area of Stony Mountain (1,757), is part of the Region but not part of the CMA. The Town of Stonewall (population 4,376) is a distinct Urban Area (see 12. below). Stonewall and the Town of Teulon (1,124), are completely surrounded by Rockwood. The only other subdivision of Census Division No. 10 is the Regional Municipality of Woodlands (3,562) which is not part of the CMA or of the Region.
Brandon
The City of Brandon had a 2011 census population of 46,061 which was the same as the population of the Urban Area. The Brandon Census Agglomeration had a 2006 census population of 48,256 including the Rural Municipality of Cornwallis, which had a population of 4,058 including the unincorporated urban area of Shilo CFB-BFC (1,314). The Rural Municipality of Whitehead (1,402) and the Rural Municipality of Elton (1,285) are also part of the Census Agglomeration. Brandon is located in Census Division No. 07, which had a 2011 census population of 64,317 and is part of Manitoba's Westman Region. There are several other subdivisions of Census Division No. 07
Steinbach
The City of Steinbach had a 2011 census population of 13,524 which was the same as the population of the urban area. Steinbach is located in Census Division No. 02 which had a 2011 census population of 65,384 and which is part of Manitoba's Eastman Region. Also included in this Census Division (CD) is the Regional Municipality of Hanover (population 14,026), which surrounds the City of Steinbach on three sides, and the Regional Municipalities of Taché and Ritchot which are part of the Winnipeg CMA. The Town of Niverville, with a population of 3,540, is wedged in between the Regional Municipalities of Hanover and Taché.
Portage la Prairie
The City of Portage la Prairie had a 2011 census population of 12,996. The population of the Urban Area was 12,996. The Portage la Prairie Census Agglomeration had a 2006 census population of 20,494, including the Regional Municipality of Portage la Prairie (6,793) as well as several Indian Reservations. Portage la Prairie is located in Census Division No. 09 which had a 2011 census population of 23,489 and is part of Manitoba's Central Plains Region.
Thompson
The City of Thompson had a 2011 census population of 12,829 which was the same as the population of the urban area. The Thompson Census Agglomeration had a 2006 census population of 13,593, including the Local Government District of Mystery Lake (147). Thompson is located in Census Division No. 22 which had a 2011 census population of 40,923 and is part of Manitoba's Northern Region. The next most populous subdivisions of this Census Division (CD) were the Indian Reservations of Norway House 17 (population 4,758) and St. Theresa Point (population 2,871).
Winkler
The City of Winkler had a 2011 census population of 10,670 which was the same as the population of the Urban Area. Winkler is located in Census Division No. 03 which had a 2011 census population of 51,350 and is part of Manitoba's Pembina Valley Region. The City of Winkler is surrounded by the Regional Municipality of Stanley. There are many other subdivisions of this Census Division.
Selkirk
The City of Selkirk had a 2011 census population of 9,834. The population of the Urban Area was 9,834. Selkirk is located in Census Division No. 13 which had a 2011 census population of 46,888 and is part of Manitoba's Interlake Region Region. .Also included in this Census Division are the Regional Municipality of St. Andrews, which surrounds the City of Selkirk on three sides and which had a 2011 census population of 11,875); and the Regional Municipalities of East St. Paul, West St. Paul, and St. Clements, which are part of the Winnipeg CMA; and the Indian Reservation of Brokenhead 4; and the Village of Dunnottar.
Dauphin
The City of Dauphin had a 2016 census population of 8,457 which was the same as the population for the Urban Area. Dauphin is located in Census Division No. 17 which had a 2016 census population of 22,205 and is part of Manitoba's Parkland Region. Also included in this Census Division is the Regional Municipality of Dauphin (2,388) which surrounds the City of Dauphin.
Other urban areas
The Town of Morden had a 2011 census population of 7,812, which was the same as the population for the urban area, and is located in Census Division No. 03. Morden is surrounded by the Regional Municipality of Stanley.(6,367).
The Town of The Pas had a 2011 census population of 5,513. The population of the Urban Area was 5,513 and includes part of the Opaskwayak Cree Nation 21A Indian Reserve. The Pas is located in Census Division No. 21 which had a 2011 census population of 21,393 and is part of Manitoba's Northern Region.
The City of Flin Flon had a 2011 census population of 5,363. The population of the Manitoba part of the Urban Area was also 5,363. Flin Flon is also located in Census Division No. 21.
The Town of Stonewall had a 2011 census population of 4,536 which was the same as the population for the Urban Area. Stonewall is located in Census Division No. 14 which had a 2011 census population of 18,497 and is part of Manitoba's Interlake Region. Stonewall is surrounded by the Regional Municipality of Rockwood (7,692).
The Town of Altona had a 2011 census population of 4,082. The population of the Urban Area was 4,082. Altona is located in Census Division No. 3 which had a 2011 census population of 51,350 and which is part of Manitoba's Pembina Valley Region.
The Town of Swan River had a 2011 census population of 3,907 which was the same as the population of the Urban Area. Swan River is located in Census Division No. 20 which had a 2011 census population of 9,952 and is part of Manitoba's Parkland Region. Also included in this Census Division is the Regional Municipality of Swan River (2,784).
The Town of Neepawa had a 2011 census population of 3,629 which was the same as the population of the Urban Area. Neepawa is located in Census Division No. 6 which had a 2011 census population of 21,604 and is part of Manitoba's Westman Region.
Source: Statistics Canada[1]Source: Statistics Canada[2]
Population since 1871
| Year | Population | Five Year % change |
Ten Year % change |
Rank Among Provinces |
|---|---|---|---|---|
| 1871 | 25,228 | n/a | n/a | 8 |
| 1881 | 62,260 | n/a | 146.8 | 6 |
| 1891 | 152,506 | n/a | 145 | 5 |
| 1901 | 255,211 | n/a | 67.3 | 5 |
| 1911 | 461,394 | n/a | 80.8 | 5 |
| 1921 | 610,118 | n/a | 32.2 | 4 |
| 1931 | 700,139 | n/a | 14.8 | 5 |
| 1941 | 729,744 | n/a | 4.2 | 6 |
| 1951 | 776,541 | n/a | 6.4 | 6 |
| 1956 | 850,040 | 9.5 | n/a | 6 |
| 1961 | 921,686 | 8.4 | 18.7 | 6 |
| 1966 | 963,066 | 4.5 | 13.3 | 5 |
| 1971 | 988,245 | 2.3 | 7.2 | 5 |
| 1976 | 1,021,505 | 3.4 | 6.1 | 5 |
| 1981 | 1,026,241 | 0.4 | 3.8 | 5 |
| 1986 | 1,063,015 | 3.6 | 4.1 | 5 |
| 1991 | 1,091,942 | 2.7 | 6.4 | 5 |
| 1996 | 1,113,898 | 2.0 | 4.8 | 5 |
| 2001 | 1,119,583 | 0.5 | 2.5 | 5 |
| 2006 | 1,148,401 | 2.6 | 3.1 | 5 |
| 2011 | 1,208,268 | 5.2 | 7.9 | 5 |
| 2016 | 1,278,365 | 5.8 | 11.3 | 5 |
Source: Statistics Canada[3][4]
Ethnic origin
Note: the percentages do not necessarily add up to 100% as multiple responses are allowed. Ethnic origins with less than 2% of the responses are not listed.[5]
- 22.1% English
- 19.1% German
- 18.5% Scottish
- 18.2% Canadian
- 14.7% Ukrainian
- 13.4% Irish
- 13.1% French
- 10.6% North American Indian
- 7.3% Polish
- 6.4% Métis
- 4.9% Dutch (Netherlands)
- 4.0% Russian
- 3.4% Filipino
- 2.7% Icelandic
Manitoba is home to the largest Icelandic population outside of Iceland.[6] There are 30,555 people with Icelandic ancestry living in Manitoba, making up 2.7% of the total population of Manitoba .[7] About 35% of the Icelandic-Canadian population lives in Manitoba.[8]
Future projections
| Group | 2016[9] | 2036[10][11] | ||
|---|---|---|---|---|
| Number | % of 2016 population (1,240,000) | Number | % of 2036 estimated population (1,690,000) | |
| European origins | 826,210 | 64.5% | 786,000 | 46.5% |
| Aboriginal origins | 223,310 | 18.0% | 335,000 | 19.8% |
| East and Southeast Asian origins | 117,145 | 9.4% | 306,000 | 18.1% |
| South Asian and Middle Eastern origins | 49,785 | 2.9% | 139,000 | 8.2% |
| African origins | 30,335 | 2.4% | 81,000 | 4.8% |
| Latin, Central and South American origins | 9,895 | 0.8% | 25,000 | 1.5% |
| Other | 9,680 | 0.8% | 19,000 | 1.1% |
| *Percentages total over 100% due to multiple responses, e.g. German-Indian, Norwegian-Irish. | ||||
Visible minorities and Aboriginals
| Visible minority and Aboriginal population (Canada 2006 Census) [14] | |||||
|---|---|---|---|---|---|
| Population group | Population (2011) | % of total population (2011) | Population (2006) | % of total population (2006) | |
| European | 820,780 | 69.89% | 849,025 | 74.9% | |
| Visible minority group Source:[15] | South Asian | 25,265 | 2.15% | 16,565 | 1.5% |
| Chinese | 17,025 | 1.45% | 13,705 | 1.2% | |
| Black | 19,610 | 1.67% | 15,655 | 1.4% | |
| Filipino | 59,220 | 5.04% | 37,790 | 3.3% | |
| Latin American | 9,140 | 0.78% | 6,275 | 0.6% | |
| Arab | 3,235 | 0.28% | 2,325 | 0.2% | |
| Southeast Asian | 7,565 | 0.64% | 5,670 | 0.5% | |
| West Asian | 2,040 | 0.17% | 1,960 | 0.2% | |
| Korean | 3,045 | 0.26% | 2,190 | 0.2% | |
| Japanese | 1,745 | 0.15% | 2,010 | 0.2% | |
| Visible minority, n.i.e. | 1,765 | 0.15% | 1,685 | 0.1% | |
| Multiple visible minority | 3,975 | 0.34% | 3,265 | 0.3% | |
| Total visible minority population | 153,625 | 13.08% | 109,095 | 9.6% | |
| Aboriginal group Source:[16] | First Nations | 130,075 | 11.08% | 100,645 | 8.9% |
| Métis | 77,025 | 6.56% | 71,810 | 6.3% | |
| Inuit | 760 | 0.06% | 560 | 0% | |
| Aboriginal, n.i.e. | N/A | N/A | 1,695 | 0.1% | |
| Multiple Aboriginal identity | N/A | N/A | 680 | 0.1% | |
| Total Aboriginal population | 199,940 | 17.03% | 175,395 | 15.5% | |
| Total population | 1,174,345 | 100% | 1,133,515 | 100% | |
Language
Knowledge of languages
The question on knowledge of languages allows for multiple responses. The following figures are from the 2016 Canadian Census,[17] and lists languages that were selected by at least one per cent of respondents.
| Language | Responses | % |
|---|---|---|
| English | 1,223,665 | 98.62 |
| French | 108,560 | 8.75 |
| German | 61,760 | 4.98 |
| Punjabi | 22,900 | 1.85 |
| Spanish | 20,605 | 1.66 |
| Cree[note 1] | 19,435 | 1.57 |
| Ukrainian | 17,095 | 1.38 |
| Russian | 13,455 | 1.08 |
| Hindi | 12,900 | 1.04 |
| Mandarin | 12,825 | 1.03 |
Mother tongue
The 2006 census showed a population of 1,148,401. Of the 1,118,690 singular responses to the census question concerning mother tongue the languages most commonly reported were:
| 2006 | % | 2001 | % | ||
|---|---|---|---|---|---|
| 1. | English | 838,415 | 75.0% | 823,910 | 75.8% |
| 2. | German | 67,030 | 6.0% | 63,215 | 5.8% |
| 3. | French | 43,955 | 3.9% | 44,335 | 4.1% |
| 4. | Algonquian languages | 33,995 | 3.0% | 31,705 | 2.9% |
| Cree | 19,105 | 1.7% | 18,110 | 1.7% | |
| Ojibway | 9,330 | 0.8% | 8,885 | 0.8% | |
| Oji-Cree | 5,430 | 0.5% | 4,605 | 0.4% | |
| 5. | Tagalog (Filipino/Pilipino) | 22,490 | 2.0% | 18,385 | 1.7% |
| 6. | Ukrainian | 21,950 | 2.0% | 26,540 | 2.4% |
| 7. | Chinese | 11,045 | 1.0% | 9,190 | 0.9% |
| Cantonese | 3,105 | 0.3% | 2,530 | 0.2% | |
| Mandarin | 1,470 | 0.1% | 700 | 0.1% | |
| 8. | Polish | 8,870 | 0.8% | 9,915 | 0.9% |
| 9. | Panjabi (Punjabi) | 6,340 | 0.6% | 5,420 | <0.1% |
| 10. | Italian | 4,775 | 0.4% | 4,945 | 0.5% |
| 11. | Dutch | 3,835 | 0.3% | 3,975 | 0.4% |
| 12. | Russian | 3,450 | 0.3% | 1,730 | 0.2% |
| 13. | Serbo-Croatian languages | 2,880 | 0.3% | 3,020 | 0.3% |
| Croatian | 1,420 | 0.1% | 1,595 | 0.2% | |
| Serbian | 585 | 0.1% | 400 | <0.1% | |
| Bosnian | 565 | 0.1% | N | N | |
| Serbo-Croatian | 340 | <0.1% | 1,025 | 0.1% | |
| 14. | Vietnamese | 2,740 | 0.2% | 2,950 | 0.3% |
| 15. | Arabic | 2,125 | 0.2% | 1,285 | 0.1% |
| 16. | Scandinavian languages | 2,040 | 0.2% | 2,005 | 0.2% |
| Icelandic | 1,040 | 0.1% | 1,135 | 0.1% | |
| Danish | 535 | 0.1% | 365 | <0.1% | |
| Swedish | 310 | <0.1% | 330 | <0.1% | |
| Norwegian | 150 | <0.1% | 170 | <0.1% | |
| 17. | Korean | 1,950 | 0.2% | 870 | 0.1% |
| 18. | Hungarian | 1,800 | 0.2% | 1,840 | 0.2% |
| 19. | Persian | 1,775 | 0.2% | 685 | 0.1% |
| 20. | Greek | 1,635 | 0.2% | 1,310 | 0.1% |
| 21. | Amharic | 1,440 | 0.1% | 790 | 0.1% |
| 22. | Urdu | 1,190 | 0.1% | 545 | 0.1% |
| 23. | Hindi | 1,120 | 0.1% | 710 | 0.1% |
| 24. | Lao | 1,035 | 0.1% | 1,140 | 0.1% |
| 25. | Athapaskan languages | 900 | 0.1% | 860 | 0.1% |
| Dene | 890 | 0.1% | 845 | 0.1% | |
| 26. | Czech | 895 | 0.1% | 905 | 0.1% |
| 27. | Gujarati | 890 | 0.1% | 405 | <0.1% |
| 28= | Bantu languages | 700 | 0.1% | 410 | <0.1% |
| Swahili | 205 | <0.1% | 115 | <0.1% | |
| 28= | Japanese | 700 | 0.1% | 550 | 0.1% |
| 30. | Romanian | 655 | 0.1% | 595 | 0.1% |
| 31. | Flemish | 650 | 0.1% | 795 | 0.1% |
| 32. | Ilocano | 645 | 0.1% | N | N |
| 33= | Creole | 640 | 0.1% | 220 | <0.1% |
| 33= | Yiddish | 640 | 0.1% | 1,065 | 0.1% |
| 35. | Siouan languages (Dakota/Sioux) | 630 | 0.1% | 730 | 0.1% |
| 36= | African languages n.i.e. | 540 | 0.1% | 230 | <0.1% |
| 36= | Somali | 540 | 0.1% | 155 | <0.1% |
| 38. | Germanic languages n.i.e. | 520 | 0.1% | 410 | <0.1% |
| 39. | Khmer (Cambodian) | 495 | 0.1% | 350 | <0.1% |
| 40. | Slovak | 465 | <0.1% | 665 | 0.1% |
Note: "n.i.e.": not included elsewhere
There were also about 430 single-language responses for Bisayan languages; 395 for Niger–Congo languages n.i.e.; and 350 for Tigrigna; as well as about 345 for non-verbal languages (sign languages); 340 for Bengali; 330 for Finnish; 325 for Sinhala; 310 for Kurdish; 275 for Tamil; 260 for Slovenian; 230 for Latvian; 220 for Hebrew; and about 220 as well for Slavic languages n.i.e.; and 210 for Indo-Iranian languages n.i.e.; 195 for Malayo-Polynesian languages n.i.e; 180 for Oromo; 170 for Pampango; 155 for Celtic languages; 155 for Macedonian; 140 for Inuktitut; 135 for Lithuanian; 120 for Bulgarian; and about 120 as well for Malayalam. {Mother tongues of more than 114 persons (0.01%) are listed.}[18] In addition to the single-language responses detailed above, about 34,935 people reported having more than one mother tongue. There were about 11,675 responses of English and a non-official language; 465 of French and a non-official language; 2,630 of both English and French; and 85 of English, French and a non-official language. Approximately 2,555 people reported having Tagalog as a dual mother tongue; while about 2,060 people reported having German; 1,510 people reported having Cree; 1,385 Ukrainian; 645 Ojibway; 475 Spanish; 365 Portuguese; 310 Polish; and about 280 people reported having Panjabi, as a dual mother tongue. {Dual mother tongues of more than 228 persons (0.02%) are listed.}[19]
Migration
Immigration
The 2006 Canadian census counted a total of 151,230 immigrants living in Manitoba, 92,535 of whom arrived before 1991.
The most commonly reported countries of birth for immigrants living in Manitoba were:[20]
| 1. | Philippines | 25,490 |
| 2. | United Kingdom | 15,225 |
| 3. | Germany | 9,045 |
| 4. | Poland | 7,355 |
| 5. | United States | 7,090 |
| 6. | India | 6,765 |
| 7. | Mexico | 6,155 |
| 8. | Portugal | 4,565 |
| 9. | Ukraine | 4,330 |
| 10. | China | 4,310 |
| 11. | Paraguay | 4,025 |
| 12. | Yugoslavia | 3,535 |
| 13. | Vietnam | 3,460 |
| 14. | Italy | 3,455 |
| 15. | Russia | 3,135 |
| 16. | Netherlands | 3,015 |
| 17. | South Korea | 1,950 |
| 18. | Trinidad and Tobago | 1,610 |
| 19. | Ethiopia | 1,555 |
| 20. | El Salvador | 1,475 |
In addition to the countries listed in the table on the left there were also about 1,465 immigrants from Guyana; and about 1,435 from Jamaica; 1,420 from Hong Kong; 1,205 from Pakistan; 1,185 from Hungary; 1,095 from South Africa; 975 from Laos; 940 from Iran; 930 from Chile; 905 from Greece; 900 from Romania; 765 from Sudan; 735 from France; 730 from Afghanistan; 720 from Argentina; 700 from Sierra Leone; 650 from Ireland (Éire); 610 from the Czech Republic; 590 from Austria; 505 from Belize; 505 from Bolivia; 495 from Iraq; 490 from Belgium; 490 from Colombia; 470 from Kazakhstan; 460 from Denmark; 405 from Sri Lanka; 380 from Slovakia; 365 from Kenya; 360 from Brazil; 355 from Nigeria; 350 from Nicaragua; 345 from Somalia; 340 from Guatemala; 335 from Cambodia; 325 from Switzerland; 305 from Malaysia; 300 from the Democratic Republic of the Congo; 300 from Thailand; 295 from Israel; 290 from Egypt; 290 from Eritrea; 245 from Australia; and 230 from Barbados.
{Countries of birth for more than 228 persons (0.02%) are shown.}
Internal migration
Manitoba is one of the provinces most affected by Interprovincial migration, having had a negative mobility ratio for 42 out of 46 years from 1971 to 2017. This is the second-worst record for years of negative interprovincial migration, followed only by Quebec.[21]
| In-migrants | Out-migrants | Net migration | |
|---|---|---|---|
| 2008–09 | 11,916 | 15,027 | −3,111 |
| 2009–10 | 11,786 | 14,198 | −2,412 |
| 2010–11 | 11,085 | 14,602 | −3,517 |
| 2011–12 | 11,443 | 15,655 | −4,212 |
| 2012–13 | 9,988 | 14,994 | −5,006 |
| 2013–14 | 9,452 | 16,303 | −6,851 |
| 2014–15 | 10,022 | 16,700 | −6,678 |
| 2015–16 | 10,994 | 15,875 | −4,881 |
| 2016–17 | 10,350 | 15,474 | −5,124 |
| 2017–18 | 9,578 | 16,726 | −7,148 |
| 2018–19 | 10,351 | 19,597 | −9,246 |
Source: Statistics Canada
Religious groups
- 43.1651% Protestant
- 29.3% Roman Catholic
- 4.0% Christian not included elsewhere
- 1.4% Christian Orthodox
- 1.1% Jewish
- 18.6% No religious affiliation
- Religions that make up less than 1% are not listed.[22]
See also
Notes
- Includes Cree-Montagnais languages not otherwise specified
References
- "Population and dwelling counts, for Canada, provinces and territories, and urban areas, 2006 and 2001 censuses - 100% data". 12.statcan.ca. Retrieved 19 August 2017.
- Canada, Government of Canada, Statistics. "Population and dwelling counts, for Canada, provinces and territories, census divisions, and census subdivisions (municipalities), 2011 and 2006 censuses". 12.statcan.ca. Retrieved 19 August 2017.
- Statcan Archived 2006-12-31 at the Wayback Machine - Manitoba Population trend
- "Population and dwelling counts, for Canada, provinces and territories, 2006 and 2001 censuses - 100% data". 12.statcan.ca. Retrieved 19 August 2017.
- Canada, Government of Canada, Statistics. "Statistics Canada: Ethnocultural Portrait of Canada Highlight Tables, 2006 Census". 12.statcan.gc.ca. Retrieved 19 August 2017.
- "Manitoba Icelandic Population". Gov.mb.ca. Archived from the original on 2007-09-30. Retrieved 19 August 2017.
- Statcan - Icelandic Canadians living in Manitoba
- "Census Profile, 2016 Census Manitoba [Province] and Canada [Country]". Retrieved 19 April 2020.
- "Population by visible minority group, place of residence and projection scenario, Canada, 2011 and 2036". Retrieved 19 April 2020.
- "Projections of the Aboriginal Population and Households in Canada 2011 to 2036" (PDF). Retrieved 19 April 2020.
- "Aboriginal Peoples Highlight Tables". 2016 Census. Statistics Canada. 2019. Retrieved 16 July 2019.
- "Immigration and Ethnocultural Diversity Highlight Tables". 2016 Census. Statistics Canada. 2019. Retrieved 16 July 2019.
- Canada, Government of Canada, Statistics. "2011 National Household Survey Profile - Province/Territory". 12.statcan.gc.ca. Retrieved 19 August 2017.
- "Statistics Canada: 2006 Community Profiles". 12.statcan.gc.ca. Retrieved 19 August 2017.
- "Statistics Canada: 2006 Aboriginal Population Profile". 12.statcan.gc.ca. Retrieved 19 August 2017.
- "Census Profile, 2016 Census - Manitoba [Province] and Canada [Country] - Language". statcan.gc.ca. Statistics Canada. 9 August 2019. Retrieved 15 October 2019.
- contenu, English name of the content author / Nom en anglais de l'auteur du. "English title / Titre en anglais". 12.statcan.ca. Retrieved 19 August 2017.
- contenu, English name of the content author / Nom en anglais de l'auteur du. "English title / Titre en anglais". 12.statcan.ca. Retrieved 19 August 2017.
- contenu, English name of the content author / Nom en anglais de l'auteur du. "English title / Titre en anglais". 12.statcan.ca. Retrieved 19 August 2017.
- Clemens, Jason. "Interprovincial Migration in Canada: Quebeckers Vote with Their Feet" (PDF). Fraser Institute. Retrieved 1 April 2020.
- Statcan 2001 Census - Manitoba Religious groups
| Provinces | |
|---|---|
| Territories | |
| |
| Ethnic ancestry |
| ||||||||||||||||||||||||||||||||||||||||||||||||
|---|---|---|---|---|---|---|---|---|---|---|---|---|---|---|---|---|---|---|---|---|---|---|---|---|---|---|---|---|---|---|---|---|---|---|---|---|---|---|---|---|---|---|---|---|---|---|---|---|---|
| Demographics |
| ||||||||||||||||||||||||||||||||||||||||||||||||
| Culture and society | |||||||||||||||||||||||||||||||||||||||||||||||||
| List of Canadians |
| ||||||||||||||||||||||||||||||||||||||||||||||||
| |||||||||||||||||||||||||||||||||||||||||||||||||