Demographics of Yukon
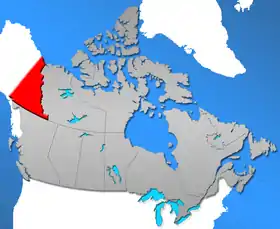
Yukon is the westernmost of Canada's three northern territories. Its capital is Whitehorse. People from Yukon are known as Yukoners (French: Yukonnais).
Population of Yukon: 35,874 (2016)[1]
Percentage of Canadian population : 0.10%
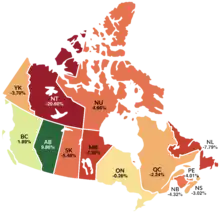
Population growth rate for 2007: +5.8%
Population of Yukon since 1901
| Year | Population | Five-year % change |
Ten-year % change |
Rank among provinces and territories |
|---|---|---|---|---|
| 1901 | 27,219 | n/a | n/a | 10 |
| 1911 | 8,512 | n/a | -68.7 | 10 |
| 1921 | 4,157 | n/a | -51.1 | 10 |
| 1931 | 4,230 | n/a | 1.8 | 11 |
| 1941 | 4,914 | n/a | 16.2 | 11 |
| 1951 | 9,096 | n/a | 85.1 | 12 |
| 1956 | 12,190 | 34.0 | n/a | 12 |
| 1961 | 14,628 | 20.0 | 60.8 | 12 |
| 1966 | 14,382 | -1.7 | 18.0 | 12 |
| 1971 | 18,390 | 27.9 | 25.7 | 12 |
| 1976 | 21,835 | 18.7 | 51.8 | 12 |
| 1981 | 23,150 | 6.0 | 25.9 | 12 |
| 1986 | 23,505 | 1.5 | 7.6 | 12 |
| 1991 | 27,797 | 18.3 | 20.1 | 12 |
| 1996 | 30,766 | 10.7 | 30.9 | 12 |
| 2001 | 28,674 | -6.8 | 3.2 | 12 |
| 2006 | 30,372 | 5.9 | -1.3 | 12 |
| 2011 | 33,897 | 11.6 | 18.2 | 12 |
| 2016 | 35,874 | 5.8 | 13.6 | 13 |
Source: Statistics Canada[2][3][4][1]
Major communities
| Municipality | 2016 | 2011 | 2006 | 2001 |
|---|---|---|---|---|
| Whitehorse | 25,085 | 23,276 | 20,461 | 19,058 |
| Dawson | 1,375 | 1,319 | 1,327 | 1,251 |
| Watson Lake | 790 | 802 | 846 | 912 |
| Haines Junction | 613 | 593 | 589 | 531 |
| Carmacks | 493 | 503 | 425 | 431 |
| Mt. Lorne | 437 | 408 | 370 | 379 |
| Ibex Valley | 411 | 346 | 376 | 315 |
| Pelly Crossing | 353 | 336 | 296 | 328 |
| Faro | 348 | 344 | 341 | 313 |
| Carcross | 301 | 289 | 280 | 152 |
| Ross River | 293 | 352 | 313 | 337 |
| Tagish | 249 | 391 | 222 | 206 |
| Old Crow | 221 | 245 | 253 | 299 |
| Mayo | 200 | 226 | 248 | 267 |
Visible minorities and Indigenous Peoples
| Total population | Total aboriginal | First Nation | Métis | Inuit | Multiple | Other | Percentage of total | ||
|---|---|---|---|---|---|---|---|---|---|
| Yukon | Total | 30,650 | 6,175 | 5,330 | 550 | 95 | 30 | 170 | 20.1% |
| Male | 15,810 | 2,965 | 2,850 | 260 | 40 | 10 | 80 | 18.7% | |
| Female | 14,840 | 3,210 | 2,750 | 290 | 55 | 20 | 90 | 21.6% | |
| Canada | Total | 28,528,125 | 799,010 | 529,035 | 204,115 | 40,225 | 6,415 | 19,215 | 2.8% |
| Male | 14,046,880 | 390,870 | 258,330 | 101,435 | 20,180 | 3,175 | 7,750 | 2.8% | |
| Female | 14,481,245 | 408,140 | 270,700 | 102,685 | 20,040 | 3,240 | 11,465 | 2.8% |
| Rk | Name | Total pop. | Aboriginal pop. | Percent | Rk | Name | Total pop. | Aboriginal pop. | Percent |
|---|---|---|---|---|---|---|---|---|---|
| 1 | Upper Liard | 110 | 110 | 100% | 12 | Beaver Creek | 130 | 60 | 46.1% |
| 2 | Two Mile Village | 100 | 100 | 100% | 13 | Haines Junction | 575 | 230 | 40.0% |
| 3 | Two and 1/2 Mile Village | 40 | 40 | 100% | 14 | Ibex Valley | 320 | 90 | 28.2% |
| 4 | Old Crow | 280 | 250 | 89.3% | 15 | Watson Lake | 995 | 220 | 27.1% |
| 5 | Pelly Crossing | 240 | 205 | 84.5% | 16 | Dawson City | 1280 | 345 | 26.9% |
| 6 | Ross River | 350 | 275 | 78.6% | 17 | Tagish | 165 | 40 | 26.7% |
| 7 | Carcross | 275 | 185 | 67.3% | 18 | "Unorganised" | 1855 | 345 | 18.6% |
| 8 | Burwash Landing | 60 | 40 | 66.7% | 19 | Whitehorse | 20,960 | 2,775 | 13.2% |
| 9 | Teslin | 305 | 195 | 63.9% | 20 | Mount Lorne | 400 | 35 | 8.75% |
| 10 | Carmacks | 465 | 295 | 63.4% | 21 | Faro | 1260 | 80 | 6.34% |
| 11 | Mayo | 320 | 200 | 62.5% | 22 | Stewart Crossing | 45 | 0 | 0% |
| Visible minority and Aboriginal population (Canada 2006 Census) | |||
|---|---|---|---|
| Population group | Population | % of total population | |
| European | 21,395 | 70.9% | |
| Visible minority group Source:[7] | South Asian | 195 | 0.6% |
| Chinese | 325 | 1.1% | |
| Black | 125 | 0.4% | |
| Filipino | 210 | 0.7% | |
| Latin American | 100 | 0.3% | |
| Arab | 20 | 0.1% | |
| Southeast Asian | 145 | 0.5% | |
| West Asian | 10 | 0% | |
| Korean | 10 | 0% | |
| Japanese | 40 | 0.1% | |
| Visible minority, n.i.e. | 15 | 0% | |
| Multiple visible minority | 40 | 0.1% | |
| Total visible minority population | 1,220 | 4% | |
| Aboriginal group Source:[8] | First Nations | 6,280 | 20.8% |
| Métis | 800 | 2.6% | |
| Inuit | 255 | 0.8% | |
| Aboriginal, n.i.e. | 190 | 0.6% | |
| Multiple Aboriginal identity | 55 | 0.2% | |
| Total Aboriginal population | 7,580 | 25.1% | |
| Total population | 30,195 | 100% | |
Languages
The 2006 Canadian census showed a population of 30,372.
Of the 29,940 singular responses to the census question concerning 'mother tongue' the most commonly reported languages were:
| 1. | English | 25,655 | 85.69% |
| 2. | French | 1,105 | 3.69% |
| 3. | German | 775 | 2.59% |
| 4. | Athapaskan languages | 650 | 2.17% |
| Gwich'in | 75 | 0.25% | |
| North Slavey | 30 | 0.10% | |
| 5. | Chinese | 260 | 0.87% |
| Cantonese | 85 | 0.28% | |
| Mandarin | 70 | 0.23% | |
| 6. | Malayo-Polynesian languages | 165 | 0.55% |
| Tagalog | 145 | 0.48% | |
| 7. | Dutch | 140 | 0.47% |
| 8. | Spanish | 130 | 0.43% |
| 9. | Vietnamese | 105 | 0.35% |
| 10. | Yugoslavian languages | 95 | 0.32% |
| Slovenian | 45 | 0.15% | |
| 11= | Hungarian | 80 | 0.27% |
| 11= | Panjabi | 80 | 0.27% |
| 13. | Tlingit | 70 | 0.23% |
| 14= | Algonquian languages | 55 | 0.18% |
| Cree | 50 | 0.17% | |
| 14= | Russian | 55 | 0.18% |
| 14= | Inuktitut | 55 | 0.18% |
There were also about 40 single-language responses for Ukrainian; 30 each for Czech and the Scandinavian languages; and about 25 single-language responses each for Italian and Japanese. In addition, there were also 130 responses of both English and a 'non-official language'; 10 of both French and a 'non-official language'; 110 of both English and French; and about 175 people who either did not respond to the question, or reported multiple non-official languages, or else gave some other unenumerated response. The Yukon's official languages are shown in bold. (Figures shown are for the number of single language responses and the percentage of total single-language responses.)[9]
Migration
Immigration
The 2006 Canadian census counted a total of 3,010 immigrants living in Yukon.
The most commonly reported countries of birth for these immigrants were:
[10]
| Country | Amount |
|---|---|
| United States | 600 |
| United Kingdom | 555 |
| Germany | 405 |
| Philippines | 160 |
| Switzerland | 125 |
| Netherlands | 110 |
| Vietnam | 90 |
| China | 85 |
| former Yugoslavia | 80 |
| France | 75 |
| India | 70 |
| Hungary | 50 |
There were also about forty immigrants from Austria and New Zealand, thirty from the Czech Republic and South Africa, and about twenty-five each from Belgium, Ireland and Poland.
Internal migration
A total of 7,400 people moved to Yukon from other parts of Canada between 1996 and 2006 while 10,505 people moved in the opposite direction. These movements resulted in a net influx of 230 from the Northwest Territories; and a net outmigration of 2,505 to Alberta, 915 to British Columbia and 115 to New Brunswick. There was a net influx of 120 francophones from Quebec during this period. (All net inter-provincial and official minority movements of more than 100 persons are given.)[11][12]
See also
References
- "Population and dwelling counts, for Canada, provinces and territories, 2016 and 2011 censuses". Statistics Canada. February 2, 2017. Retrieved April 30, 2017.
- Population urban and rural, by province and territory Archived 2007-03-10 at the Wayback Machine. Statistics Canada. Last accessed February 13, 2007.
- Canada's population Archived November 4, 2008, at the Wayback Machine. Statistics Canada. Last accessed September 28, 2006.
- "Population and dwelling counts, for Canada, provinces and territories, 2011 and 2006 censuses". Statistics Canada. 2012-04-11. Retrieved 2012-04-28.
- "Census Program". Statistics Canada. Statistics Canada. Retrieved April 30, 2017.
- "Aboriginal Data - Census '96" (PDF). Eco.gov.uk. Retrieved 27 May 2018.
- Canada, Government of Canada, Statistics. "Statistics Canada: 2006 Community Profiles". 12.statcan.gc.ca. Retrieved 27 May 2018.
- Canada, Government of Canada, Statistics. "Statistics Canada: 2006 Aboriginal Population Profile". 12.statcan.gc.ca. Retrieved 27 May 2018.
- contenu, English name of the content author / Nom en anglais de l'auteur du. "English title / Titre en anglais". 12.statcan.ca. Retrieved 27 May 2018.
- contenu, English name of the content author / Nom en anglais de l'auteur du. "English title / Titre en anglais". 12.statcan.ca. Retrieved 27 May 2018.
- Province or Territory of Residence 5 Years Ago (14), Mother Tongue (8), Age Groups (16) and Sex (3) (2006 Census) Archived February 11, 2009, at the Wayback Machine
- "File not found - Fichier non trouvé". 12.statcan.ca. Retrieved 27 May 2018.
| Provinces | |
|---|---|
| Territories | |
| |
| Ethnic ancestry |
| ||||||||||||||||||||||||||||||||||||||||||||||||
|---|---|---|---|---|---|---|---|---|---|---|---|---|---|---|---|---|---|---|---|---|---|---|---|---|---|---|---|---|---|---|---|---|---|---|---|---|---|---|---|---|---|---|---|---|---|---|---|---|---|
| Demographics |
| ||||||||||||||||||||||||||||||||||||||||||||||||
| Culture and society | |||||||||||||||||||||||||||||||||||||||||||||||||
| List of Canadians |
| ||||||||||||||||||||||||||||||||||||||||||||||||
| |||||||||||||||||||||||||||||||||||||||||||||||||