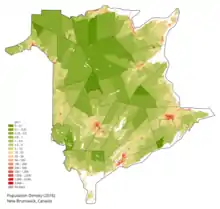
Demographics of New Brunswick
New Brunswick is one of Canada's three provinces of the Maritimes, and the only officially bilingual province (French and English) in the country. The provincial Department of Finance estimates that the province's population in 2006 was 729,997 of which the majority is English-speaking but with a substantial French-speaking minority of mostly Acadian origin.[1]
First Nations in New Brunswick include the Mi'kmaq and Wolastoqiyik (Maliseet). The first European settlers, the Acadians are descendants of French settlers and also some of the Indigenous peoples of Acadia, a French colony in what is today Nova Scotia. The Acadians were expelled by the British (1755) for refusing to take an oath of allegiance to King George II which drove several thousand Acadian residents into exile in North America, the UK and France during the French and Indian War. American Acadians, who wound up in Louisiana and other parts of the American South, are often referred to as Cajuns, although some are not of Acadian origin. In time, some Acadians returned to the Maritime provinces of Canada, mainly to New Brunswick,[2] due to the British prohibiting them from resettling their lands and villages in what became Nova Scotia.
Many of the English-Canadian population of New Brunswick are descended from Loyalists who fled the American Revolution. This is commemorated in the province's motto, Spem reduxit ("hope was restored"). There is also a significant population with Irish ancestry, especially in Saint John and the Miramichi Valley. People of Scottish descent are scattered throughout the Province with higher concentrations in the Miramichi and in Campbellton. A small population of Danish origin may be found in New Denmark in the northwest of the province.
Population
City Metropolitan Areas
| City | 2011 | 2006 | Land Area km² | Density /km² |
|---|---|---|---|---|
| Greater Moncton | 138,644 | 126,424 | 2,406.31 | 57.6 |
| Greater Saint John | 127,761 | 122,389 | 3,362.95 | 38.0 |
| Greater Fredericton | 94,268 | 85,688 | 4,886.40 | 19.3 |
| Greater Bathurst | 33,484 | 34,106 | 2,292.80 | 14.6 |
| Greater Miramichi | 28,115 | 28,773 | 7,578.30 | 3.7 |
| Greater Edmundston | 21,903 | 22,471 | 916.85 | 23.9 |
| Greater Campbellton | 17,842 | 17,878 | 1,629.94 | 10.9 |
Cities and towns
| Town | Population (2011) | Population Ranking | Land Area km² | Area Ranking | Density /km² | Density Ranking |
|---|---|---|---|---|---|---|
| Bathurst | 12,275 | 9 | 91.86 | 6 | 133.6 | 24 |
| Beresford | 4,351 | 20 | 19.20 | 17 | 226.6 | 18 |
| Bouctouche | 2,423 | 26 | 18.34 | 19 | 132.1 | 25 |
| Campbellton | 7,385 | 12 | 18.66 | 18 | 395.7 | 9 |
| Caraquet | 4,169 | 23 | 68.26 | 8 | 61.1 | 35 |
| Dalhousie | 3,512 | 24 | 14.51 | 23 | 242.1 | 17 |
| Dieppe | 23,310 | 4 | 54.11 | 11 | 430.8 | 6 |
| Edmundston | 16,032 | 8 | 107.00 | 5 | 149.8 | 23 |
| Florenceville-Bristol | 1,639 | 29 | 15.61 | 22 | 105.0 | 29 |
| Fredericton | 56,224 | 3 | 131.67 | 4 | 427.0 | 7 |
| Grand Bay–Westfield | 5,117 | 17 | 59.86 | 9 | 85.5 | 33 |
| Grand Falls | 5,706 | 14 | 18.05 | 20 | 315.9 | 13 |
| Hampton | 4,292 | 22 | 21.00 | 16 | 204.3 | 21 |
| Hartland | 947 | 35 | 9.63 | 30 | 98.4 | 31 |
| Lamèque | 1,432 | 31 | 12.45 | 28 | 115.1 | 27 |
| Miramichi | 17,811 | 7 | 179.93 | 2 | 99.0 | 30 |
| McAdam | 1,404 | 32 | 14.47 | 24 | 97.02 | 32 |
| Moncton | 69,074 | 2 | 141.17 | 3 | 489.3 | 2 |
| Nackawic | 1,049 | 34 | 8.40 | 32 | 124.9 | 26 |
| Oromocto | 8,932 | 11 | 22.37 | 15 | 399.2 | 8 |
| Quispamsis | 17,886 | 6 | 57.06 | 10 | 313.5 | 14 |
| Richibucto | 1,286 | 33 | 11.83 | 27 | 108.7 | 28 |
| Riverview | 19,128 | 5 | 33.88 | 13 | 564.6 | 1 |
| Rothesay | 11,947 | 10 | 34.77 | 12 | 343.6 | 12 |
| Sackville | 5,558 | 15 | 74.32 | 7 | 74.8 | 34 |
| Saint Andrews | 1,889 | 28 | 8.35 | 33 | 226.2 | 19 |
| Saint John | 70,063 | 1 | 315.82 | 1 | 221.8 | 20 |
| Saint-Léonard | 1,343 | 32 | 5.20 | 34 | 258.3 | 16 |
| Saint-Quentin | 2,095 | 27 | 4.30 | 35 | 486.7 | 3 |
| Shediac | 6,053 | 13 | 12.50 | 26 | 484.4 | 4 |
| Shippagan | 2,603 | 25 | 9.94 | 29 | 261.9 | 15 |
| St. George | 1,543 | 30 | 16.13 | 21 | 95.6 | 32 |
| St. Stephen | 4,817 | 19 | 13.45 | 24 | 358.0 | 11 |
| Sussex | 4,312 | 21 | 9.03 | 31 | 477.4 | 5 |
| Tracadie–Sheila | 4,933 | 18 | 24.65 | 14 | 200.1 | 22 |
| Woodstock | 5,254 | 16 | 13.41 | 25 | 391.7 | 10 |
Population of New Brunswick since 1851
| Year | Population | Five Year % change |
Ten Year % change |
Rank Among Provinces |
|---|---|---|---|---|
| 1824 | 74,176 | n/a | n/a | n/a |
| 1834 | 119,457 | n/a | 61.0 | n/a |
| 1841 | 156,162 | n/a | n/a | n/a |
| 1851 | 193,800 | n/a | 24.1 | n/a |
| 1861 | 252,047 | n/a | 30.0 | n/a |
| 1871 | 285,594 | n/a | 13.3 | 4 |
| 1881 | 321,233 | n/a | 12.5 | 4 |
| 1891 | 321,263 | n/a | 0.0 | 4 |
| 1901 | 331,120 | n/a | 3.1 | 4 |
| 1911 | 351,889 | n/a | 6.3 | 8 |
| 1921 | 387,876 | n/a | 10.2 | 8 |
| 1931 | 408,219 | n/a | 5.2 | 8 |
| 1941 | 457,401 | n/a | 12.0 | 8 |
| 1951 | 515,697 | n/a | 12.7 | 8 |
| 1956 | 554,616 | 7.5 | n/a | 8 |
| 1961 | 597,936 | 7.8 | 15.9 | 8 |
| 1966 | 616,788 | 3.2 | 11.2 | 8 |
| 1971 | 634,560 | 2.9 | 6.9 | 8 |
| 1976 | 677,250 | 6.7 | 9.8 | 8 |
| 1981 | 696,403 | 2.8 | 9.7 | 8 |
| 1986 | 709,445 | 1.9 | 4.8 | 8 |
| 1991 | 723,900 | 2.0 | 3.9 | 8 |
| 1996 | 738,133 | 2.0 | 4.0 | 8 |
| 2001 | 729,498 | -1.2 | 0.8 | 8 |
| 2006 | 729,997 | 0.1 | -1.1 | 8 |
| 2011 | 751,171 | 2.9 | 3.0 | 8 |
| 2016 | 747,101 | -0.5 | 2.3 | 8 |
Source:[3] Statistics Canada [4][5]
Ethnic origin
| Ethnic Origin | Population | Percent |
|---|---|---|
| English Canadian / Canadien | 415,810 | 57.78% |
| French | 193,470 | 26.8% |
| English | 165,235 | 22.96% |
| Irish | 135,835 | 18.87% |
| Scottish | 127,635 | 17.73% |
| German | 27,490 | 3.82% |
| Acadian | 26,220 | 3.64% |
| First Nations | 23,815 | 3.31% |
| Dutch (Netherlands) | 13,355 | 1.86% |
| Welsh | 7,620 | 1.06% |
| Italian | 5,610 | 0.78% |
| Métis | 4,955 | 0.69% |
| American (USA) | 3,925 | 0.55% |
| Danish | 3,390 | 0.47% |
The information at the left is from Statistics Canada [6]
Percentages add to more than 100% because of dual responses e.g. "Danish-Canadian" generates an entry in both the category "Danish" and the category "Canadian". Groups with more than 3,000 responses are included.
Visible minorities and Aboriginals
| Visible minority and Aboriginal population (Canada 2016 Census) | |||
|---|---|---|---|
| Population group | Population | % of total population | |
| European | 676,790 | 92.6% | |
| Visible minority group Source:[7] | South Asian | 2,535 | 0.3% |
| Chinese | 3,925 | 0.5% | |
| Black | 7,000 | 1% | |
| Filipino | 1,980 | 0.3% | |
| Latin American | 1,285 | 0.2% | |
| Arab | 2,960 | 0.4% | |
| Southeast Asian | 1,230 | 0.2% | |
| West Asian | 730 | 0.1% | |
| Korean | 1,685 | 0.2% | |
| Japanese | 230 | 0% | |
| Visible minority, n.i.e. | 305 | 0% | |
| Multiple visible minority | 675 | 0.1% | |
| Total visible minority population | 24,535 | 3.4% | |
| Aboriginal group Source:[8] | First Nations | 17,575 | 2.4% |
| Métis | 10,200 | 1.4% | |
| Inuit | 385 | 0.1% | |
| Aboriginal, n.i.e. | 750 | 0.1% | |
| Multiple Aboriginal identity | 470 | 0.1% | |
| Total Aboriginal population | 29,385 | 4% | |
| Total population | 730,710 | 100% | |
Languages
Compared to other provinces, New Brunswick has a relatively even split of French and English population. As a comparison, the minority language communities of Ontario and Quebec (Franco-Ontarians and English-speaking Quebecers respectively) make up less than 10% of those provinces' populations.[10] With both official language communities so strongly represented, New Brunswick is home to both French and English language hospitals and healthcare networks, school systems, universities, and media. The province also has a relatively high proportion of people who state that they can speak both official languages, with about 246,000 people, or 33.2% of the population reporting the ability to speak both English and French (though Francophones make up two-thirds of those who are bilingual).[11]
Language policy remains a perennial issue in New Brunswick society and politics. Recurring debates have arisen in regards to interpretation of the provincial bilingualism policy, duality (the system of parallel French and English speaking public services), and specifics of implementation. The extent of the provincial policy on bilingualism means that a new row is never far off in the New Brunswick news cycle.[12][13] The French-speaking community continues to advocate for full funding of French-language public services and fair representation in public sector employment, while some Anglophones (and Francophones) fear that the system of duality is financially inefficient and its extent is not worthwhile, or that the provincial governments targets for bilingualism in public employment are hurting their chances to work for the government, as Anglophones are less likely than Francophones to be proficient enough in both official languages to use them in employment.
The province's bilingual status is enshrined in both provincial and federal law. The Canadian Constitution makes specific mention of New Brunswick's bilingual status and defines the spirit of implementation as one based on both community and individual rights (in contrast with the constitutional protections for the other provinces that is limited to individuals, though this extends to "community" issues in terms of provision of schooling etc.). The Canadian Charter of Rights and Freedoms has a number of New Brunswick specific articles and makes specific mention of New Brunswick in each section relating to language (ex. Section 18 has two paragraphs, the first regarding bilingual publication of the Canadian Parliaments work and laws, the second specifying that New Brunswick's legislature will publish its work in both French and English). Of particular interest is Article 16.1, which declares that the French and English speaking communities of New Brunswick have equal rights and privileges, including community specific educational and cultural institutions. This specific distinction of linguistic community is important in that it recognizes not only the rights of individuals to use their language, but also demands that the two official language communities have their specific institutions upheld.
The 2011 Canadian census showed a population of 751,171. Of the 731,855 single responses to the census question concerning mother tongue, the most commonly reported languages were:[14]
New Brunswick's official languages are shown in bold. Figures shown are for the number of single-language responses and the percentage of total single-language responses. During the 19th century Scottish Gaelic was also spoken in the Campbellton and Dalhousie area. The language died out as a natively-spoken language in the province in the early 20th century.
In 2012, New Brunswick francophones scored lower on the Programme for the International Assessment of Adult Competencies than their anglophone counterparts in New Brunswick.[15]
The 2011 Canadian census showed a population of 751,171. Of the 731,855 singular responses to the question concerning mother tongue the most commonly reported languages were:
| Ranking | Language | Population | Percentage |
|---|---|---|---|
| 1. | English | 479,930 | 65.58% |
| 2. | French | 233,530 | 31.90% |
| 3. | Algonquian languages | 2,125 | 0.29% |
| Mi'kmaq | 2,115 | 0.29% | |
| Cree language | 10 | 0.001% | |
| 4. | Chinese | 1,825 | 0.25% |
| Mandarin | 405 | 0.06% | |
| Cantonese | 225 | 0.03% | |
| Taiwanese | 5 | 0.001% | |
| 5. | Korean | 1,810 | 0.25% |
| 6. | German | 1,805 | 0.25% |
| 7. | Arabic | 1,325 | 0.18% |
| 8. | Spanish | 1,135 | 0.16% |
| 9. | Dutch (Nederlands) | 925 | 0.13% |
| 10. | Tagalog | 585 | 0.08% |
| 11. | Hindustani | 455 | 0.06% |
| Hindi | 250 | 0.03% | |
| Urdu | 205 | 0.03% | |
| 12. | Persian | 450 | 0.06% |
| 13. | Italian | 440 | 0.06% |
| 14. | Romanian | 420 | 0.06% |
| 15. | Russian | 355 | 0.05% |
| 16. | Vietnamese | 285 | 0.04% |
| 17. | Serbo-Croatian languages | 280 | 0.04% |
| Serbian | 120 | 0.02% | |
| Croatian | 75 | 0.01% | |
| Bosnian | 40 | 0.01% | |
| 18. | Polish | 255 | 0.03% |
| 19. | Scandinavian languages | 235 | 0.03% |
| Danish | 145 | 0.01% | |
| Norwegian | 45 | 0.01% | |
| Swedish | 45 | 0.01% | |
| 20. | Portuguese | 220 | 0.03% |
| 21. | Bantu languages | 200 | 0.03% |
| Swahili | 140 | 0.02% | |
| 22. | Bengali | 180 | 0.02% |
| 23. | Hungarian (Magyar) | 155 | 0.02% |
| 24. | Greek | 140 | 0.02% |
Note: "n.i.e.": not included elsewhere
There were also 45 single-language responses for Gujarati; 135 for Niger-Congo languages n.i.e.; 70 for Creole; 95 for Non-verbal languages (Sign languages); 115 for Japanese; 30 for Indo-Iranian languages n.i.e.; 5 for Somali; 20 for Sinhala (Sinhalese); and 40 for Malayalam. New Brunswick's official languages are shown in bold. (Figures shown are for the number of single language responses and the percentage of total single-language responses.)[14]
Migration
Immigration
The 2006 Canadian census counted a total of 28,395 immigrants living in New Brunswick.
The most commonly reported origins for these immigrants were:
[16]
| 1. | United States | 8,660 |
| 2. | United Kingdom | 5,205 |
| 3. | Germany | 1,770 |
| 4. | Netherlands | 995 |
| 5. | China | 925 |
| 6. | India | 600 |
| 7. | Italy | 405 |
| 8. | South Korea | 370 |
| 9. | former Yugoslavia | 355 |
| 10. | Philippines | 350 |
| 11. | France | 320 |
| 12. | Iran | 265 |
| 13. | Lebanon | 220 |
| 14. | Pakistan | 205 |
There were also 195 immigrants from the Democratic Republic of Congo; 180 from Vietnam; 170 from Colombia; 165 each from Hungary and Romania; 155 each from Belgium and El Salvador; 140 each from Greece and Ireland (Éire); 125 from Poland; 120 each from Afghanistan and South Africa; 115 from Ukraine; 110 from Guyana; 105 each from Denmark and from Trinidad and Tobago; and 100 from Austria.
Internal migration
New Brunswick has typically experienced less emigration than its size and economic situation would suggest, probably because of the low rate of emigration of its francophone population.
| In-migrants | Out-migrants | Net migration | |
|---|---|---|---|
| 2008–09 | 11,268 | 11,505 | −237 |
| 2009–10 | 10,883 | 10,312 | 571 |
| 2010–11 | 10,167 | 10,325 | −158 |
| 2011–12 | 10,044 | 11,850 | −1,806 |
| 2012–13 | 8,517 | 11,807 | −3,290 |
| 2013–14 | 9,055 | 12,572 | −3,517 |
| 2014–15 | 9,184 | 11,974 | −2,790 |
| 2015–16 | 10,248 | 11,361 | −1,113 |
| 2016–17 | 10,136 | 9,702 | 434 |
| 2017–18 | 10,709 | 10,228 | 481 |
| 2018–19 | 11,945 | 11,339 | 606 |
Source: Statistics Canada
Religion
| 2001 | 20111 | |||||
|---|---|---|---|---|---|---|
| Number | % | Number | % | |||
| Total Population | 719,715 | 100 | 735,835 | 100 | ||
| Christian | 647,295 | 89.9 | 616,910 | 83.8 | ||
| - Total Catholic2 | 386,035 | 53.6 | 366,155 | 49.8 | ||
| - Total Protestant | 260,695 | 36.2 | 249,820 | 34.0 | ||
| - Baptist | 80,490 | 11.2 | 70,990 | 9.6 | ||
| - United Church of Canada | 69,235 | 9.6 | 54,270 | 7.4 | ||
| - Anglican Church of Canada | 58,210 | 8.1 | 51,365 | 7.0 | ||
| - Pentecostal | 20,150 | 2.8 | 18,435 | 2.5 | ||
| - Protestant, Other3 | 24,200 | 2.6 | 45,910 | 6.2 | ||
| - Presbyterian | 6,900 | 1.0 | 7,770 | 1.1 | ||
| - Lutheran | 1,510 | 0.2 | 1080 | 0.1 | ||
| - Christian Orthodox4 | 565 | 0.1 | 980 | 0.1 | ||
| No Religious Affiliation | 56,440 | 7.8 | 111,435 | 15.1 | ||
| Other | 5,295 | 0.7 | 7,495 | 1.0 | ||
| - Muslim | 1,275 | 0.2 | 2,640 | 0.4 | ||
| - Other Religions5 | 1,970 | 0.3 | 1,915 | 0.3 | ||
| - Jewish | 670 | 0.1 | 620 | 0.1 | ||
| - Buddhist | 545 | 0.1 | 975 | 0.1 | ||
| - Hindu | 475 | 0.1 | 820 | 0.1 | ||
| - Aboriginal Spirituality | 360 | 0.1 | 525 | 0.1 | ||
|
1 The 2011 data is from the National Household Survey[18] and so numbers are estimates. | ||||||
See also
References
- "French use declines at home and work as francophone numbers drop". CBC. 31 March 2019. Retrieved 15 February 2020.
- "A scenic tour of New Brunswick's East Coast". WestJet Magazine. 2013-08-21. Retrieved 2020-05-04.
- Belshaw, John Douglas (2015). "10.2 Demographics". Canadian History: Pre-Confederation. BCCampus.
- Population urban and rural, by province and territory (New Brunswick) Archived 2006-12-31 at the Wayback Machine. Statistics Canada, 2005.
- Canada's population Archived November 4, 2008, at the Wayback Machine. Statistics Canada. Last accessed September 28, 2006.
- Ethnic Origin (232), Sex (3) and Single and Multiple Responses (3) (2001 Census)
- Brunswick&SearchType=Begins&SearchPR=01&B1=All&Custom=, Community Profiles from the 2006 Census, Statistics Canada - Province/Territory
- Brunswick&SearchType=Begins&SearchPR=01&B1=All&Custom=, Aboriginal Population Profile from the 2006 Census, Statistics Canada - Province/Territory
- "Census Profile, 2016 Census - New Brunswick [Province] and Nova Scotia [Province] - Language". statcan.gc.ca. Statistics Canada. 9 August 2019. Retrieved 15 October 2019.
- Canada, Government of Canada, Statistics. "Population by mother tongue, by province and territory, excluding institutional residents (2011 Census) (New Brunswick, Quebec, Ontario)". www.statcan.gc.ca. Retrieved 2016-05-05.
- "2014–2015 Annual Report, Office of the Commissioner of Official Languages of New Brunswick" (PDF). p. 39.
- "New Brunswick still debating language issues after 50 years of bilingualism | Toronto Star". thestar.com. Retrieved 2016-05-05.
- "Liberals, PCs show fissures over bilingualism controversy". www.cbc.ca. Retrieved 2016-05-05.
- Detailed Mother Tongue (186), Knowledge of Official Languages (5), Age Groups (17A) and Sex (3) (2011 Census)
- "Study: The literacy skills of New Brunswick francophones". Statistics Canada. 2016-09-19. Retrieved 2016-09-21.
- Immigrant Status and Period of Immigration (8) and Place of Birth (261) (2006 Census)
- "96F0030XIE2001015 - Religions in Canada". 2.statcan.ca. Retrieved 2014-05-17.
- "NHSNewBrunswick2011". 2.statcan.ca. Retrieved 2014-05-17.
| Subdivisions | |
|---|---|
| Cities | |
| |
| Provinces | |
|---|---|
| Territories | |
| |
| Ethnic ancestry |
| ||||||||||||||||||||||||||||||||||||||||||||||||
|---|---|---|---|---|---|---|---|---|---|---|---|---|---|---|---|---|---|---|---|---|---|---|---|---|---|---|---|---|---|---|---|---|---|---|---|---|---|---|---|---|---|---|---|---|---|---|---|---|---|
| Demographics |
| ||||||||||||||||||||||||||||||||||||||||||||||||
| Culture and society | |||||||||||||||||||||||||||||||||||||||||||||||||
| List of Canadians |
| ||||||||||||||||||||||||||||||||||||||||||||||||
| |||||||||||||||||||||||||||||||||||||||||||||||||