Phytoplankton
Phytoplankton (/ˌfaɪtoʊˈplæŋktən/) are the autotrophic (self-feeding) components of the plankton community and a key part of ocean and freshwater ecosystems. The name comes from the Greek words φυτόν (phyton), meaning "plant", and πλαγκτός (planktos), meaning "wanderer" or "drifter".[1]
| Part of a series on |
| Plankton |
|---|
 |
Phytoplankton obtain their energy through photosynthesis, as do trees and other plants on land. This means phytoplankton must have light from the sun, so they live in the well-lit surface layers (euphotic zone) of oceans and lakes. In comparison with terrestrial plants, phytoplankton are distributed over a larger surface area, are exposed to less seasonal variation and have markedly faster turnover rates than trees (days versus decades). As a result, phytoplankton respond rapidly on a global scale to climate variations.
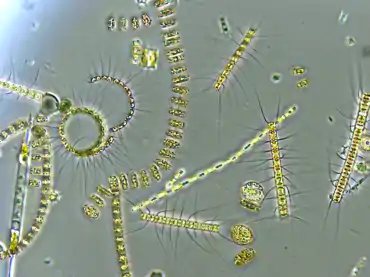
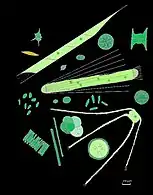
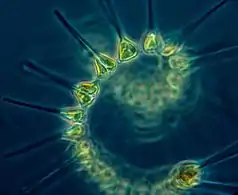
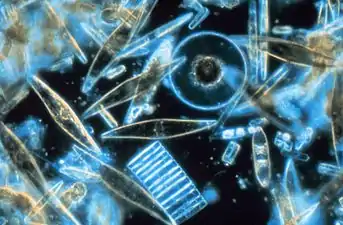
Phytoplankton form the base of marine and freshwater food webs and are key players in the global carbon cycle. They account for about half of global photosynthetic activity and about half of the oxygen production, despite amounting to only about 1% of the global plant biomass. Phytoplankton are very diverse, varying from photosynthesising bacteria to plant-like algae to armour-plated coccolithophores. Important groups of phytoplankton include the diatoms, cyanobacteria and dinoflagellates, although many other groups are represented.
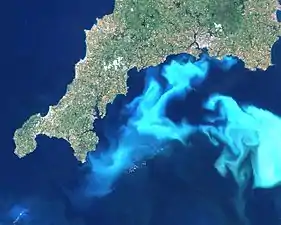
Most phytoplankton are too small to be individually seen with the unaided eye. However, when present in high enough numbers, some varieties may be noticeable as colored patches on the water surface due to the presence of chlorophyll within their cells and accessory pigments (such as phycobiliproteins or xanthophylls) in some species.
Types
Phytoplankton are photosynthesizing microscopic biotic organisms that inhabit the upper sunlit layer of almost all oceans and bodies of fresh water on Earth. They are agents for primary production, the creation of organic compounds from carbon dioxide dissolved in the water, a process that sustains the aquatic food web.[2] Phytoplankton form the base of the marine food web and are crucial players in the Earth's carbon cycle.[3]
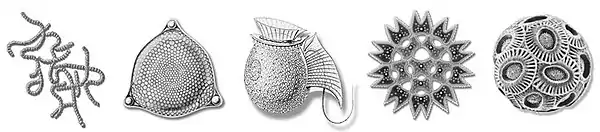
Phytoplankton are extremely diverse, varying from photosynthesising bacteria (cyanobacteria), to plant-like diatoms, to armour-plated coccolithophores.[4]
Ecology
Phytoplankton obtain energy through the process of photosynthesis and must therefore live in the well-lit surface layer (termed the euphotic zone) of an ocean, sea, lake, or other body of water. Phytoplankton account for about half of all photosynthetic activity on Earth.[6][7][8] Their cumulative energy fixation in carbon compounds (primary production) is the basis for the vast majority of oceanic and also many freshwater food webs (chemosynthesis is a notable exception).
While almost all phytoplankton species are obligate photoautotrophs, there are some that are mixotrophic and other, non-pigmented species that are actually heterotrophic (the latter are often viewed as zooplankton). Of these, the best known are dinoflagellate genera such as Noctiluca and Dinophysis, that obtain organic carbon by ingesting other organisms or detrital material.
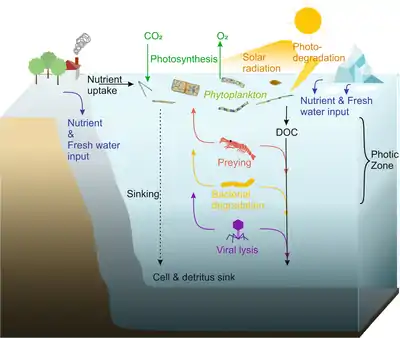
Phytoplankton live in the photic zone of the ocean, where photosynthesis is possible. During photosynthesis, they assimilate carbon dioxide and release oxygen. If solar radiation is too high, phytoplankton may fall victim to photodegradation. For growth, phytoplankton cells depend on nutrients, which enter the ocean by rivers, continental weathering, and glacial ice meltwater on the poles. Phytoplankton release dissolved organic carbon (DOC) into the ocean. Since phytoplankton are the basis of marine food webs, they serve as prey for zooplankton, fish larvae and other heterotrophic organisms. They can also be degraded by bacteria or by viral lysis. Although some phytoplankton cells, such as dinoflagellates, are able to migrate vertically, they are still incapable of actively moving against currents, so they slowly sink and ultimately fertilize the seafloor with dead cells and detritus.[9]
Phytoplankton are crucially dependent on minerals. These are primarily macronutrients such as nitrate, phosphate or silicic acid, whose availability is governed by the balance between the so-called biological pump and upwelling of deep, nutrient-rich waters. Phytoplankton nutrient composition drives and is driven by the Redfield ratio of macronutrients generally available throughout the surface oceans. However, across large areas of the oceans such as the Southern Ocean, phytoplankton are limited by the lack of the micronutrient iron. This has led to some scientists advocating iron fertilization as a means to counteract the accumulation of human-produced carbon dioxide (CO2) in the atmosphere.[10] Large-scale experiments have added iron (usually as salts such as iron sulphate) to the oceans to promote phytoplankton growth and draw atmospheric CO2 into the ocean. Controversy about manipulating the ecosystem and the efficiency of iron fertilization has slowed such experiments.[11]
Phytoplankton depend on B Vitamins for survival. Areas in the ocean have been identified as having a major lack of some B Vitamins, and correspondingly, phytoplankton.[12]
The effects of anthropogenic warming on the global population of phytoplankton is an area of active research. Changes in the vertical stratification of the water column, the rate of temperature-dependent biological reactions, and the atmospheric supply of nutrients are expected to have important effects on future phytoplankton productivity.[13][14]
The effects of anthropogenic ocean acidification on phytoplankton growth and community structure has also received considerable attention. Phytoplankton such as coccolithophores contain calcium carbonate cell walls that are sensitive to ocean acidification. Because of their short generation times, evidence suggests some phytoplankton can adapt to changes in pH induced by increased carbon dioxide on rapid time-scales (months to years).[15][16]
Phytoplankton serve as the base of the aquatic food web, providing an essential ecological function for all aquatic life. Under future conditions of anthropogenic warming and ocean acidification, changes in phytoplankton mortality due to changes in rates of zooplankton grazing may be significant.[17] One of the many food chains in the ocean – remarkable due to the small number of links – is that of phytoplankton sustaining krill (a crustacean similar to a tiny shrimp), which in turn sustain baleen whales.
Diversity
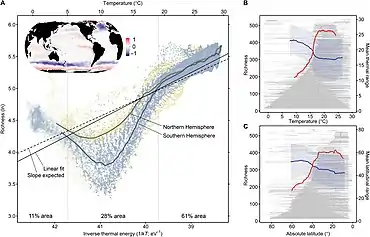
The term phytoplankton encompasses all photoautotrophic microorganisms in aquatic food webs. However, unlike terrestrial communities, where most autotrophs are plants, phytoplankton are a diverse group, incorporating protistan eukaryotes and both eubacterial and archaebacterial prokaryotes. There are about 5,000 known species of marine phytoplankton.[18] How such diversity evolved despite scarce resources (restricting niche differentiation) is unclear.[19]
In terms of numbers, the most important groups of phytoplankton include the diatoms, cyanobacteria and dinoflagellates, although many other groups of algae are represented. One group, the coccolithophorids, is responsible (in part) for the release of significant amounts of dimethyl sulfide (DMS) into the atmosphere. DMS is oxidized to form sulfate which, in areas where ambient aerosol particle concentrations are low, can contribute to the population of cloud condensation nuclei, mostly leading to increased cloud cover and cloud albedo according to the so-called CLAW Hypothesis.[20][21] Different types of phytoplankton support different trophic levels within varying ecosystems. In oligotrophic oceanic regions such as the Sargasso Sea or the South Pacific Gyre, phytoplankton is dominated by the small sized cells, called picoplankton and nanoplankton (also referred to as picoflagellates and nanoflagellates), mostly composed of cyanobacteria (Prochlorococcus, Synechococcus) and picoeucaryotes such as Micromonas. Within more productive ecosystems, dominated by upwelling or high terrestrial inputs, larger dinoflagellates are the more dominant phytoplankton and reflect a larger portion of the biomass.[22]
Growth strategies
In the early twentieth century, Alfred C. Redfield found the similarity of the phytoplankton's elemental composition to the major dissolved nutrients in the deep ocean.[23] Redfield proposed that the ratio of carbon to nitrogen to phosphorus (106:16:1) in the ocean was controlled by the phytoplankton's requirements, as phytoplankton subsequently release nitrogen and phosphorus as they are remineralized. This so-called “Redfield ratio” in describing stoichiometry of phytoplankton and seawater has become a fundamental principle to understand marine ecology, biogeochemistry and phytoplankton evolution.[24] However, the Redfield ratio is not a universal value and it may diverge due to the changes in exogenous nutrient delivery[25] and microbial metabolisms in the ocean, such as nitrogen fixation, denitrification and anammox.
The dynamic stoichiometry shown in unicellular algae reflects their capability to store nutrients in an internal pool, shift between enzymes with various nutrient requirements and alter osmolyte composition.[26][27] Different cellular components have their own unique stoichiometry characteristics,[24] for instance, resource (light or nutrients) acquisition machinery such as proteins and chlorophyll contain a high concentration of nitrogen but low in phosphorus. Meanwhile, growth machinery such as ribosomal RNA contains high nitrogen and phosphorus concentrations.
Based on allocation of resources, phytoplankton is classified into three different growth strategies, namely survivalist, bloomer[28] and generalist. Survivalist phytoplankton has a high ratio of N:P (>30) and contains an abundance of resource-acquisition machinery to sustain growth under scarce resources. Bloomer phytoplankton has a low N:P ratio (<10), contains a high proportion of growth machinery, and is adapted to exponential growth. Generalist phytoplankton has similar N:P to the Redfield ratio and contain relatively equal resource-acquisition and growth machinery.
Factors affecting abundance
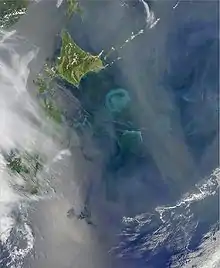
The NAAMES study was a five-year scientific research program conducted between 2015 and 2019 by scientists from Oregon State University and NASA to investigated aspects of phytoplankton dynamics in ocean ecosystems, and how such dynamics influence atmospheric aerosols, clouds, and climate (NAAMES stands for the North Atlantic Aerosols and Marine Ecosystems Study). The study focused on the sub-arctic region of the North Atlantic Ocean, which is the site of one of Earth's largest recurring phytoplankton blooms. The long history of research in this location, as well as relative ease of accessibility, made the North Atlantic an ideal location to test prevailing scientific hypotheses[29] in an effort to better understand the role of phytoplankton aerosol emissions on Earth's energy budget.[30]
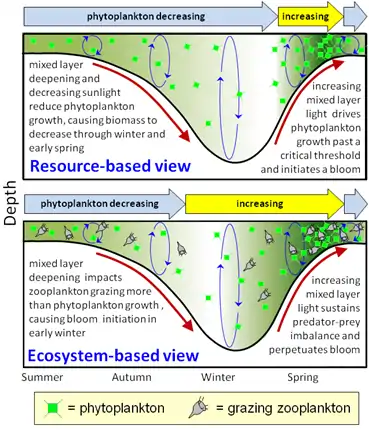
NAAMES was designed to target specific phases of the annual phytoplankton cycle: minimum, climax and the intermediary decreasing and increasing biomass, in order to resolve debates on the timing of bloom formations and the patterns driving annual bloom re-creation.[30] The NAAMES project also investigated the quantity, size, and composition of aerosols generated by primary production in order to understand how phytoplankton bloom cycles affect cloud formations and climate.[31]
Role of phytoplankton
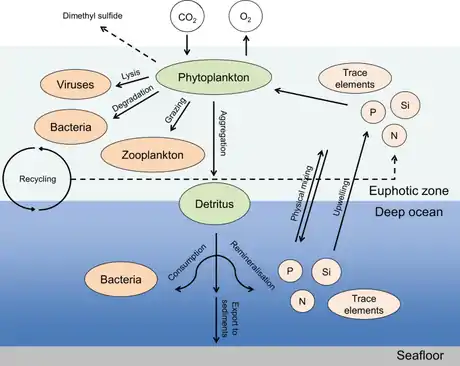
In the diagram on the right, the compartments influenced by phytoplankton include the atmospheric gas composition, inorganic nutrients, and trace element fluxes as well as the transfer and cycling of organic matter via biological processes. The photosynthetically fixed carbon is rapidly recycled and reused in the surface ocean, while a certain fraction of this biomass is exported as sinking particles to the deep ocean, where it is subject to ongoing transformation processes, e.g., remineralization.[35]
Aquaculture
Phytoplankton are a key food item in both aquaculture and mariculture. Both utilize phytoplankton as food for the animals being farmed. In mariculture, the phytoplankton is naturally occurring and is introduced into enclosures with the normal circulation of seawater. In aquaculture, phytoplankton must be obtained and introduced directly. The plankton can either be collected from a body of water or cultured, though the former method is seldom used. Phytoplankton is used as a foodstock for the production of rotifers,[36] which are in turn used to feed other organisms. Phytoplankton is also used to feed many varieties of aquacultured molluscs, including pearl oysters and giant clams. A 2018 study estimated the nutritional value of natural phytoplankton in terms of carbohydrate, protein and lipid across the world ocean using ocean-colour data from satellites,[37] and found the calorific value of phytoplankton to vary considerably across different oceanic regions and between different time of the year.[37][38]
The production of phytoplankton under artificial conditions is itself a form of aquaculture. Phytoplankton is cultured for a variety of purposes, including foodstock for other aquacultured organisms,[36] a nutritional supplement for captive invertebrates in aquaria. Culture sizes range from small-scale laboratory cultures of less than 1L to several tens of thousands of liters for commercial aquaculture.[36] Regardless of the size of the culture, certain conditions must be provided for efficient growth of plankton. The majority of cultured plankton is marine, and seawater of a specific gravity of 1.010 to 1.026 may be used as a culture medium. This water must be sterilized, usually by either high temperatures in an autoclave or by exposure to ultraviolet radiation, to prevent biological contamination of the culture. Various fertilizers are added to the culture medium to facilitate the growth of plankton. A culture must be aerated or agitated in some way to keep plankton suspended, as well as to provide dissolved carbon dioxide for photosynthesis. In addition to constant aeration, most cultures are manually mixed or stirred on a regular basis. Light must be provided for the growth of phytoplankton. The colour temperature of illumination should be approximately 6,500 K, but values from 4,000 K to upwards of 20,000 K have been used successfully. The duration of light exposure should be approximately 16 hours daily; this is the most efficient artificial day length.[36]
Anthropogenic changes
Marine phytoplankton perform half of the global photosynthetic CO2 fixation (net global primary production of ~50 Pg C per year) and half of the oxygen production despite amounting to only ~1% of global plant biomass.[39] In comparison with terrestrial plants, marine phytoplankton are distributed over a larger surface area, are exposed to less seasonal variation and have markedly faster turnover rates than trees (days versus decades).[39] Therefore, phytoplankton respond rapidly on a global scale to climate variations. These characteristics are important when one is evaluating the contributions of phytoplankton to carbon fixation and forecasting how this production may change in response to perturbations. Predicting the effects of climate change on primary productivity is complicated by phytoplankton bloom cycles that are affected by both bottom-up control (for example, availability of essential nutrients and vertical mixing) and top-down control (for example, grazing and viruses).[40][39][41][42][43][44] Increases in solar radiation, temperature and freshwater inputs to surface waters strengthen ocean stratification and consequently reduce transport of nutrients from deep water to surface waters, which reduces primary productivity.[39][44][45] Conversely, rising CO2 levels can increase phytoplankton primary production, but only when nutrients are not limiting.[46][47][48][17]
Some studies indicate that overall global oceanic phytoplankton density has decreased in the past century,[49] but these conclusions have been questioned because of the limited availability of long-term phytoplankton data, methodological differences in data generation and the large annual and decadal variability in phytoplankton production.[50][51][52][53] Moreover, other studies suggest a global increase in oceanic phytoplankton production[54] and changes in specific regions or specific phytoplankton groups.[55][56] The global Sea Ice Index is declining,[57] leading to higher light penetration and potentially more primary production;[58] however, there are conflicting predictions for the effects of variable mixing patterns and changes in nutrient supply and for productivity trends in polar zones.[44][17]
See also
| Wikimedia Commons has media related to Phytoplankton. |
| Wikimedia Commons has media related to Algal blooms. |
- Algae – Diverse group of photosynthetic eukaryotic organisms
- Algaculture – Aquaculture involving the farming of algae
- AlgaeBase
- Bacterioplankton – bacterial component of the plankton that drifts in the water column
- Biological pump – The ocean's biologically driven sequestration of carbon from the atmosphere to the ocean interior and seafloor
- CLAW hypothesis – A hypothesised negative feedback loop connecting the marine biota and the climate
- Cyanobacteria – Phylum of photosynthesising prokaryotes
- Freshwater phytoplankton
- Iron fertilization
- Microphyte (microalgae)
- NAAMES
- Ocean acidification – Ongoing decrease in the pH of the Earth's oceans, caused by the uptake of carbon dioxide
- Paradox of the plankton – The ecological observation of high plankton diversity despite competition for few resources
- Photosynthetic picoplankton
- Plankton – Organisms that are in the water column and are incapable of swimming against a current
- Whiting event – Suspension of fine-grained calcium carbonate particles in water bodies
- Zooplankton – Heterotrophic protistan or metazoan members of the plankton ecosystem
- Thin layers (oceanography)
- Harmful algal bloom – Population explosion of organisms (usually algae) that can severely lower oxygen levels in natural waters, killing marine life
References
- Thurman, H. V. (2007). Introductory Oceanography. Academic Internet Publishers. ISBN 978-1-4288-3314-2.
- Ghosal; Rogers; Wray, S.; M.; A. "The Effects of Turbulence on Phytoplankton". Aerospace Technology Enterprise. NTRS. Retrieved 16 June 2011.CS1 maint: multiple names: authors list (link)
- Modeled Phytoplankton Communities in the Global Ocean NASA Hyperwall, 30 September 2015.
 This article incorporates text from this source, which is in the public domain.
 - Lindsey, R., Scott, M. and Simmon, R. (2010) "What are phytoplankton". NASA Earth Observatory.
- Darwin Project Massachusetts Institute of Technology.
- Michael J. Behrenfeld; et al. (30 March 2001). "Biospheric primary production during an ENSO transition" (PDF). Science. 291 (5513): 2594–7. Bibcode:2001Sci...291.2594B. doi:10.1126/science.1055071. PMID 11283369. S2CID 38043167.
- "NASA Satellite Detects Red Glow to Map Global Ocean Plant Health" NASA, 28 May 2009.
- "Satellite Sees Ocean Plants Increase, Coasts Greening". NASA. 2 March 2005. Retrieved 9 June 2014.
- Käse L, Geuer JK. (2018) "Phytoplankton responses to marine climate change–an introduction". In Jungblut S., Liebich V., Bode M. (Eds) YOUMARES 8–Oceans Across Boundaries: Learning from each other, pages 55–72, Springer. doi:10.1007/978-3-319-93284-2_5.
 Material was copied from this source, which is available under a Creative Commons Attribution 4.0 International License.
 - Richtel, M. (1 May 2007). "Recruiting Plankton to Fight Global Warming". New York Times.
- Monastersky, Richard (1995). "Iron versus the Greenhouse: Oceanographers Cautiously Explore a Global Warming Therapy". Science News. 148 (14): 220–1. doi:10.2307/4018225. JSTOR 4018225.
- Sañudo-Wilhelmy, Sergio (23 June 2012). "Existence of vitamin 'deserts' in the ocean confirmed". ScienceDaily.
- Henson, S. A.; Sarmiento, J. L.; Dunne, J. P.; Bopp, L.; Lima, I.; Doney, S. C.; John, J.; Beaulieu, C. (2010). "Detection of anthropogenic climate change in satellite records of ocean chlorophyll and productivity". Biogeosciences. 7 (2): 621–40. Bibcode:2010BGeo....7..621H. doi:10.5194/bg-7-621-2010.
- Steinacher, M.; Joos, F.; Frölicher, T. L.; Bopp, L.; Cadule, P.; Cocco, V.; Doney, S. C.; Gehlen, M.; Lindsay, K.; Moore, J. K.; Schneider, B.; Segschneider, J. (2010). "Projected 21st century decrease in marine productivity: a multi-model analysis". Biogeosciences. 7 (3): 979–1005. Bibcode:2010BGeo....7..979S. doi:10.5194/bg-7-979-2010.
- Collins, Sinéad; Rost, Björn; Rynearson, Tatiana A. (25 November 2013). "Evolutionary potential of marine phytoplankton under ocean acidification". Evolutionary Applications. 7 (1): 140–155. doi:10.1111/eva.12120. ISSN 1752-4571. PMC 3894903. PMID 24454553.
- Lohbeck, Kai T.; Riebesell, Ulf; Reusch, Thorsten B. H. (8 April 2012). "Adaptive evolution of a key phytoplankton species to ocean acidification". Nature Geoscience. 5 (5): 346–351. Bibcode:2012NatGe...5..346L. doi:10.1038/ngeo1441. ISSN 1752-0894.
- Cavicchioli, Ricardo; Ripple, William J.; Timmis, Kenneth N.; Azam, Farooq; Bakken, Lars R.; Baylis, Matthew; Behrenfeld, Michael J.; Boetius, Antje; Boyd, Philip W.; Classen, Aimée T.; Crowther, Thomas W.; Danovaro, Roberto; Foreman, Christine M.; Huisman, Jef; Hutchins, David A.; Jansson, Janet K.; Karl, David M.; Koskella, Britt; Mark Welch, David B.; Martiny, Jennifer B. H.; Moran, Mary Ann; Orphan, Victoria J.; Reay, David S.; Remais, Justin V.; Rich, Virginia I.; Singh, Brajesh K.; Stein, Lisa Y.; Stewart, Frank J.; Sullivan, Matthew B.; et al. (2019). "Scientists' warning to humanity: Microorganisms and climate change". Nature Reviews Microbiology. 17 (9): 569–586. doi:10.1038/s41579-019-0222-5. PMC 7136171. PMID 31213707. Material was copied from this source, which is available under a Creative Commons Attribution 4.0 International License.
- Hallegraeff, G.M. (2003). "Harmful algal blooms: a global overview" (PDF). In Hallegraeff, Gustaaf M.; Anderson, Donald Mark; Cembella, Allan D.; Enevoldsen, Henrik O. (eds.). Manual on Harmful Marine Microalgae. Unesco. pp. 25–49. ISBN 978-92-3-103871-6.
- Hutchinson, G. E. (1961). "The Paradox of the Plankton". The American Naturalist. 95 (882): 137–45. doi:10.1086/282171. S2CID 86353285.
- Charlson, Robert J.; Lovelock, James E.; Andreae, Meinrat O.; Warren, Stephen G. (1987). "Oceanic phytoplankton, atmospheric sulphur, cloud albedo and climate". Nature. 326 (6114): 655–61. Bibcode:1987Natur.326..655C. doi:10.1038/326655a0. S2CID 4321239.
- Quinn, P. K.; Bates, T. S. (2011). "The case against climate regulation via oceanic phytoplankton sulphur emissions". Nature. 480 (7375): 51–6. Bibcode:2011Natur.480...51Q. doi:10.1038/nature10580. PMID 22129724. S2CID 4417436.
- Calbet, A. (2008). "The trophic roles of microzooplankton in marine systems". ICES Journal of Marine Science. 65 (3): 325–31. doi:10.1093/icesjms/fsn013.
- Redfield, Alfred C. (1934). "On the Proportions of Organic Derivatives in Sea Water and their Relation to the Composition of Plankton". In Johnstone, James; Daniel, Richard Jellicoe (eds.). James Johnstone Memorial Volume. Liverpool: University Press of Liverpool. pp. 176–92. OCLC 13993674.
- Arrigo, Kevin R. (2005). "Marine microorganisms and global nutrient cycles". Nature. 437 (7057): 349–55. Bibcode:2005Natur.437..349A. doi:10.1038/nature04159. PMID 16163345. S2CID 62781480.
- Fanning, Kent A. (1989). "Influence of atmospheric pollution on nutrient limitation in the ocean". Nature. 339 (6224): 460–63. Bibcode:1989Natur.339..460F. doi:10.1038/339460a0. S2CID 4247689.
- Sterner, Robert Warner; Elser, James J. (2002). Ecological Stoichiometry: The Biology of Elements from Molecules to the Biosphere. Princeton University Press. ISBN 978-0-691-07491-7.
- Klausmeier, Christopher A.; Litchman, Elena; Levin, Simon A. (2004). "Phytoplankton growth and stoichiometry under multiple nutrient limitation". Limnology and Oceanography. 49 (4 Part 2): 1463–70. Bibcode:2004LimOc..49.1463K. doi:10.4319/lo.2004.49.4_part_2.1463. S2CID 16438669.
- Klausmeier, Christopher A.; Litchman, Elena; Daufresne, Tanguy; Levin, Simon A. (2004). "Optimal nitrogen-to-phosphorus stoichiometry of phytoplankton". Nature. 429 (6988): 171–4. Bibcode:2004Natur.429..171K. doi:10.1038/nature02454. PMID 15141209. S2CID 4308845.
- Behrenfeld, M.J. and Boss, E.S. (2018) "Student's tutorial on bloom hypotheses in the context of phytoplankton annual cycles". Global change biology, 24(1): 55–77. doi:10.1111/gcb.13858.
- Behrenfeld, Michael J.; Moore, Richard H.; Hostetler, Chris A.; Graff, Jason; Gaube, Peter; Russell, Lynn M.; Chen, Gao; Doney, Scott C.; Giovannoni, Stephen; Liu, Hongyu; Proctor, Christopher (22 March 2019). "The North Atlantic Aerosol and Marine Ecosystem Study (NAAMES): Science Motive and Mission Overview". Frontiers in Marine Science. 6: 122. doi:10.3389/fmars.2019.00122. ISSN 2296-7745.
- Engel, Anja; Bange, Hermann W.; Cunliffe, Michael; Burrows, Susannah M.; Friedrichs, Gernot; Galgani, Luisa; Herrmann, Hartmut; Hertkorn, Norbert; Johnson, Martin; Liss, Peter S.; Quinn, Patricia K. (30 May 2017). "The Ocean's Vital Skin: Toward an Integrated Understanding of the Sea Surface Microlayer". Frontiers in Marine Science. 4. doi:10.3389/fmars.2017.00165. ISSN 2296-7745.
- Behrenfeld, Michael J.; Boss, Emmanuel S. (3 January 2014). "Resurrecting the Ecological Underpinnings of Ocean Plankton Blooms". Annual Review of Marine Science. 6 (1): 167–194. Bibcode:2014ARMS....6..167B. doi:10.1146/annurev-marine-052913-021325. ISSN 1941-1405. PMID 24079309. S2CID 12903662.
- NAAMES: Science - Objectives Langley Research Center, NASA, Updated: 6 June 2020. Retrieved: 15 June 2020.
- Righetti, D., Vogt, M., Gruber, N., Psomas, A. and Zimmermann, N.E. (2019) "Global pattern of phytoplankton diversity driven by temperature and environmental variability". Science advances, 5(5): eaau6253. doi:10.1126/sciadv.aau6253. Material was copied from this source, which is available under a Creative Commons Attribution 4.0 International License.
- Heinrichs, Mara E.; Mori, Corinna; Dlugosch, Leon (2020). "Complex Interactions Between Aquatic Organisms and Their Chemical Environment Elucidated from Different Perspectives". YOUMARES 9 - the Oceans: Our Research, Our Future. pp. 279–297. doi:10.1007/978-3-030-20389-4_15. ISBN 978-3-030-20388-7. Material was copied from this source, which is available under a Creative Commons Attribution 4.0 International License.
- McVey, James P., Nai-Hsien Chao, and Cheng-Sheng Lee. CRC Handbook of Mariculture Vol. 1 : Crustacean Aquaculture. New York: C R C P LLC, 1993.
- Roy, Shovonlal (12 February 2018). "Distributions of phytoplankton carbohydrate, protein and lipid in the world oceans from satellite ocean colour". The ISME Journal. 12 (6): 1457–1472. doi:10.1038/s41396-018-0054-8. ISSN 1751-7370. PMC 5955997. PMID 29434313.
- "Nutrition study reveals instability in world's most important fishing regions".
- Behrenfeld, Michael J. (2014). "Climate-mediated dance of the plankton". Nature Climate Change. 4 (10): 880–887. Bibcode:2014NatCC...4..880B. doi:10.1038/nclimate2349.
- Hutchins, D. A.; Boyd, P. W. (2016). "Marine phytoplankton and the changing ocean iron cycle". Nature Climate Change. 6 (12): 1072–1079. Bibcode:2016NatCC...6.1072H. doi:10.1038/nclimate3147.
- De Baar, Hein J. W.; De Jong, Jeroen T. M.; Bakker, Dorothée C. E.; Löscher, Bettina M.; Veth, Cornelis; Bathmann, Uli; Smetacek, Victor (1995). "Importance of iron for plankton blooms and carbon dioxide drawdown in the Southern Ocean". Nature. 373 (6513): 412–415. Bibcode:1995Natur.373..412D. doi:10.1038/373412a0. S2CID 4257465.
- Boyd, P. W.; Jickells, T.; Law, C. S.; Blain, S.; Boyle, E. A.; Buesseler, K. O.; Coale, K. H.; Cullen, J. J.; De Baar, H. J. W.; Follows, M.; Harvey, M.; Lancelot, C.; Levasseur, M.; Owens, N. P. J.; Pollard, R.; Rivkin, R. B.; Sarmiento, J.; Schoemann, V.; Smetacek, V.; Takeda, S.; Tsuda, A.; Turner, S.; Watson, A. J. (2007). "Mesoscale Iron Enrichment Experiments 1993-2005: Synthesis and Future Directions" (PDF). Science. 315 (5812): 612–617. Bibcode:2007Sci...315..612B. doi:10.1126/science.1131669. PMID 17272712. S2CID 2476669.
- Behrenfeld, Michael J.; o'Malley, Robert T.; Boss, Emmanuel S.; Westberry, Toby K.; Graff, Jason R.; Halsey, Kimberly H.; Milligan, Allen J.; Siegel, David A.; Brown, Matthew B. (2016). "Revaluating ocean warming impacts on global phytoplankton". Nature Climate Change. 6 (3): 323–330. Bibcode:2016NatCC...6..323B. doi:10.1038/nclimate2838.
- Behrenfeld, Michael J.; Hu, Yongxiang; o'Malley, Robert T.; Boss, Emmanuel S.; Hostetler, Chris A.; Siegel, David A.; Sarmiento, Jorge L.; Schulien, Jennifer; Hair, Johnathan W.; Lu, Xiaomei; Rodier, Sharon; Scarino, Amy Jo (2017). "Annual boom–bust cycles of polar phytoplankton biomass revealed by space-based lidar". Nature Geoscience. 10 (2): 118–122. Bibcode:2017NatGe..10..118B. doi:10.1038/ngeo2861.
- Behrenfeld, Michael J.; o'Malley, Robert T.; Siegel, David A.; McClain, Charles R.; Sarmiento, Jorge L.; Feldman, Gene C.; Milligan, Allen J.; Falkowski, Paul G.; Letelier, Ricardo M.; Boss, Emmanuel S. (2006). "Climate-driven trends in contemporary ocean productivity". Nature. 444 (7120): 752–755. Bibcode:2006Natur.444..752B. doi:10.1038/nature05317. PMID 17151666. S2CID 4414391.
- Levitan, O.; Rosenberg, G.; Setlik, I.; Setlikova, E.; Grigel, J.; Klepetar, J.; Prasil, O.; Berman-Frank, I. (2007). "Elevated CO2 enhances nitrogen fixation and growth in the marine cyanobacterium Trichodesmium". Global Change Biology. 13 (2): 531–538. Bibcode:2007GCBio..13..531L. doi:10.1111/j.1365-2486.2006.01314.x.
- Verspagen, Jolanda M. H.; Van De Waal, Dedmer B.; Finke, Jan F.; Visser, Petra M.; Huisman, Jef (2014). "Contrasting effects of rising CO2 on primary production and ecological stoichiometry at different nutrient levels" (PDF). Ecology Letters. 17 (8): 951–960. doi:10.1111/ele.12298. PMID 24813339.
- Holding, J. M.; Duarte, C. M.; Sanz-Martín, M.; Mesa, E.; Arrieta, J. M.; Chierici, M.; Hendriks, I. E.; García-Corral, L. S.; Regaudie-De-Gioux, A.; Delgado, A.; Reigstad, M.; Wassmann, P.; Agustí, S. (2015). "Temperature dependence of CO2-enhanced primary production in the European Arctic Ocean". Nature Climate Change. 5 (12): 1079–1082. Bibcode:2015NatCC...5.1079H. doi:10.1038/nclimate2768. hdl:10754/596052.
- Boyce, Daniel G.; Lewis, Marlon R.; Worm, Boris (2010). "Global phytoplankton decline over the past century". Nature. 466 (7306): 591–596. Bibcode:2010Natur.466..591B. doi:10.1038/nature09268. PMID 20671703. S2CID 2413382.
- MacKas, David L. (2011). "Does blending of chlorophyll data bias temporal trend?". Nature. 472 (7342): E4–E5. Bibcode:2011Natur.472E...4M. doi:10.1038/nature09951. PMID 21490623. S2CID 4308744.
- Rykaczewski, Ryan R.; Dunne, John P. (2011). "A measured look at ocean chlorophyll trends". Nature. 472 (7342): E5–E6. Bibcode:2011Natur.472E...5R. doi:10.1038/nature09952. PMID 21490624. S2CID 205224535.
- McQuatters-Gollop, Abigail; Reid, Philip C.; Edwards, Martin; Burkill, Peter H.; Castellani, Claudia; Batten, Sonia; Gieskes, Winfried; Beare, Doug; Bidigare, Robert R.; Head, Erica; Johnson, Rod; Kahru, Mati; Koslow, J. Anthony; Pena, Angelica (2011). "Is there a decline in marine phytoplankton?". Nature. 472 (7342): E6–E7. Bibcode:2011Natur.472E...6M. doi:10.1038/nature09950. PMID 21490625. S2CID 205224519.
- Boyce, Daniel G.; Lewis, Marlon R.; Worm, Boris (2011). "Boyce et al. Reply". Nature. 472 (7342): E8–E9. Bibcode:2011Natur.472E...8B. doi:10.1038/nature09953. S2CID 4317554.
- Antoine, David (2005). "Bridging ocean color observations of the 1980s and 2000s in search of long-term trends". Journal of Geophysical Research. 110 (C6): C06009. Bibcode:2005JGRC..110.6009A. doi:10.1029/2004JC002620.
- Wernand, Marcel R.; Van Der Woerd, Hendrik J.; Gieskes, Winfried W. C. (2013). "Trends in Ocean Colour and Chlorophyll Concentration from 1889 to 2000, Worldwide". PLOS ONE. 8 (6): e63766. Bibcode:2013PLoSO...863766W. doi:10.1371/journal.pone.0063766. PMC 3680421. PMID 23776435.
- Rousseaux, Cecile S.; Gregg, Watson W. (2015). "Recent decadal trends in global phytoplankton composition". Global Biogeochemical Cycles. 29 (10): 1674–1688. Bibcode:2015GBioC..29.1674R. doi:10.1002/2015GB005139.
- Sea Ice Index National Snow and Ice Data Center. Accessed 30 October 2020.
- Kirchman, David L.; Morán, Xosé Anxelu G.; Ducklow, Hugh (2009). "Microbial growth in the polar oceans — role of temperature and potential impact of climate change". Nature Reviews Microbiology. 7 (6): 451–459. doi:10.1038/nrmicro2115. PMID 19421189. S2CID 31230080.
Further reading
- Greeson, Phillip E. (1982). An annotated key to the identification of commonly occurring and dominant genera of Algae observed in the Phytoplankton of the United States. Washington, D.C.: United States Government Printing Office. ISBN 978-0-607-68844-3.
- Kirby, Richard R. (2010). Ocean Drifters: A Secret World Beneath the Waves. Studio Cactus. ISBN 978-1-904239-10-9.
- Martin, Ronald; Quigg, Antonietta (2013). "Tiny Plants That Once Ruled the Seas". Scientific American. 308 (6): 40–5. Bibcode:2013SciAm.308f..40M. doi:10.1038/scientificamerican0613-40. PMID 23729069.
External links
- Secchi Disk and Secchi app, a citizen science project to study the phytoplankton
- Ocean Drifters, a short film narrated by David Attenborough about the varied roles of plankton
- Plankton Chronicles, a short documentary films & photos
- DMS and Climate, NOAA
- Plankton*Net, images of planktonic species
Aquatic ecosystems | |||||||||||||||||
|---|---|---|---|---|---|---|---|---|---|---|---|---|---|---|---|---|---|
| |||||||||||||||||
| |||||||||||||||||
| Authority control |
|---|