Shiawassee County, Michigan
Shiawassee /ˌʃaɪ.əˈwɒsiː/ is a county located in the U.S. state of Michigan. As of the 2010 United States Census, the population was 70,648.[2] The county seat is Corunna,[3] and the largest city in the county is Owosso. In 2010, the center of population of Michigan was located in Shiawassee County, in Bennington Township.[4]
Shiawassee County | |
|---|---|
 | |
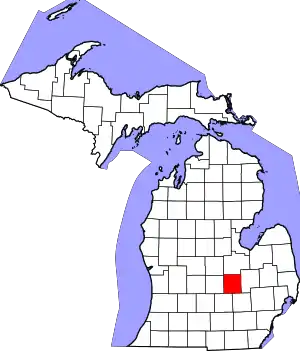 Location within the U.S. state of Michigan | |
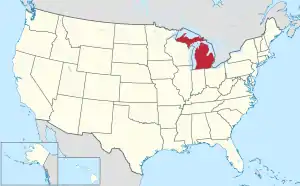 Michigan's location within the U.S. | |
| Coordinates: 42°57′N 84°08′W | |
| Country | |
| State | |
| Founded | September 10, 1822 (created) 1837 (organized)[1] |
| Named for | Shiawassee River |
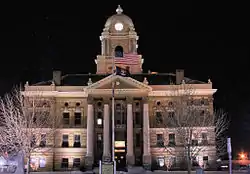
| Seat | Corunna |
| Largest city | Owosso |
| Area | |
| • Total | 541 sq mi (1,400 km2) |
| • Land | 531 sq mi (1,380 km2) |
| • Water | 10 sq mi (30 km2) 1.9%% |
| Population | |
| • Estimate (2018) | 68,192 |
| • Density | 130/sq mi (51/km2) |
| Time zone | UTC−5 (Eastern) |
| • Summer (DST) | UTC−4 (EDT) |
| Congressional district | 4th |
History
In 1822, the Michigan Territorial legislature defined a new county, Shiawassee (named for the river), taken from portions of existing Oakland and St. Clair counties. However, for purposes of representation, revenue, and judicial matters, the area was temporarily assigned to adjoining county governments.[1] In early 1837, the Michigan Territory was admitted into the Union as the State of Michigan, and that same year the new Michigan State government authorized the organization of a county government in Shiawassee.[1]
Geography
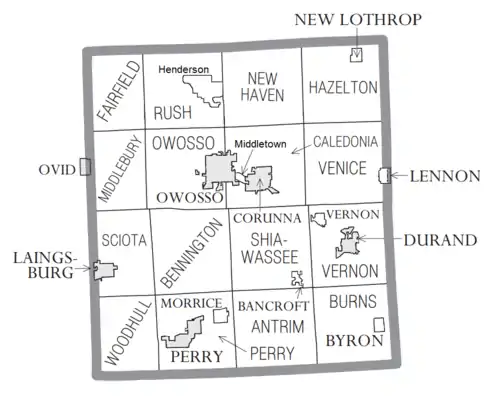
According to the US Census Bureau, the county has a total area of 541 square miles (1,400 km2), of which 531 square miles (1,380 km2) is land and 10 square miles (26 km2) (1.9%) is water.[5] The Shiawassee River enters it from Genesee County in the southeast and flows through Corunna and Owosso in the center of the county, exiting to Saginaw County in the north. Shiawassee County is considered to be a part of Central Michigan.
Adjacent counties
- Saginaw County – north
- Genesee County – east
- Livingston County – southeast
- Ingham County – southwest
- Clinton County – west
- Gratiot County – northwest
Transportation
Highways
 I-69 - enters near SW corner of county. Runs ENE past Shaftsburg, Perry, Morrice, Bancroft, Durand. Exits running east into Genesee County.
 M-13 - runs along the east line of county, from NE corner to intersection with I69 one mile (1.6 km) south of Lennon.
 M-21 - runs east-west through upper middle of county, passing Corunna and Owosso.
 M-52 - enters north line of county at Oakley. Runs south to Owosso, then SW and south to Perry. Exits running south into Ingham County.
 M-71 - begins at Owosso. Runs ESE to intersection with I69, one mile (1.6 km) NW of Durand.
Rail
- Durand Union Station in Durand offers access to Amtrak's Blue Water route. The train runs from Port Huron to Chicago.
Airport
Owosso Community Airport – 2 miles (3.2 km) east of Owosso. Public airport for general aviation, primarily smaller aircraft.
Demographics
| Historical population | |||
|---|---|---|---|
| Census | Pop. | %± | |
| 1840 | 2,103 | — | |
| 1850 | 5,230 | 148.7% | |
| 1860 | 12,349 | 136.1% | |
| 1870 | 20,858 | 68.9% | |
| 1880 | 27,059 | 29.7% | |
| 1890 | 30,952 | 14.4% | |
| 1900 | 33,866 | 9.4% | |
| 1910 | 33,246 | −1.8% | |
| 1920 | 35,924 | 8.1% | |
| 1930 | 39,517 | 10.0% | |
| 1940 | 41,207 | 4.3% | |
| 1950 | 45,967 | 11.6% | |
| 1960 | 53,446 | 16.3% | |
| 1970 | 63,075 | 18.0% | |
| 1980 | 71,140 | 12.8% | |
| 1990 | 69,770 | −1.9% | |
| 2000 | 71,687 | 2.7% | |
| 2010 | 70,648 | −1.4% | |
| 2019 (est.) | 68,122 | [6] | −3.6% |
| US Decennial Census[7] 1790-1960[8] 1900-1990[9] 1990-2000[10] 2010-2018[2] | |||
As of the 2010 United States Census,[11] Shiawassee County had a 2010 population of 70,648. This decrease of -1,039 people from the 2000 United States Census represents a decrease of 1.4% during that ten-year period. In 2010 there were 27,481 households and 19,397 families in the county. The population density was 133.1 per square mile (51.4 square kilometers). There were 30,319 housing units at an average density of 57.1 per square mile (22.0 per km2). 96.7% of the population were White, 0.5% Native American, 0.5% Black or African American, 0.4% Asian, 0.5% of some other race and 1.5% of two or more races. 2.4% were Hispanic or Latino (of any race). 22.2% were of German, 21.8% English, 9.5% Irish, 5.2% French, French Canadian or Cajun and 5.1% Polish ancestry according to 2010 American Community Survey.[12]
There were 27,481 households, out of which 32.5% had children under the age of 18 living with them, 53.8% were husband and wife families, 11.6% had a female householder with no husband present, 29.4% were non-families, and 24.2% were made up of individuals. The average household size was 2.54 and the average family size was 2.99.
The county population contained 24.1% under age of 18, 8.5% from 18 to 24, 23.9% from 25 to 44, 29.1% from 45 to 64, and 14.3% who were 65 years of age or older. The median age was 40 years. For every 100 females there were 97.7 males. For every 100 females age 18 and over, there were 94.6 males.
The 2010 American Community Survey 1-year estimate[11] indicates the median income for a household in the county was $46,528 and the median income for a family was $52,614. Males had a median income of $32,155 versus $19,301 for females. The per capita income for the county was $21,103. About 10.6% of families and 15.4% of the population were below the poverty line, including 22.1% of those under the age 18 and 5.8% of those age 65 or over.
Government
Shiawassee County has tended to vote Republican since the beginning. Since 1884, the Republican Party nominee has carried 74% of the elections (25 of 34).
| Year | Republican | Democratic | Third Parties |
|---|---|---|---|
| 2020 | 58.9% 23,149 | 39.1% 15,347 | 2.0% 805 |
| 2016 | 56.4% 19,230 | 36.8% 12,546 | 6.9% 2,335 |
| 2012 | 47.4% 15,962 | 51.1% 17,197 | 1.5% 520 |
| 2008 | 44.7% 16,268 | 53.3% 19,397 | 2.1% 750 |
| 2004 | 53.0% 19,407 | 46.1% 16,881 | 1.0% 363 |
| 2000 | 49.1% 15,816 | 48.2% 15,520 | 2.7% 882 |
| 1996 | 38.6% 11,714 | 48.3% 14,662 | 13.2% 3,999 |
| 1992 | 33.8% 10,930 | 39.0% 12,629 | 27.2% 8,801 |
| 1988 | 53.9% 15,506 | 45.4% 13,056 | 0.7% 186 |
| 1984 | 66.0% 18,756 | 33.5% 9,514 | 0.6% 161 |
| 1980 | 51.7% 15,756 | 39.3% 11,985 | 9.0% 2,729 |
| 1976 | 54.5% 15,113 | 44.0% 12,202 | 1.5% 406 |
| 1972 | 61.6% 15,489 | 35.5% 8,932 | 2.8% 715 |
| 1968 | 50.9% 11,465 | 38.3% 8,619 | 10.9% 2,448 |
| 1964 | 36.2% 7,786 | 63.6% 13,676 | 0.2% 41 |
| 1960 | 60.9% 13,757 | 38.8% 8,773 | 0.3% 74 |
| 1956 | 67.8% 14,600 | 31.9% 6,873 | 0.4% 78 |
| 1952 | 68.4% 13,562 | 30.6% 6,056 | 1.0% 206 |
| 1948 | 67.0% 10,377 | 31.3% 4,852 | 1.7% 267 |
| 1944 | 68.4% 11,601 | 31.2% 5,292 | 0.4% 64 |
| 1940 | 63.2% 9,995 | 36.2% 5,727 | 0.5% 82 |
| 1936 | 43.4% 6,017 | 48.0% 6,666 | 8.6% 1,195 |
| 1932 | 44.2% 6,600 | 53.6% 8,002 | 2.2% 334 |
| 1928 | 79.4% 9,851 | 20.1% 2,496 | 0.5% 60 |
| 1924 | 73.0% 8,987 | 14.1% 1,738 | 12.9% 1,588 |
| 1920 | 69.9% 7,194 | 25.2% 2,595 | 4.8% 498 |
| 1916 | 51.3% 3,926 | 43.2% 3,308 | 5.5% 420 |
| 1912 | 30.1% 2,309 | 25.5% 1,957 | 44.5% 3,417 |
| 1908 | 58.0% 4,199 | 32.3% 2,339 | 9.8% 707 |
| 1904 | 66.2% 5,553 | 26.7% 2,241 | 7.1% 596 |
| 1900 | 56.7% 5,051 | 38.6% 3,441 | 4.7% 418 |
| 1896 | 50.5% 4,654 | 46.7% 4,303 | 2.8% 259 |
| 1892 | 47.2% 3,619 | 39.0% 2,994 | 13.8% 1,060 |
| 1888 | 51.9% 4,007 | 41.3% 3,187 | 6.8% 525 |
| 1884 | 41.7% 2,705 | 48.4% 3,141 | 9.9% 640 |
The county government operates the jail, maintains rural roads, operates the major local courts, records deeds, mortgages, and vital records, administers public health regulations, and participates with the state in the provision of social services. The county board of commissioners controls the budget and has limited authority to make laws or ordinances. In Michigan, most local government functions — police and fire, building and zoning, tax assessment, street maintenance, etc. — are the responsibility of individual cities and townships.
Elected officials
- Governor: Gretchen Whitmer (D)
- Lt. Governor: Garlin Gilchrist (D)
- Attorney General: Dana Nessel (D)
- Secretary of State: Jocelyn Benson (D)
- State Senator 24th District: Tom Barrett (R)
- State Rep. 85th District: Ben Frederick (R)
- U.S.Rep 4th District: John Moolenaar (R)
- Prosecutor: Scott Koerner (R)
- Sheriff: Brian BeGole (R)
- County Clerk: Caroline Wilson (R)
- County Treasurer: Thomas W. Dwyer (R)
- Register of Deeds: Lori Kimble (R)
- Drain Commissioner: Tony Newman(D)
- County Surveyor: William Wascher (R)
- Road Commissioners: Mike Constine; Ric Crawford; John Michalec
- Commissioner District 1: Marlene Webster (R)
- Commissioner District 2: Daniel McMaster (R)
- Commissioner District 3: Gary Holzhausen (R)
- Commissioner District 4: Brandon Marks (R)
- Commissioner District 5: Jeremy R. Root (R)
- Commissioner District 6: Cindy Garber (R)
- Commissioner District 7: John Plowman (R)
(information as of January 2018)
Communities
Charter townships
Civil townships
Census-designated places
See also
References
- "Bibliography on Shiawassee County". Clarke Historical Library, Central Michigan University. Retrieved January 29, 2013.
- "State & County QuickFacts". US Census Bureau. Retrieved August 29, 2013.
- "Find a County". National Association of Counties. Retrieved June 7, 2011.
- "Centers of Population by State: 2010". US Census Bureau. Retrieved October 2, 2014.
- "2010 Census Gazetteer Files". US Census Bureau. August 22, 2012. Archived from the original on November 13, 2013. Retrieved September 28, 2014.
- "Population and Housing Unit Estimates". Retrieved January 15, 2021.
- "US Decennial Census". US Census Bureau. Retrieved September 28, 2014.
- "Historical Census Browser". University of Virginia Library. Retrieved September 28, 2014.
- "Population of Counties by Decennial Census: 1900 to 1990". US Census Bureau. Retrieved September 28, 2014.
- "Census 2000 PHC-T-4. Ranking Tables for Counties: 1990 and 2000" (PDF). US Census Bureau. Retrieved September 28, 2014.
- "U.S. Census website". US Census Bureau. Retrieved March 11, 2012.
- "2010 Data Release – Data & Documentation – American Community Survey – US Census Bureau". census.gov. Archived from the original on October 27, 2015.
- US Election Atlas
External links
- Shiawassee County History
- Shiawassee County website
- City of Corunna MI
- "Bibliography on Shiawassee County". Clarke Historical Library, Central Michigan University.
- Owosso Independent
Places adjacent to Shiawassee County, Michigan | ||||||||||
|---|---|---|---|---|---|---|---|---|---|---|
| ||||||||||
Municipalities and communities of Shiawassee County, Michigan, United States | ||
|---|---|---|
| Cities | Map of Michigan highlighting Shiawassee County | |
| Villages | ||
| Charter townships | ||
| Civil townships | ||
| CDPs | ||
| Other unincorporated communities | ||
| Footnotes | ‡This populated place also has portions in an adjacent county | |
| ||
Central/Mid-Michigan including the Tri-Cities and Thumb | |||||||
|---|---|---|---|---|---|---|---|
| Central cities | |||||||
| Counties |
| ||||||
| Geography | |||||||
| Transportation | |||||||
| Economy |
| ||||||

| Authority control |
|---|