Ionia County, Michigan
Ionia County is a county located in the U.S. state of Michigan. As of the 2010 census, the population was 63,905.[2] The county seat is Ionia.[3] The Ionia County Courthouse was designed by Claire Allen, a prominent southern Michigan architect.
Ionia County | |
|---|---|
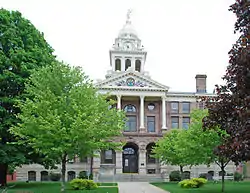 Ionia County Courthouse in Ionia | |
 Seal | |
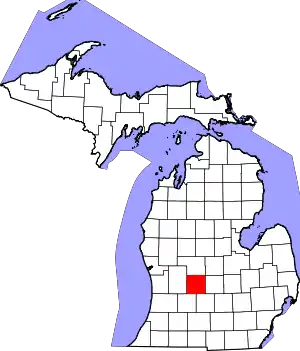 Location within the U.S. state of Michigan | |
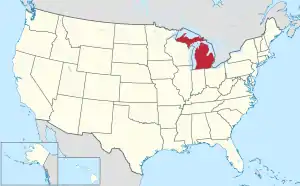 Michigan's location within the U.S. | |
| Coordinates: 42°56′N 85°04′W | |
| Country | |
| State | |
| Founded | March 2, 1831 (created) 1837 (organized)[1] |
| Named for | Ionia |
| Seat | Ionia |
| Largest city | Ionia |
| Area | |
| • Total | 580 sq mi (1,500 km2) |
| • Land | 571 sq mi (1,480 km2) |
| • Water | 8.7 sq mi (23 km2) 1.5%% |
| Population | |
| • Estimate (2018) | 64,210 |
| • Density | 112/sq mi (43/km2) |
| Time zone | UTC−5 (Eastern) |
| • Summer (DST) | UTC−4 (EDT) |
| Congressional district | 3rd |
Ionia County is part of the Grand Rapids-Kentwood, MI Metropolitan Statistical Area.
History
The county is named for Ionia, a historic area of Greece.[4] It was defined by act of the Territorial Legislature in 1831, and was organized in 1837.[1]
Geography
According to the US Census Bureau, the county has a total area of 580 square miles (1,500 km2), of which 571 square miles (1,480 km2) is land and 8.7 square miles (23 km2) (1.5%) is water.[5]
Adjacent counties
- Gratiot County – northeast
- Montcalm County – north
- Clinton County – east
- Kent County – west
- Eaton County – southeast
- Barry County – southwest
Demographics
| Historical population | |||
|---|---|---|---|
| Census | Pop. | %± | |
| 1840 | 1,923 | — | |
| 1850 | 7,597 | 295.1% | |
| 1860 | 16,682 | 119.6% | |
| 1870 | 27,681 | 65.9% | |
| 1880 | 33,872 | 22.4% | |
| 1890 | 32,801 | −3.2% | |
| 1900 | 34,329 | 4.7% | |
| 1910 | 33,550 | −2.3% | |
| 1920 | 33,087 | −1.4% | |
| 1930 | 35,093 | 6.1% | |
| 1940 | 35,710 | 1.8% | |
| 1950 | 38,158 | 6.9% | |
| 1960 | 43,132 | 13.0% | |
| 1970 | 45,848 | 6.3% | |
| 1980 | 51,815 | 13.0% | |
| 1990 | 57,024 | 10.1% | |
| 2000 | 61,518 | 7.9% | |
| 2010 | 63,905 | 3.9% | |
| 2018 (est.) | 64,210 | [6] | 0.5% |
| US Decennial Census[7] 1790-1960[8] 1900-1990[9] 1990-2000[10] 2010-2018[2] | |||
As of the 2000 census,[11] there were 61,518 people, 20,606 households, and 15,145 families residing in the county. The population density was 107 people per square mile (41/km2). There were 22,006 housing units at an average density of 38 per square mile (15/km2). The racial makeup of the county was 91.96% White, 4.56% Black or African American, 0.56% Native American, 0.32% Asian, 0.01% Pacific Islander, 1.04% from other races, and 1.55% from two or more races. 2.78% of the population were Hispanic or Latino of any race. 29.0% were of German, 14.7% American, 11.6% English, 8.9% Irish and 5.3% Dutch ancestry, 96.3% spoke English and 2.6% Spanish as their first language.
There were 20,606 households, out of which 38.10% had children under the age of 18 living with them, 58.70% were married couples living together, 10.10% had a female householder with no husband present, and 26.50% were non-families. 21.90% of all households were made up of individuals, and 8.90% had someone living alone who was 65 years of age or older. The average household size was 2.70 and the average family size was 3.15.
The county's population spread included 26.90% under the age of 18, 11.50% from 18 to 24, 31.00% from 25 to 44, 20.50% from 45 to 64, and 10.00% who were 65 years of age or older. The median age was 33 years. For every 100 females, there were 115.20 males. For every 100 females age 18 and over, there were 120.40 males.
The median income for a household in the county was $43,074, and the median income for a family was $49,797. Males had a median income of $36,995 versus $25,443 for females. The per capita income for the county was $17,451. About 6.80% of families and 8.70% of the population were below the poverty line, including 10.40% of those under age 18 and 8.10% of those age 65 or over.
Government
Ionia County has been reliably Republican from the beginning. Since 1884, the Republican Party nominee has carried the county vote in 82% of the elections (28 of 34 elections).
| Year | Republican | Democratic | Third Parties |
|---|---|---|---|
| 2020 | 64.1% 20,657 | 33.8% 10,901 | 2.0% 651 |
| 2016 | 61.5% 16,635 | 30.9% 8,352 | 7.6% 2,052 |
| 2012 | 55.4% 14,315 | 42.6% 11,018 | 2.0% 523 |
| 2008 | 51.7% 14,156 | 45.9% 12,565 | 2.3% 638 |
| 2004 | 60.2% 16,621 | 38.6% 10,647 | 1.3% 350 |
| 2000 | 58.1% 13,915 | 39.6% 9,481 | 2.4% 574 |
| 1996 | 44.6% 9,574 | 43.2% 9,261 | 12.2% 2,617 |
| 1992 | 38.4% 9,135 | 35.1% 8,370 | 26.5% 6,317 |
| 1988 | 59.1% 12,028 | 40.1% 8,160 | 0.9% 181 |
| 1984 | 70.7% 14,162 | 28.6% 5,735 | 0.7% 138 |
| 1980 | 57.4% 12,040 | 33.6% 7,039 | 9.1% 1,903 |
| 1976 | 62.5% 11,737 | 36.3% 6,820 | 1.3% 234 |
| 1972 | 62.6% 10,898 | 35.8% 6,240 | 1.6% 278 |
| 1968 | 54.0% 8,625 | 37.9% 6,055 | 8.1% 1,288 |
| 1964 | 35.4% 5,698 | 64.3% 10,362 | 0.3% 53 |
| 1960 | 61.8% 10,405 | 37.9% 6,377 | 0.3% 52 |
| 1956 | 68.8% 11,001 | 31.0% 4,952 | 0.3% 46 |
| 1952 | 69.4% 10,970 | 29.9% 4,722 | 0.8% 127 |
| 1948 | 62.6% 7,970 | 35.0% 4,450 | 2.4% 311 |
| 1944 | 67.1% 9,331 | 31.9% 4,437 | 1.1% 146 |
| 1940 | 63.3% 9,439 | 36.2% 5,399 | 0.5% 78 |
| 1936 | 43.9% 6,487 | 48.3% 7,140 | 7.8% 1,155 |
| 1932 | 40.2% 6,074 | 57.6% 8,695 | 2.2% 331 |
| 1928 | 74.9% 9,471 | 24.4% 3,089 | 0.7% 83 |
| 1924 | 73.2% 9,502 | 21.7% 2,821 | 5.1% 656 |
| 1920 | 67.6% 7,977 | 28.8% 3,395 | 3.6% 430 |
| 1916 | 48.4% 3,950 | 47.9% 3,911 | 3.8% 307 |
| 1912 | 26.5% 2,049 | 35.7% 2,757 | 37.8% 2,926[13] |
| 1908 | 54.8% 4,584 | 38.6% 3,232 | 6.6% 554 |
| 1904 | 63.8% 5,440 | 32.0% 2,729 | 4.2% 356 |
| 1900 | 54.3% 5,101 | 43.2% 4,055 | 2.5% 236 |
| 1896 | 48.4% 4,593 | 50.1% 4,757 | 1.6% 149 |
| 1892 | 49.5% 4,288 | 43.6% 3,779 | 7.0% 604 |
| 1888 | 51.0% 4,436 | 43.4% 3,779 | 5.6% 491 |
| 1884 | 45.1% 3,552 | 48.4% 3,814 | 6.5% 510 |
The county government operates the jail, maintains rural roads, operates the major local courts, records deeds, mortgages, and vital records, administers public health regulations, and participates with the state in the provision of social services. The county board of commissioners controls the budget and has limited authority to make laws or ordinances. In Michigan, most local government functions—police and fire, building and zoning, tax assessment, street maintenance, etc.—are the responsibility of individual cities and townships.
Elected officials
- Prosecuting Attorney: Kyle B. Butler
- Sheriff: Charlie D. Noll
- County Clerk: Janae K. Cooper
- County Treasurer: Judith Clark
- Register of Deeds: Diane M. Adams
- Drain Commissioner: Robert Rose
- County Commissioner District 1: David Hodges
- County Commissioner District 2: Larry Tiejema
- County Commissioner District 3: James L. Banks
- County Commissioner District 4: Chris Bredice
- County Commissioner District 5: Scott Wirtz
- County Commissioner District 6: Jack Shattuck
- County Commissioner District 7: Georgia Sharp
(information as of May 2019)
Communities
Villages
See also
References
- "Bibliography on Ionia County". Clarke Historical Library, Central Michigan University. Retrieved January 19, 2013.
- "State & County QuickFacts". US Census Bureau. Archived from the original on June 29, 2011. Retrieved August 27, 2013.
- "Find a County". National Association of Counties. Archived from the original on May 31, 2011. Retrieved June 7, 2011.
- Gannett, Henry (1905). The Origin of Certain Place Names in the United States. Govt. Print. Off. p. 165.
- "2010 Census Gazetteer Files". US Census Bureau. August 22, 2012. Archived from the original on November 13, 2013. Retrieved September 25, 2014.
- "Population and Housing Unit Estimates". Retrieved May 9, 2019.
- "US Decennial Census". US Census Bureau. Retrieved September 25, 2014.
- "Historical Census Browser". University of Virginia Library. Retrieved September 25, 2014.
- "Population of Counties by Decennial Census: 1900 to 1990". US Census Bureau. Retrieved September 25, 2014.
- "Census 2000 PHC-T-4. Ranking Tables for Counties: 1990 and 2000" (PDF). US Census Bureau. Retrieved September 25, 2014.
- "U.S. Census website". US Census Bureau. Retrieved January 31, 2008.
- US Election Atlas
- The leading "other" candidate, Progressive Theodore Roosevelt, received 2,579 votes, while Socialist candidate Eugene Debs received 170 votes, Prohibition candidate Eugene Chafin received 165 votes, and Socialist Labor candidate Arthur Reimer received 12 votes.
External links
- Ionia County official website
- Ionia Montcalm Magazine website
- Ionia County Historical Society website
- "Bibliography on Ionia County". Clarke Historical Library, Central Michigan University.
Places adjacent to Ionia County, Michigan | ||||||||||
|---|---|---|---|---|---|---|---|---|---|---|
| ||||||||||
Municipalities and communities of Ionia County, Michigan, United States | ||
|---|---|---|
| Cities | Map of Michigan highlighting Ionia County | |
| Villages | ||
| Townships | ||
| Footnotes | ‡This populated place also has portions in an adjacent county or counties | |
| ||
| Central cities | |||
|---|---|---|---|
| Counties |
| ||
| Geography | |||
| Transportation | |||
| Economy | |||
| Authority control |
|---|