1940 United States presidential election in Wyoming
The 1940 United States presidential election in Wyoming took place on November 5, 1940, as part of the 1940 United States presidential election. State voters chose three representatives, or electors, to the Electoral College, who voted for president and vice president.
| ||||||||||||||||||||||||||
| ||||||||||||||||||||||||||
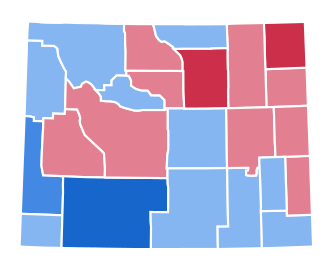 County Results
| ||||||||||||||||||||||||||
| ||||||||||||||||||||||||||
| Elections in Wyoming |
|---|
 |
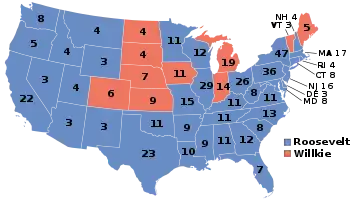
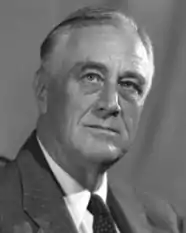
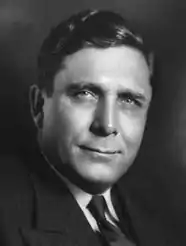
Wyoming was won by President Franklin D. Roosevelt (D–New York), running with the 11th Secretary of Agriculture Henry A. Wallace, with 52.82 percent of the popular vote, against American lawyer and corporate executive Wendell Willkie (R–New York), running with senator Charles L. McNary, with 46.89 percent of the popular vote.[1]
This would be the last occasion Teton County would vote for a Democratic presidential candidate until Bill Clinton carried the county in 1992 – since then it has become a Democratic island in the nation's "reddest" state.[2]
Results
| Party | Candidate | Votes | % | |
|---|---|---|---|---|
| Democratic | Franklin D. Roosevelt | 59,287 | 52.82% | |
| Republican | Wendell Willkie | 52,633 | 46.89% | |
| Prohibition | Roger W. Babson | 172 | 0.15% | |
| Socialist | Norman Thomas | 148 | 0.13% | |
| Total votes | 112,240 | 100.00% | ||
Results by county
| County | Franklin Delano Roosevelt Democratic |
Wendell Lewis Willkie Republican |
Roger Ward Babson[3] Prohibition |
Norman Mattoon Thomas[3] Socialist |
Margin | Total votes cast[4] | |||||
|---|---|---|---|---|---|---|---|---|---|---|---|
| # | % | # | % | # | % | # | % | # | % | ||
| Albany | 4,018 | 59.05% | 2,756 | 40.51% | 16 | 0.24% | 14 | 0.21% | 1,262 | 18.55% | 6,804 |
| Big Horn | 2,594 | 47.38% | 2,859 | 52.22% | 13 | 0.24% | 9 | 0.16% | -265 | -4.84% | 5,475 |
| Campbell | 1,128 | 42.17% | 1,540 | 57.57% | 3 | 0.11% | 4 | 0.15% | -412 | -15.40% | 2,675 |
| Carbon | 3,429 | 54.26% | 2,882 | 45.60% | 6 | 0.09% | 3 | 0.05% | 547 | 8.66% | 6,320 |
| Converse | 1,395 | 42.45% | 1,889 | 57.49% | 2 | 0.06% | 0 | 0.00% | -494 | -15.03% | 3,286 |
| Crook | 869 | 38.92% | 1,359 | 60.86% | 3 | 0.13% | 2 | 0.09% | -490 | -21.94% | 2,233 |
| Fremont | 2,644 | 40.97% | 3,788 | 58.70% | 9 | 0.14% | 12 | 0.19% | -1,144 | -17.73% | 6,453 |
| Goshen | 1,982 | 40.80% | 2,861 | 58.89% | 10 | 0.21% | 5 | 0.10% | -879 | -18.09% | 4,858 |
| Hot Springs | 1,266 | 57.70% | 913 | 41.61% | 8 | 0.36% | 7 | 0.32% | 353 | 16.09% | 2,194 |
| Johnson | 781 | 34.76% | 1,460 | 64.98% | 3 | 0.13% | 3 | 0.13% | -679 | -30.22% | 2,247 |
| Laramie | 7,808 | 56.50% | 5,955 | 43.09% | 26 | 0.19% | 31 | 0.22% | 1,853 | 13.41% | 13,820 |
| Lincoln | 2,839 | 61.65% | 1,765 | 38.33% | 1 | 0.02% | 0 | 0.00% | 1,074 | 23.32% | 4,605 |
| Natrona | 6,373 | 53.34% | 5,555 | 46.49% | 10 | 0.08% | 11 | 0.09% | 818 | 6.85% | 11,949 |
| Niobrara | 1,200 | 45.59% | 1,427 | 54.22% | 3 | 0.11% | 2 | 0.08% | -227 | -8.62% | 2,632 |
| Park | 2,747 | 52.01% | 2,512 | 47.56% | 19 | 0.36% | 4 | 0.08% | 235 | 4.45% | 5,282 |
| Platte | 1,849 | 51.05% | 1,758 | 48.54% | 4 | 0.11% | 11 | 0.30% | 91 | 2.51% | 3,622 |
| Sheridan | 4,439 | 53.69% | 3,814 | 46.13% | 12 | 0.15% | 3 | 0.04% | 625 | 7.56% | 8,268 |
| Sublette | 627 | 44.72% | 771 | 54.99% | 1 | 0.07% | 3 | 0.21% | -144 | -10.27% | 1,402 |
| Sweetwater | 6,637 | 72.98% | 2,439 | 26.82% | 10 | 0.11% | 8 | 0.09% | 4,198 | 46.16% | 9,094 |
| Teton | 728 | 53.81% | 623 | 46.05% | 1 | 0.07% | 1 | 0.07% | 105 | 7.76% | 1,353 |
| Uinta | 2,007 | 59.89% | 1,335 | 39.84% | 6 | 0.18% | 3 | 0.09% | 672 | 20.05% | 3,351 |
| Washakie | 942 | 46.34% | 1,080 | 53.12% | 5 | 0.25% | 6 | 0.30% | -138 | -6.79% | 2,033 |
| Weston | 985 | 43.13% | 1,292 | 56.57% | 1 | 0.04% | 6 | 0.26% | -307 | -13.44% | 2,284 |
| Totals | 59,287 | 52.82% | 52,633 | 46.89% | 172 | 0.15% | 148 | 0.13% | 6,654 | 5.93% | 112,240 |
References
- "1940 Presidential Election Results – Wyoming".
- Menendez, Albert J.; The Geography of Presidential Elections in the United States, 1868-2004, pp. 342-343 ISBN 0786422173
- Our Campaigns; WY US Presidential Election, November 05, 1940
- Scammon, Richard M. (compiler); America at the Polls: A Handbook of Presidential Election Statistics 1920-1964; p. 515 ISBN 0405077114