1980 United States presidential election in North Carolina
The 1980 United States presidential election in North Carolina took place on November 4, 1980, as part of the 1980 United States presidential election. Voters chose 13 representatives, or electors to the Electoral College, who voted for president and vice president.
| ||||||||||||||||||||||||||
| ||||||||||||||||||||||||||
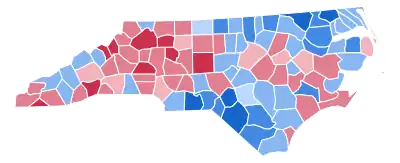 County Results
| ||||||||||||||||||||||||||
| ||||||||||||||||||||||||||

| Elections in North Carolina |
|---|
 |
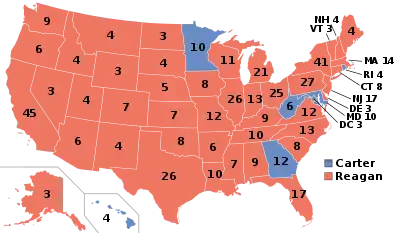
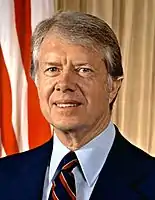
North Carolina barely voted for the Republican nominee, Governor Ronald Reagan, over the Democratic nominee, President Jimmy Carter in a close battle. Independent John B. Anderson, won 2% of the vote from Reagan and Carter in the state. The final numbers were 49.30% for Reagan to 47.18% for Carter and 2.85% for Anderson. As of the 2020 presidential election, this is the last election in which the following counties have voted for a Democratic presidential candidate: Cleveland, Currituck, Harnett, Lee, Person and Union.[1]
After Jimmy Carter won the southern state in 1976, and following Jimmy Carter's inferior performance, the state was returned to the Republican column in 1980, and would trend even more Republican in the next election and vote Republican in every election after, except in 2008 when it voted for Barack Obama over John McCain.
Results
| 1980 United States presidential election in North Carolina[2] | |||||
|---|---|---|---|---|---|
| Party | Candidate | Votes | Percentage | Electoral votes | |
| Republican | Ronald Reagan | 915,018 | 49.30% | 13 | |
| Democratic | Jimmy Carter (incumbent) | 875,635 | 47.18% | 0 | |
| Independent | John B. Anderson | 52,800 | 2.85% | 0 | |
| Libertarian | Edward Clark | 9,677 | 0.52% | 0 | |
| Citizens | Barry Commoner | 2,287 | 0.12% | 0 | |
| Socialist Workers | Clifton DeBerry | 416 | 0.02% | 0 | |
| Totals | 1,855,833 | 100.0% | 13 | ||
| Voter turnout (Voting age/Registered voters) | 54.52%/67.0% | — | |||
Results by county
| County | Ronald Wilson Reagan[3] Republican |
James Earl Carter[3] Democratic |
John Bayard Anderson[3] Independent |
Edward E. Clark[3] Libertarian |
Various candidates[3] Other parties |
Margin | ||||||
|---|---|---|---|---|---|---|---|---|---|---|---|---|
| % | # | % | # | % | # | % | # | % | # | % | # | |
| Mitchell | 68.93% | 4,322 | 28.15% | 1,765 | 2.33% | 146 | 0.51% | 32 | 0.08% | 5 | 40.78% | 2,557 |
| Avery | 67.14% | 3,480 | 29.46% | 1,527 | 2.84% | 147 | 0.42% | 22 | 0.14% | 7 | 37.68% | 1,953 |
| Randolph | 64.72% | 19,881 | 32.90% | 10,107 | 1.83% | 563 | 0.47% | 145 | 0.07% | 23 | 31.82% | 9,774 |
| Yadkin | 65.08% | 7,530 | 33.28% | 3,850 | 1.18% | 136 | 0.43% | 50 | 0.03% | 4 | 31.81% | 3,680 |
| Davie | 63.79% | 6,302 | 33.29% | 3,289 | 2.26% | 223 | 0.64% | 63 | 0.03% | 3 | 30.50% | 3,013 |
| Wilkes | 62.74% | 14,462 | 35.51% | 8,184 | 1.22% | 282 | 0.44% | 102 | 0.08% | 19 | 27.24% | 6,278 |
| Henderson | 61.19% | 13,573 | 34.16% | 7,578 | 4.06% | 901 | 0.44% | 97 | 0.15% | 33 | 27.03% | 5,995 |
| Catawba | 60.39% | 22,873 | 36.63% | 13,873 | 2.29% | 866 | 0.64% | 242 | 0.06% | 24 | 23.76% | 9,000 |
| Clay | 60.19% | 2,136 | 37.31% | 1,324 | 1.49% | 53 | 0.79% | 28 | 0.23% | 8 | 22.88% | 812 |
| Rowan | 59.66% | 18,566 | 37.50% | 11,671 | 2.27% | 707 | 0.50% | 155 | 0.06% | 20 | 22.16% | 6,895 |
| Davidson | 59.56% | 22,794 | 38.10% | 14,579 | 1.77% | 679 | 0.53% | 202 | 0.04% | 15 | 21.47% | 8,215 |
| Cabarrus | 59.19% | 15,143 | 38.18% | 9,768 | 2.20% | 562 | 0.38% | 96 | 0.06% | 16 | 21.01% | 5,375 |
| Caldwell | 58.11% | 12,965 | 39.17% | 8,738 | 1.97% | 440 | 0.61% | 135 | 0.14% | 32 | 18.95% | 4,227 |
| Alexander | 57.39% | 6,376 | 40.92% | 4,546 | 1.23% | 137 | 0.40% | 44 | 0.05% | 6 | 16.47% | 1,830 |
| Nash | 56.34% | 11,043 | 41.75% | 8,184 | 1.49% | 293 | 0.38% | 74 | 0.04% | 7 | 14.59% | 2,859 |
| Wayne | 56.31% | 12,860 | 41.98% | 9,586 | 1.41% | 322 | 0.27% | 62 | 0.03% | 7 | 14.34% | 3,274 |
| Gaston | 55.61% | 25,139 | 42.07% | 19,016 | 1.82% | 823 | 0.44% | 201 | 0.06% | 25 | 13.55% | 6,123 |
| Lenoir | 55.50% | 9,832 | 42.60% | 7,546 | 1.48% | 263 | 0.32% | 57 | 0.09% | 16 | 12.91% | 2,286 |
| Polk | 53.86% | 3,021 | 42.34% | 2,375 | 2.85% | 160 | 0.87% | 49 | 0.07% | 4 | 11.52% | 646 |
| Ashe | 54.72% | 5,643 | 43.26% | 4,461 | 1.49% | 154 | 0.46% | 47 | 0.07% | 7 | 11.46% | 1,182 |
| Stokes | 54.92% | 7,275 | 43.52% | 5,764 | 1.14% | 151 | 0.38% | 50 | 0.05% | 6 | 11.41% | 1,511 |
| New Hanover | 53.48% | 17,243 | 42.40% | 13,670 | 3.45% | 1,114 | 0.56% | 182 | 0.11% | 35 | 11.08% | 3,573 |
| Moore | 53.71% | 10,158 | 42.74% | 8,084 | 2.98% | 563 | 0.48% | 91 | 0.09% | 17 | 10.97% | 2,074 |
| Stanly | 54.54% | 9,734 | 43.62% | 7,784 | 1.39% | 248 | 0.39% | 69 | 0.07% | 12 | 10.93% | 1,950 |
| Cherokee | 54.37% | 3,849 | 43.99% | 3,114 | 1.13% | 80 | 0.47% | 33 | 0.04% | 3 | 10.38% | 735 |
| Iredell | 53.70% | 14,926 | 43.42% | 12,067 | 2.25% | 624 | 0.57% | 158 | 0.07% | 19 | 10.29% | 2,859 |
| Graham | 54.25% | 1,961 | 44.48% | 1,608 | 1.00% | 36 | 0.17% | 6 | 0.11% | 4 | 9.76% | 353 |
| Watauga | 51.42% | 6,149 | 42.00% | 5,022 | 5.39% | 645 | 0.88% | 105 | 0.31% | 37 | 9.42% | 1,127 |
| McDowell | 53.55% | 5,680 | 44.34% | 4,703 | 1.65% | 175 | 0.41% | 44 | 0.04% | 4 | 9.21% | 977 |
| Transylvania | 52.59% | 4,826 | 43.67% | 4,008 | 2.99% | 274 | 0.63% | 58 | 0.12% | 11 | 8.91% | 818 |
| Alamance | 53.06% | 18,077 | 44.15% | 15,042 | 2.23% | 760 | 0.48% | 164 | 0.07% | 25 | 8.91% | 3,035 |
| Onslow | 52.95% | 8,861 | 44.04% | 7,371 | 2.39% | 400 | 0.54% | 90 | 0.08% | 14 | 8.90% | 1,490 |
| Guilford | 51.93% | 53,291 | 43.38% | 44,516 | 3.92% | 4,019 | 0.62% | 636 | 0.16% | 168 | 8.55% | 8,775 |
| Carteret | 52.37% | 7,733 | 43.92% | 6,485 | 3.12% | 460 | 0.49% | 73 | 0.11% | 16 | 8.45% | 1,248 |
| Lincoln | 52.37% | 9,009 | 45.32% | 7,796 | 1.74% | 299 | 0.49% | 85 | 0.07% | 12 | 7.05% | 1,213 |
| Macon | 52.34% | 4,727 | 45.45% | 4,105 | 1.69% | 153 | 0.43% | 39 | 0.08% | 7 | 6.89% | 622 |
| Beaufort | 51.95% | 6,773 | 46.21% | 6,024 | 1.43% | 186 | 0.38% | 49 | 0.04% | 5 | 5.75% | 749 |
| Dare | 49.92% | 2,794 | 44.29% | 2,479 | 4.65% | 260 | 0.89% | 50 | 0.25% | 14 | 5.63% | 315 |
| Surry | 51.86% | 10,065 | 46.31% | 8,987 | 1.32% | 256 | 0.47% | 92 | 0.04% | 8 | 5.55% | 1,078 |
| Burke | 50.97% | 12,956 | 45.95% | 11,680 | 2.20% | 558 | 0.66% | 169 | 0.21% | 54 | 5.02% | 1,276 |
| Craven | 50.97% | 8,554 | 46.36% | 7,781 | 2.12% | 356 | 0.48% | 81 | 0.07% | 11 | 4.61% | 773 |
| Forsyth | 49.98% | 42,389 | 45.83% | 38,870 | 3.42% | 2,897 | 0.62% | 527 | 0.15% | 128 | 4.15% | 3,519 |
| Johnston | 51.26% | 10,444 | 47.12% | 9,601 | 1.33% | 271 | 0.27% | 54 | 0.03% | 6 | 4.14% | 843 |
| Buncombe | 48.80% | 26,124 | 46.40% | 24,837 | 4.02% | 2,153 | 0.56% | 299 | 0.22% | 119 | 2.40% | 1,287 |
| Wilson | 49.86% | 8,329 | 48.14% | 8,042 | 1.45% | 243 | 0.43% | 71 | 0.11% | 19 | 1.72% | 287 |
| Mecklenburg | 47.80% | 68,384 | 46.83% | 66,995 | 4.59% | 6,560 | 0.67% | 956 | 0.12% | 168 | 0.97% | 1,389 |
| Pitt | 48.60% | 12,816 | 47.74% | 12,590 | 3.14% | 827 | 0.38% | 101 | 0.14% | 37 | 0.86% | 226 |
| Wake | 47.21% | 49,768 | 46.49% | 49,003 | 5.17% | 5,455 | 0.70% | 741 | 0.43% | 449 | 0.73% | 765 |
| Rutherford | 49.29% | 8,363 | 49.01% | 8,315 | 1.20% | 203 | 0.46% | 78 | 0.04% | 7 | 0.28% | 48 |
| Cumberland | 47.63% | 21,540 | 48.80% | 22,073 | 2.79% | 1,261 | 0.65% | 293 | 0.13% | 61 | -1.18% | -533 |
| Rockingham | 47.64% | 11,205 | 49.77% | 11,708 | 1.97% | 463 | 0.55% | 130 | 0.07% | 16 | -2.14% | -503 |
| Alleghany | 46.29% | 1,995 | 51.00% | 2,198 | 2.11% | 91 | 0.56% | 24 | 0.05% | 2 | -4.71% | -203 |
| Union | 45.77% | 9,012 | 51.16% | 10,073 | 2.47% | 487 | 0.52% | 102 | 0.07% | 14 | -5.39% | -1,061 |
| Lee | 45.84% | 4,847 | 51.31% | 5,426 | 2.37% | 251 | 0.38% | 40 | 0.09% | 10 | -5.48% | -579 |
| Sampson | 46.06% | 8,097 | 51.71% | 9,090 | 1.75% | 308 | 0.33% | 58 | 0.14% | 25 | -5.65% | -993 |
| Cleveland | 46.08% | 10,828 | 52.00% | 12,219 | 1.42% | 333 | 0.47% | 111 | 0.03% | 8 | -5.92% | -1,391 |
| Brunswick | 45.35% | 5,897 | 52.00% | 6,761 | 2.04% | 265 | 0.55% | 71 | 0.07% | 9 | -6.64% | -864 |
| Montgomery | 45.74% | 3,587 | 52.65% | 4,129 | 1.26% | 99 | 0.32% | 25 | 0.03% | 2 | -6.91% | -542 |
| Jackson | 44.47% | 4,140 | 52.17% | 4,857 | 2.64% | 246 | 0.54% | 50 | 0.18% | 17 | -7.70% | -717 |
| Currituck | 44.06% | 1,668 | 52.30% | 1,980 | 2.56% | 97 | 0.98% | 37 | 0.11% | 4 | -8.24% | -312 |
| Yancey | 44.57% | 3,363 | 53.14% | 4,010 | 1.46% | 110 | 0.41% | 31 | 0.42% | 32 | -8.57% | -647 |
| Harnett | 44.70% | 7,284 | 53.95% | 8,791 | 1.01% | 165 | 0.26% | 42 | 0.08% | 13 | -9.25% | -1,507 |
| Madison | 44.02% | 2,629 | 53.62% | 3,202 | 1.81% | 108 | 0.35% | 21 | 0.20% | 12 | -9.59% | -573 |
| Pasquotank | 43.39% | 3,340 | 53.62% | 4,128 | 2.33% | 179 | 0.48% | 37 | 0.18% | 14 | -10.24% | -788 |
| Person | 43.55% | 3,281 | 54.57% | 4,111 | 1.38% | 104 | 0.45% | 34 | 0.05% | 4 | -11.02% | -830 |
| Durham | 40.24% | 19,276 | 52.12% | 24,969 | 6.37% | 3,052 | 0.57% | 274 | 0.70% | 333 | -11.88% | -5,693 |
| Greene | 43.44% | 2,221 | 55.45% | 2,835 | 0.66% | 34 | 0.39% | 20 | 0.06% | 3 | -12.01% | -614 |
| Vance | 43.15% | 4,217 | 55.40% | 5,415 | 1.03% | 101 | 0.36% | 35 | 0.06% | 6 | -12.26% | -1,198 |
| Perquimans | 42.40% | 1,210 | 54.66% | 1,560 | 2.21% | 63 | 0.60% | 17 | 0.14% | 4 | -12.26% | -350 |
| Chatham | 41.00% | 5,414 | 54.10% | 7,144 | 3.64% | 481 | 0.75% | 99 | 0.51% | 67 | -13.10% | -1,730 |
| Edgecombe | 42.09% | 5,916 | 56.52% | 7,945 | 1.05% | 148 | 0.26% | 36 | 0.08% | 11 | -14.44% | -2,029 |
| Haywood | 41.33% | 7,217 | 56.20% | 9,814 | 2.00% | 349 | 0.38% | 66 | 0.09% | 16 | -14.87% | -2,597 |
| Swain | 41.39% | 1,457 | 56.45% | 1,987 | 1.99% | 70 | 0.14% | 5 | 0.03% | 1 | -15.06% | -530 |
| Halifax | 41.19% | 6,033 | 57.10% | 8,364 | 1.23% | 180 | 0.38% | 56 | 0.10% | 15 | -15.91% | -2,331 |
| Duplin | 41.34% | 5,403 | 57.57% | 7,524 | 0.83% | 109 | 0.24% | 32 | 0.01% | 1 | -16.23% | -2,121 |
| Pamlico | 39.55% | 1,504 | 58.48% | 2,224 | 1.26% | 48 | 0.53% | 20 | 0.18% | 7 | -18.93% | -720 |
| Camden | 38.94% | 813 | 58.05% | 1,212 | 2.16% | 45 | 0.57% | 12 | 0.29% | 6 | -19.11% | -399 |
| Chowan | 38.91% | 1,424 | 58.63% | 2,146 | 1.94% | 71 | 0.44% | 16 | 0.08% | 3 | -19.73% | -722 |
| Hyde | 38.95% | 807 | 58.93% | 1,221 | 1.79% | 37 | 0.24% | 5 | 0.10% | 2 | -19.98% | -414 |
| Orange | 32.39% | 9,261 | 53.26% | 15,226 | 11.77% | 3,364 | 1.05% | 300 | 1.53% | 438 | -20.86% | -5,965 |
| Franklin | 38.63% | 3,508 | 59.76% | 5,427 | 1.15% | 104 | 0.42% | 38 | 0.04% | 4 | -21.13% | -1,919 |
| Washington | 38.57% | 1,943 | 59.72% | 3,008 | 1.35% | 68 | 0.30% | 15 | 0.06% | 3 | -21.14% | -1,065 |
| Jones | 38.60% | 1,401 | 60.55% | 2,198 | 0.50% | 18 | 0.30% | 11 | 0.06% | 2 | -21.96% | -797 |
| Granville | 37.99% | 3,513 | 60.08% | 5,556 | 1.44% | 133 | 0.31% | 29 | 0.18% | 17 | -22.09% | -2,043 |
| Pender | 37.79% | 3,018 | 60.51% | 4,832 | 1.29% | 103 | 0.33% | 26 | 0.09% | 7 | -22.71% | -1,814 |
| Caswell | 37.32% | 2,156 | 61.09% | 3,529 | 1.14% | 66 | 0.36% | 21 | 0.09% | 5 | -23.77% | -1,373 |
| Columbus | 34.64% | 5,522 | 64.06% | 10,212 | 0.93% | 148 | 0.35% | 55 | 0.03% | 5 | -29.42% | -4,690 |
| Martin | 34.59% | 2,564 | 64.09% | 4,750 | 1.09% | 81 | 0.22% | 16 | 0.01% | 1 | -29.49% | -2,186 |
| Richmond | 33.69% | 3,911 | 63.88% | 7,416 | 1.93% | 224 | 0.42% | 49 | 0.08% | 9 | -30.19% | -3,505 |
| Tyrrell | 34.01% | 466 | 64.74% | 887 | 1.02% | 14 | 0.22% | 3 | 0.00% | 0 | -30.73% | -421 |
| Scotland | 31.45% | 2,133 | 65.56% | 4,446 | 2.29% | 155 | 0.60% | 41 | 0.10% | 7 | -34.10% | -2,313 |
| Hertford | 30.59% | 1,854 | 67.69% | 4,102 | 1.32% | 80 | 0.33% | 20 | 0.07% | 4 | -37.10% | -2,248 |
| Bladen | 30.70% | 2,745 | 68.27% | 6,104 | 0.72% | 64 | 0.29% | 26 | 0.02% | 2 | -37.57% | -3,359 |
| Bertie | 30.10% | 1,695 | 68.59% | 3,863 | 0.80% | 45 | 0.28% | 16 | 0.23% | 13 | -38.49% | -2,168 |
| Warren | 29.13% | 1,582 | 69.06% | 3,750 | 1.36% | 74 | 0.28% | 15 | 0.17% | 9 | -39.93% | -2,168 |
| Anson | 27.77% | 1,968 | 70.16% | 4,973 | 1.57% | 111 | 0.32% | 23 | 0.18% | 13 | -42.40% | -3,005 |
| Robeson | 27.89% | 6,982 | 70.39% | 17,618 | 1.32% | 331 | 0.29% | 72 | 0.11% | 27 | -42.49% | -10,636 |
| Gates | 27.60% | 957 | 70.23% | 2,435 | 1.76% | 61 | 0.32% | 11 | 0.09% | 3 | -42.63% | -1,478 |
| Northampton | 26.92% | 1,847 | 71.90% | 4,933 | 0.90% | 62 | 0.23% | 16 | 0.04% | 3 | -44.98% | -3,086 |
| Hoke | 25.24% | 1,168 | 72.95% | 3,376 | 1.21% | 56 | 0.45% | 21 | 0.15% | 7 | -47.71% | -2,208 |
References
- Sullivan, Robert David; ‘How the Red and Blue Map Evolved Over the Past Century’; America Magazine in The National Catholic Review; June 29, 2016
- Dave Leip’s U.S. Election Atlas; 1980 Presidential General Election Results – North Carolina
- Our Campaigns; NC US President Race, November 04, 1980