1996 United States presidential election in North Carolina
The 1996 United States presidential election in North Carolina took place on 5 November 1996 as part of the 1996 United States presidential election. Voters in North Carolina chose 14 representatives, or electors to the Electoral College, who voted for president and vice president.
| |||||||||||||||||||||||||||||||||
| |||||||||||||||||||||||||||||||||
 County Results
| |||||||||||||||||||||||||||||||||
| |||||||||||||||||||||||||||||||||


| Elections in North Carolina |
|---|
 |
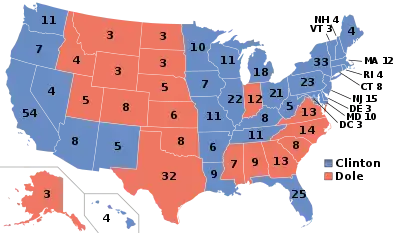
North Carolina was narrowly won by the Republican nominee, Senator Bob Dole of Kansas, defeating incumbent Democratic President Bill Clinton of Arkansas. Dole won with a plurality of 48.73% of the vote to Clinton's 44.04%, a margin of 4.69%. The Reform Party candidate, billionaire businessman Ross Perot, came in a distant third, with 6.68%.
In 1992, George H. W. Bush had become the first losing Republican to carry North Carolina in the party's history. Bush carried the state by 0.79%. Although it remained close in 1996, Dole improved non-trivially on Bush's margin on his way to becoming only the second losing Republican to carry the state, reflecting the state's increasingly Republican orientation. Much of Dole's strength came from wins in large counties anchored by, or adjoining, an urban area. He flipped Wake County, home of Raleigh and the largest county in the nation he flipped outside California, carrying it by 2.3%. His top two raw vote margins in the state came from Gaston County, a suburban county adjoining Mecklenburg County (home of Charlotte), and Forsyth County, home of Winston-Salem; in the latter, he increased Bush's '92 margin of 3.2% to 11.3%. He also shrank Bill Clinton's margin in Guilford County, home of Greensboro, from 4.2% to 1.0%. (Clinton did, however, flip Mecklenburg County itself.)
As of the 2020 presidential election, this is the last election in which the following counties have voted for a Democratic presidential candidate: Camden, Duplin, Franklin, Haywood, Jones, Madison, Montgomery, Perquimans and Swain.[1]
Results
| Party | Candidate | Votes | % | ±% | |
|---|---|---|---|---|---|
| Republican | Bob Dole | 1,225,938 | 48.73 | ||
| Democratic | Bill Clinton (incumbent) | 1,107,849 | 44.04 | ||
| Reform | Ross Perot | 168,059 | 6.68 | ||
| Libertarian | Harry Browne | 8,740 | 0.35 | ||
| Natural Law | John Hagelin | 2,771 | 0.11 | ||
| Independent | Ralph Nader (write-in) | 2,108 | 0.08 | ||
| Independent | Howard Phillips (write-in) | 258 | 0.01 | ||
| Independent | James Harris (write-in) | 84 | 0.00 | ||
| Turnout | 2,515,807 | ||||
Results by county
| County | Robert Joseph Dole[2] Republican |
William Jefferson Clinton[2] Democratic |
Henry Ross Perot[2] Reform |
Harry Edson Browne[2] Libertarian |
Various candidates[2] Other parties |
Margin | ||||||
|---|---|---|---|---|---|---|---|---|---|---|---|---|
| % | # | % | # | % | # | % | # | % | # | % | # | |
| Yadkin | 68.54% | 8,439 | 23.77% | 2,927 | 7.41% | 913 | 0.18% | 22 | 0.10% | 12 | 44.77% | 5,512 |
| Mitchell | 65.15% | 3,874 | 25.16% | 1,496 | 9.23% | 549 | 0.34% | 20 | 0.12% | 7 | 39.99% | 2,378 |
| Avery | 62.83% | 3,870 | 25.75% | 1,586 | 10.63% | 655 | 0.45% | 28 | 0.32% | 20 | 37.08% | 2,284 |
| Davie | 64.51% | 8,141 | 27.93% | 3,525 | 7.25% | 915 | 0.21% | 27 | 0.10% | 12 | 36.58% | 4,616 |
| Randolph | 61.36% | 23,030 | 28.73% | 10,783 | 9.57% | 3,593 | 0.22% | 82 | 0.13% | 47 | 32.63% | 12,247 |
| Stokes | 61.82% | 9,471 | 31.13% | 4,769 | 6.69% | 1,025 | 0.29% | 45 | 0.07% | 10 | 30.69% | 4,702 |
| Davidson | 58.75% | 24,797 | 32.21% | 13,593 | 8.76% | 3,698 | 0.21% | 89 | 0.07% | 30 | 26.55% | 11,204 |
| Wilkes | 58.39% | 12,395 | 32.00% | 6,793 | 9.27% | 1,967 | 0.27% | 58 | 0.07% | 15 | 26.39% | 5,602 |
| Henderson | 58.70% | 19,182 | 32.52% | 10,626 | 8.20% | 2,679 | 0.41% | 135 | 0.17% | 54 | 26.18% | 8,556 |
| Catawba | 58.03% | 26,898 | 33.66% | 15,601 | 7.83% | 3,629 | 0.37% | 171 | 0.12% | 55 | 24.37% | 11,297 |
| Gaston | 58.42% | 33,149 | 34.29% | 19,458 | 6.91% | 3,921 | 0.28% | 158 | 0.09% | 53 | 24.13% | 13,691 |
| Alexander | 57.53% | 6,748 | 33.72% | 3,955 | 8.56% | 1,004 | 0.13% | 15 | 0.07% | 8 | 23.81% | 2,793 |
| Rowan | 57.94% | 22,754 | 34.28% | 13,461 | 7.39% | 2,902 | 0.30% | 117 | 0.10% | 39 | 23.66% | 9,293 |
| Johnston | 58.23% | 18,704 | 34.79% | 11,175 | 6.73% | 2,163 | 0.17% | 55 | 0.07% | 22 | 23.44% | 7,529 |
| Union | 57.03% | 18,802 | 34.96% | 11,525 | 7.51% | 2,477 | 0.35% | 117 | 0.15% | 49 | 22.07% | 7,277 |
| Iredell | 56.57% | 21,163 | 35.02% | 13,102 | 7.94% | 2,970 | 0.30% | 114 | 0.16% | 60 | 21.55% | 8,061 |
| Stanly | 56.29% | 11,446 | 35.07% | 7,131 | 8.31% | 1,690 | 0.23% | 46 | 0.10% | 20 | 21.22% | 4,315 |
| Cabarrus | 55.76% | 23,035 | 34.97% | 14,447 | 8.78% | 3,626 | 0.32% | 132 | 0.17% | 70 | 20.79% | 8,588 |
| Caldwell | 55.18% | 12,653 | 35.11% | 8,050 | 9.15% | 2,099 | 0.21% | 48 | 0.35% | 81 | 20.07% | 4,603 |
| Carteret | 56.15% | 11,721 | 36.24% | 7,566 | 7.03% | 1,467 | 0.36% | 75 | 0.23% | 47 | 19.90% | 4,155 |
| Onslow | 55.70% | 13,396 | 36.11% | 8,685 | 7.72% | 1,857 | 0.37% | 88 | 0.10% | 23 | 19.59% | 4,711 |
| Surry | 55.53% | 11,117 | 36.48% | 7,303 | 7.68% | 1,538 | 0.22% | 44 | 0.09% | 19 | 19.05% | 3,814 |
| Moore | 55.74% | 14,760 | 37.19% | 9,847 | 6.65% | 1,761 | 0.23% | 61 | 0.19% | 50 | 18.55% | 4,913 |
| Graham | 54.76% | 1,801 | 36.79% | 1,210 | 8.21% | 270 | 0.12% | 4 | 0.12% | 4 | 17.97% | 591 |
| Lincoln | 54.86% | 11,439 | 37.03% | 7,721 | 7.76% | 1,619 | 0.21% | 43 | 0.13% | 28 | 17.83% | 3,718 |
| Wayne | 56.44% | 16,588 | 39.40% | 11,580 | 4.01% | 1,178 | 0.10% | 30 | 0.05% | 14 | 17.04% | 5,008 |
| Alamance | 53.66% | 22,461 | 37.78% | 15,814 | 8.11% | 3,395 | 0.35% | 145 | 0.11% | 46 | 15.88% | 6,647 |
| McDowell | 52.18% | 6,407 | 37.08% | 4,553 | 10.38% | 1,275 | 0.21% | 26 | 0.14% | 17 | 15.10% | 1,854 |
| Nash | 54.17% | 15,309 | 39.42% | 11,142 | 6.20% | 1,751 | 0.18% | 51 | 0.03% | 9 | 14.74% | 4,167 |
| Transylvania | 52.29% | 6,734 | 37.60% | 4,842 | 9.19% | 1,183 | 0.42% | 54 | 0.50% | 64 | 14.69% | 1,892 |
| Rutherford | 52.73% | 9,792 | 38.57% | 7,162 | 8.53% | 1,585 | 0.11% | 21 | 0.06% | 11 | 14.16% | 2,630 |
| Ashe | 52.33% | 5,203 | 38.47% | 3,825 | 8.70% | 865 | 0.29% | 29 | 0.20% | 20 | 13.86% | 1,378 |
| Beaufort | 53.59% | 8,154 | 40.57% | 6,172 | 5.48% | 834 | 0.23% | 35 | 0.13% | 20 | 13.03% | 1,982 |
| Harnett | 53.34% | 11,596 | 40.33% | 8,767 | 5.92% | 1,287 | 0.15% | 33 | 0.26% | 56 | 13.01% | 2,829 |
| Polk | 52.04% | 3,516 | 40.02% | 2,704 | 7.30% | 493 | 0.44% | 30 | 0.19% | 13 | 12.02% | 812 |
| Craven | 52.65% | 13,264 | 40.96% | 10,317 | 6.07% | 1,528 | 0.26% | 66 | 0.06% | 16 | 11.70% | 2,947 |
| Forsyth | 52.81% | 59,160 | 41.54% | 46,543 | 5.13% | 5,747 | 0.37% | 409 | 0.16% | 174 | 11.26% | 12,617 |
| Macon | 49.34% | 5,267 | 39.43% | 4,209 | 10.50% | 1,121 | 0.41% | 44 | 0.32% | 34 | 9.91% | 1,058 |
| Cherokee | 49.26% | 3,883 | 39.69% | 3,129 | 9.96% | 785 | 0.42% | 33 | 0.67% | 53 | 9.56% | 754 |
| New Hanover | 50.92% | 27,889 | 41.70% | 22,839 | 6.60% | 3,615 | 0.59% | 322 | 0.19% | 104 | 9.22% | 5,050 |
| Greene | 51.73% | 2,689 | 42.79% | 2,224 | 5.39% | 280 | 0.04% | 2 | 0.06% | 3 | 8.95% | 465 |
| Clay | 48.40% | 1,769 | 40.00% | 1,462 | 10.59% | 387 | 0.85% | 31 | 0.16% | 6 | 8.40% | 307 |
| Burke | 48.97% | 13,853 | 41.28% | 11,678 | 9.38% | 2,654 | 0.27% | 76 | 0.11% | 30 | 7.69% | 2,175 |
| Rockingham | 49.22% | 14,255 | 41.77% | 12,096 | 8.73% | 2,528 | 0.12% | 36 | 0.15% | 44 | 7.46% | 2,159 |
| Lee | 50.04% | 7,321 | 42.99% | 6,290 | 6.70% | 980 | 0.19% | 28 | 0.08% | 11 | 7.05% | 1,031 |
| Currituck | 45.51% | 2,569 | 40.34% | 2,277 | 13.64% | 770 | 0.43% | 24 | 0.09% | 5 | 5.17% | 292 |
| Watauga | 47.30% | 8,146 | 42.67% | 7,349 | 8.22% | 1,415 | 0.81% | 139 | 1.00% | 173 | 4.63% | 797 |
| Lenoir | 49.84% | 9,433 | 45.63% | 8,635 | 4.34% | 822 | 0.12% | 23 | 0.06% | 12 | 4.22% | 798 |
| Dare | 46.00% | 4,977 | 41.79% | 4,522 | 11.63% | 1,258 | 0.30% | 33 | 0.28% | 30 | 4.21% | 455 |
| Wilson | 49.03% | 10,518 | 45.59% | 9,779 | 5.13% | 1,100 | 0.14% | 31 | 0.11% | 23 | 3.45% | 739 |
| Person | 48.68% | 4,883 | 45.26% | 4,540 | 5.89% | 591 | 0.13% | 13 | 0.03% | 3 | 3.42% | 343 |
| Alleghany | 45.71% | 1,936 | 42.53% | 1,801 | 10.81% | 458 | 0.76% | 32 | 0.19% | 8 | 3.19% | 135 |
| Cleveland | 47.71% | 13,474 | 45.07% | 12,728 | 6.84% | 1,931 | 0.25% | 71 | 0.13% | 37 | 2.64% | 746 |
| Wake | 48.18% | 108,780 | 45.88% | 103,574 | 5.23% | 11,811 | 0.43% | 979 | 0.27% | 611 | 2.31% | 5,206 |
| Pitt | 47.95% | 18,227 | 46.18% | 17,555 | 5.36% | 2,037 | 0.24% | 90 | 0.27% | 102 | 1.77% | 672 |
| Pamlico | 47.39% | 2,270 | 46.01% | 2,204 | 6.20% | 297 | 0.33% | 16 | 0.06% | 3 | 1.38% | 66 |
| Pender | 46.38% | 5,538 | 45.30% | 5,409 | 7.91% | 945 | 0.25% | 30 | 0.15% | 18 | 1.08% | 129 |
| Sampson | 47.82% | 8,241 | 47.30% | 8,150 | 4.79% | 825 | 0.07% | 12 | 0.02% | 4 | 0.53% | 91 |
| Yancey | 45.75% | 3,973 | 45.56% | 3,956 | 8.29% | 720 | 0.21% | 18 | 0.20% | 17 | 0.20% | 17 |
| Brunswick | 45.70% | 10,065 | 45.59% | 10,041 | 8.24% | 1,815 | 0.34% | 75 | 0.12% | 27 | 0.11% | 24 |
| Guilford | 45.89% | 67,727 | 46.89% | 69,208 | 6.60% | 9,739 | 0.41% | 605 | 0.21% | 308 | -1.00% | -1,481 |
| Buncombe | 44.19% | 30,518 | 45.84% | 31,658 | 9.05% | 6,254 | 0.49% | 335 | 0.44% | 302 | -1.65% | -1,140 |
| Mecklenburg | 45.91% | 97,719 | 48.59% | 103,429 | 4.92% | 10,473 | 0.36% | 772 | 0.21% | 452 | -2.68% | -5,710 |
| Madison | 44.24% | 3,110 | 47.41% | 3,333 | 7.65% | 538 | 0.23% | 16 | 0.47% | 33 | -3.17% | -223 |
| Jones | 45.28% | 1,682 | 49.23% | 1,829 | 5.30% | 197 | 0.13% | 5 | 0.05% | 2 | -3.96% | -147 |
| Camden | 41.86% | 1,074 | 46.22% | 1,186 | 11.42% | 293 | 0.27% | 7 | 0.23% | 6 | -4.36% | -112 |
| Cumberland | 44.83% | 29,804 | 49.25% | 32,739 | 5.68% | 3,776 | 0.17% | 114 | 0.07% | 46 | -4.41% | -2,935 |
| Duplin | 43.83% | 5,432 | 49.86% | 6,179 | 6.18% | 766 | 0.11% | 14 | 0.01% | 1 | -6.03% | -747 |
| Montgomery | 43.11% | 3,379 | 49.20% | 3,856 | 7.49% | 587 | 0.10% | 8 | 0.10% | 8 | -6.09% | -477 |
| Franklin | 43.36% | 5,648 | 49.50% | 6,448 | 6.84% | 891 | 0.22% | 29 | 0.08% | 10 | -6.14% | -800 |
| Haywood | 39.84% | 7,995 | 46.59% | 9,350 | 12.93% | 2,594 | 0.38% | 77 | 0.26% | 53 | -6.75% | -1,355 |
| Chatham | 42.03% | 7,731 | 50.84% | 9,353 | 6.05% | 1,113 | 0.56% | 103 | 0.52% | 96 | -8.82% | -1,622 |
| Jackson | 40.40% | 4,244 | 49.60% | 5,211 | 9.23% | 970 | 0.49% | 51 | 0.29% | 30 | -9.20% | -967 |
| Granville | 42.95% | 5,498 | 52.71% | 6,747 | 3.38% | 432 | 0.86% | 110 | 0.10% | 13 | -9.76% | -1,249 |
| Martin | 41.98% | 3,590 | 52.62% | 4,500 | 5.20% | 445 | 0.18% | 15 | 0.02% | 2 | -10.64% | -910 |
| Swain | 38.80% | 1,444 | 50.21% | 1,869 | 10.77% | 401 | 0.16% | 6 | 0.05% | 2 | -11.42% | -425 |
| Caswell | 40.57% | 3,310 | 52.86% | 4,312 | 6.25% | 510 | 0.20% | 16 | 0.12% | 10 | -12.28% | -1,002 |
| Perquimans | 38.88% | 1,561 | 51.53% | 2,069 | 9.19% | 369 | 0.30% | 12 | 0.10% | 4 | -12.65% | -508 |
| Chowan | 38.80% | 1,659 | 52.36% | 2,239 | 8.40% | 359 | 0.33% | 14 | 0.12% | 5 | -13.56% | -580 |
| Vance | 39.97% | 4,651 | 54.88% | 6,385 | 4.94% | 575 | 0.15% | 17 | 0.06% | 7 | -14.90% | -1,734 |
| Pasquotank | 38.34% | 2,999 | 54.12% | 4,233 | 7.22% | 565 | 0.20% | 16 | 0.12% | 9 | -15.78% | -1,234 |
| Hyde | 38.30% | 782 | 54.31% | 1,109 | 7.00% | 143 | 0.29% | 6 | 0.10% | 2 | -16.01% | -327 |
| Bladen | 37.22% | 3,335 | 55.27% | 4,952 | 7.31% | 655 | 0.11% | 10 | 0.09% | 8 | -18.05% | -1,617 |
| Columbus | 36.96% | 6,017 | 55.40% | 9,019 | 7.19% | 1,170 | 0.42% | 69 | 0.03% | 5 | -18.44% | -3,002 |
| Halifax | 35.40% | 5,700 | 59.31% | 9,551 | 5.07% | 816 | 0.15% | 24 | 0.07% | 12 | -23.91% | -3,851 |
| Scotland | 34.44% | 2,858 | 58.68% | 4,870 | 6.60% | 548 | 0.13% | 11 | 0.14% | 12 | -24.24% | -2,012 |
| Edgecombe | 34.78% | 6,010 | 61.16% | 10,568 | 3.82% | 660 | 0.18% | 31 | 0.05% | 9 | -26.38% | -4,558 |
| Durham | 34.39% | 27,825 | 60.79% | 49,186 | 3.86% | 3,122 | 0.41% | 332 | 0.55% | 445 | -26.40% | -21,361 |
| Hoke | 32.28% | 1,914 | 59.20% | 3,510 | 8.11% | 481 | 0.24% | 14 | 0.17% | 10 | -26.92% | -1,596 |
| Washington | 34.47% | 1,562 | 61.56% | 2,790 | 3.77% | 171 | 0.15% | 7 | 0.04% | 2 | -27.10% | -1,228 |
| Tyrrell | 32.25% | 488 | 60.01% | 908 | 7.40% | 112 | 0.26% | 4 | 0.07% | 1 | -27.76% | -420 |
| Richmond | 31.04% | 3,973 | 59.09% | 7,564 | 9.61% | 1,230 | 0.12% | 16 | 0.14% | 18 | -28.05% | -3,591 |
| Orange | 32.19% | 15,053 | 61.32% | 28,674 | 3.28% | 1,534 | 1.94% | 906 | 1.28% | 598 | -29.13% | -13,621 |
| Gates | 30.27% | 1,072 | 60.84% | 2,155 | 8.67% | 307 | 0.17% | 6 | 0.06% | 2 | -30.58% | -1,083 |
| Robeson | 29.53% | 8,146 | 62.95% | 17,361 | 7.31% | 2,015 | 0.15% | 40 | 0.07% | 19 | -33.41% | -9,215 |
| Anson | 28.77% | 2,193 | 64.15% | 4,890 | 6.72% | 512 | 0.26% | 20 | 0.10% | 8 | -35.38% | -2,697 |
| Warren | 29.36% | 1,861 | 65.33% | 4,141 | 5.03% | 319 | 0.16% | 10 | 0.13% | 8 | -35.97% | -2,280 |
| Bertie | 27.83% | 1,745 | 67.01% | 4,202 | 5.04% | 316 | 0.10% | 6 | 0.03% | 2 | -39.18% | -2,457 |
| Hertford | 25.86% | 1,823 | 68.89% | 4,856 | 5.05% | 356 | 0.10% | 7 | 0.10% | 7 | -43.03% | -3,033 |
| Northampton | 25.08% | 1,881 | 69.44% | 5,207 | 5.36% | 402 | 0.11% | 8 | 0.01% | 1 | -44.35% | -3,326 |
Electors
Technically the voters of North Carolina cast their ballots for electors: representatives to the Electoral College. North Carolina was allocated 14 electors because it had 12 congressional districts and 2 senators. All candidates that appear on the ballot or qualify to receive write-in votes must submit a list of 14 electors, who pledge to vote for their candidate and his or her running mate. Whoever wins the majority of votes in the state is awarded all 14 electoral votes. Their chosen electors then vote for president and vice president. Although electors are pledged to their candidate and running mate, they are not obligated to vote for them. An elector who votes for someone other than his or her candidate is known as a faithless elector.
The following were the members of the Electoral College from the state. All were pledged to and voted for Bob Dole and Jack Kemp:[3]
- Howard B. Smith
- Bettie West
- J.D. Teachey
- Nelson Dollar
- Lee Q. McMillan
- Carolyn McGee
- Jim Cole
- Tom Dwiggins
- John Van Hanford
- Gary Whitener
- George Alexander Jones
- Quentine Finch
- Bill Graham
- Dorothy Bursey
References
- Sullivan, Robert David; ‘How the Red and Blue Map Evolved Over the Past Century’; America Magazine in The National Catholic Review; June 29, 2016
- Our Campaigns; NC US President Race, November 05, 1996
- "List of States, Electoral Votes and electors". National Archives and Records Administration. Retrieved 7 January 2010.