2016 United States presidential election in North Carolina
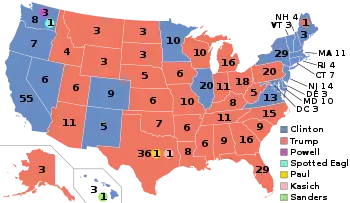
The 2016 United States presidential election in North Carolina held on Tuesday, November 8, 2016, as part of the 2016 United States presidential election in which all 50 states plus the District of Columbia participated. North Carolina voters chose electors to represent them in the Electoral College via a popular vote, pitting the Republican Party's nominee, businessman Donald Trump, and running mate Indiana Governor Mike Pence against Democratic Party nominee, former Secretary of State Hillary Clinton, and her running mate Virginia Senator Tim Kaine. North Carolina has 15 electoral votes in the Electoral College.[1]
| ||||||||||||||||||||||||||
| Turnout | 68.98% | |||||||||||||||||||||||||
|---|---|---|---|---|---|---|---|---|---|---|---|---|---|---|---|---|---|---|---|---|---|---|---|---|---|---|
| ||||||||||||||||||||||||||
 County Results
| ||||||||||||||||||||||||||
| ||||||||||||||||||||||||||
.jpg.webp)


| Elections in North Carolina |
|---|
 |
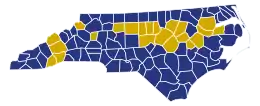
Trump won the state with 49.83% of the vote, a small decrease from Mitt Romney's vote percentage in 2012. Clinton obtained 46.17% of the vote, a decrease of over 2% in 2012 when Obama won 48.35% of the vote. Trump won by a margin of 3.66%, an increase of 1.62% compared to Romney's margin in 2012. Although both candidates saw decreases in vote share compared to 2012, Trump and Clinton both obtained more votes than the previous election's candidates due to a higher voter turnout in this election. Trump flipped seven counties to Republican and was the first Republican to win Robeson, Richmond, and Gates Counties since Richard Nixon in 1972. Clinton flipped just one county to Democratic, Watauga County, home to Boone.
Trump also became the first Republican to win the White House without carrying Forsyth County since Calvin Coolidge in 1924. It is also the first time since 1980 that North Carolina voted more Democratic than Ohio.
Primary elections
The Democratic, Republican, and Libertarian primaries were on March 15, 2016. In North Carolina, registered members of each party only voted in their party's primary, while voters who were unaffiliated chose any one primary in which to vote.
Democratic primary

Four candidates appeared on the Democratic presidential primary ballot:[2][3]
Polling
According to a WRAL-TV/SurveyUSA poll conducted the week before the primary: "[Hillary] Clinton holds a commanding lead of 57% to 34% among likely Democratic voters over U.S. Sen. Bernie Sanders of Vermont." [4]
Results
| Party | Candidate | Votes | % | |
|---|---|---|---|---|
| Democratic | Hillary Clinton | 616,758 | 54.59% | |
| Democratic | Bernie Sanders | 460,434 | 40.75% | |
| Democratic | No Preference | 37,200 | 3.29% | |
| Democratic | Others (total) | 15,375 | 1.37% | |
| Total votes | 1,129,767 | 100.00% | ||
Republican primary
Twelve candidates appeared on the Republican presidential primary ballot:[2][3][6]
- Jeb Bush (withdrawn)
- Ben Carson (withdrawn)
- Chris Christie (withdrawn)
- Ted Cruz
- Carly Fiorina (withdrawn)
- Jim Gilmore (withdrawn)
- Mike Huckabee (withdrawn)
- John Kasich
- Rand Paul (withdrawn)
- Marco Rubio
- Rick Santorum (withdrawn)
- Donald Trump
Polling
According to a WRAL-TV/SurveyUSA poll conducted the week before the primary: "[Donald] Trump tops U.S. Sen. Ted Cruz of Texas 41% to 27% among likely GOP voters. U.S. Sen. Marco Rubio of Florida and Ohio Gov. John Kasich trail far behind, at 14% and 11%, respectively." [4]
Results
| North Carolina Republican primary, March 15, 2016 | |||||
|---|---|---|---|---|---|
| Candidate | Votes | Percentage | Actual delegate count | ||
| Bound | Unbound | Total | |||
| Donald Trump | 462,413 | 40.23% | 29 | 0 | 29 |
| Ted Cruz | 422,621 | 36.76% | 27 | 0 | 27 |
| John Kasich | 145,659 | 12.67% | 9 | 0 | 9 |
| Marco Rubio | 88,907 | 7.73% | 6 | 0 | 6 |
| Ben Carson (withdrawn) | 11,019 | 0.96% | 1 | 0 | 1 |
| No Preference | 6,081 | 0.53% | 0 | 0 | 0 |
| Jeb Bush (withdrawn) | 3,893 | 0.34% | 0 | 0 | 0 |
| Mike Huckabee (withdrawn) | 3,071 | 0.27% | 0 | 0 | 0 |
| Rand Paul (withdrawn) | 2,753 | 0.24% | 0 | 0 | 0 |
| Chris Christie (withdrawn) | 1,256 | 0.11% | 0 | 0 | 0 |
| Carly Fiorina (withdrawn) | 929 | 0.08% | 0 | 0 | 0 |
| Rick Santorum (withdrawn) | 663 | 0.06% | 0 | 0 | 0 |
| Jim Gilmore (withdrawn) | 265 | 0.02% | 0 | 0 | 0 |
| Unprojected delegates: | 0 | 0 | 0 | ||
| Total: | 1,149,530 | 100.00% | 72 | 0 | 72 |
| Source: The Green Papers | |||||
Trump managed to pull off a closer than expected win due to both Cruz and his campaigns performances in different metropolitan areas. Trump was strongest in the Charlotte, Fayetteville and Wilmington areas. Cruz did best in Greensboro, Asheville and the Research Triangle region, where North Carolina's major colleges and capitol of Raleigh are located.[7]
Libertarian primary
| |||||||||||||||||||||||||||||||||||
| |||||||||||||||||||||||||||||||||||
 North Carolina results by county
Gary Johnson
No Preference
Tie | |||||||||||||||||||||||||||||||||||

Eleven candidates appeared on the Libertarian presidential primary ballot:[2][3]
- John David Hale
- Cecil Ince
- Gary Johnson
- Steve Kerbel
- Darryl W. Perry
- Austin Petersen
- Derrick Michael Reid
- Jack Robinson, Jr.
- Rhett Smith
- Joy Waymire
- Marc Allan Feldman
Results
| North Carolina Libertarian presidential primary, March 15, 2016[8] | ||
|---|---|---|
| Candidate | Votes | Percentage |
| Gary Johnson | 2,414 | 41.48% |
| No Preference | 2,067 | 35.52% |
| John David Hale | 329 | 5.65% |
| Joy Waymire | 268 | 4.61% |
| Austin Petersen | 189 | 3.25% |
| Darryl Perry | 118 | 2.03% |
| Steve Kerbel | 109 | 1.87% |
| Derrick Michael Reid | 74 | 1.27% |
| Cecil Ince | 72 | 1% |
| Jack Robinson, Jr. | 70 | 1.20% |
| Marc Allan Feldman | 66 | 1.13% |
| Rhett Smith | 43 | 0.74% |
| Total | 5,739 | 100% |
General election
Predictions
| Source | Ranking | As of |
|---|---|---|
| CNN[9] | Tossup | November 4, 2016 |
| Cook Political Report[10] | Tossup | November 7, 2016 |
| Electoral-vote.com[11] | Lean D (flip) | November 8, 2016 |
| NBC[12] | Tossup | November 7, 2016 |
| RealClearPolitics[13] | Tossup | November 8, 2016 |
| Sabato's Crystal Ball[14] | Lean D (flip) | November 7, 2016 |
Polling
Up until the summer of 2016, both Democrat Hillary Clinton and Republican Donald Trump were each winning polls, with Trump leading slightly. From late June 2016 to mid September 2016, Clinton gained momentum and had won most polls conducted in the summer. From mid September 2016 to late October, Clinton's momentum increased as she won every poll but one. The latest polls showed a near tie, with both almost evenly matched. The average of the final 3 polls showed Clinton ahead 46% to 45%.[15] Interestingly, while she had a head to head lead in the last polls against Trump, polls with Gary Johnson showed the race a lot closer. The last New York Times poll conducted showed Trump and Clinton tied with 44% for each. [16]
Candidates
In addition to Clinton, Johnson and Trump, Green Party nominee Jill Stein was granted write-in status by the North Carolina State Board of Elections, the only write-in candidate to qualify.[17][18]
Results
| Candidate | Popular vote | Percentage |
|---|---|---|
| Donald Trump | 2,362,631 | 49.83% |
| Hillary Clinton | 2,189,316 | 46.17% |
| Gary Johnson | 130,126 | 2.74% |
| Write-in | 47,386 | 1.00% |
| Jill Stein (write-in) | 12,105 | 0.26% |
| Total | 4,741,564 | 100.00% |
| Source: North Carolina State Board of Elections The Green Papers | ||
By county
| County[19] | Clinton percentage | Clinton Votes | Trump percentage | Trump Votes | Johnson percentage | Johnson Votes | Write-in percentage | Write-in Votes | Stein percentage | Stein Votes | Totals |
|---|---|---|---|---|---|---|---|---|---|---|---|
| Alamance | 41.93% | 29,833 | 54.55% | 38,815 | 2.52% | 1,795 | 0.70% | 498 | 0.30% | 216 | 71,157 |
| Alexander | 20.62% | 3,767 | 76.04% | 13,893 | 2.39% | 437 | 0.83% | 151 | 0.13% | 23 | 18,271 |
| Alleghany | 24.57% | 1,306 | 71.76% | 3,814 | 2.43% | 129 | 1.24% | 66 | 0.00% | 0 | 5,315 |
| Anson | 55.56% | 5,859 | 42.73% | 4,506 | 1.22% | 129 | 0.46% | 48 | 0.03% | 3 | 10,545 |
| Ashe | 26.07% | 3,500 | 70.11% | 9,412 | 2.47% | 332 | 1.34% | 180 | 0.00% | 0 | 13,424 |
| Avery | 20.48% | 1,689 | 76.35% | 6,298 | 2.01% | 166 | 0.88% | 73 | 0.28% | 23 | 8,249 |
| Beaufort | 36.61% | 8,764 | 60.75% | 14,543 | 1.78% | 426 | 0.75% | 180 | 0.10% | 25 | 23,938 |
| Bertie | 61.82% | 5,778 | 36.97% | 3,456 | 0.75% | 70 | 0.43% | 40 | 0.03% | 3 | 9,347 |
| Bladen | 44.40% | 7,058 | 53.78% | 8,550 | 1.33% | 212 | 0.42% | 66 | 0.07% | 11 | 15,897 |
| Brunswick | 34.06% | 23,282 | 62.50% | 42,720 | 2.51% | 1,717 | 0.78% | 536 | 0.14% | 96 | 68,351 |
| Buncombe | 54.30% | 75,452 | 40.10% | 55,716 | 3.08% | 4,285 | 1.41% | 1,959 | 1.10% | 1,535 | 138,947 |
| Burke | 28.91% | 11,251 | 67.42% | 26,238 | 2.54% | 988 | 0.83% | 324 | 0.31% | 119 | 38,920 |
| Cabarrus | 38.08% | 35,521 | 57.69% | 53,819 | 2.99% | 2,786 | 1.04% | 973 | 0.20% | 190 | 93,289 |
| Caldwell | 23.20% | 8,425 | 73.30% | 26,621 | 2.34% | 849 | 0.83% | 302 | 0.34% | 123 | 36,320 |
| Camden | 25.45% | 1,274 | 70.83% | 3,546 | 2.98% | 149 | 0.58% | 29 | 0.16% | 8 | 5,006 |
| Carteret | 26.31% | 9,939 | 70.32% | 26,569 | 2.42% | 913 | 0.74% | 278 | 0.22% | 82 | 37,781 |
| Caswell | 43.29% | 4,792 | 54.44% | 6,026 | 1.93% | 214 | 0.26% | 29 | 0.08% | 9 | 11,070 |
| Catawba | 29.32% | 21,216 | 66.79% | 48,324 | 2.73% | 1,973 | 0.95% | 685 | 0.21% | 153 | 72,351 |
| Chatham | 52.86% | 21,065 | 42.92% | 17,105 | 2.84% | 1,130 | 1.03% | 412 | 0.34% | 137 | 39,849 |
| Cherokee | 20.17% | 2,860 | 76.47% | 10,844 | 2.44% | 346 | 0.69% | 98 | 0.23% | 33 | 14,181 |
| Chowan | 41.39% | 2,992 | 55.53% | 4,014 | 2.24% | 162 | 0.68% | 49 | 0.15% | 11 | 7,228 |
| Clay | 22.75% | 1,367 | 73.83% | 4,437 | 2.38% | 143 | 0.90% | 54 | 0.15% | 9 | 6,010 |
| Cleveland | 33.50% | 14,964 | 63.75% | 28,479 | 1.90% | 850 | 0.68% | 305 | 0.17% | 75 | 44,673 |
| Columbus | 38.19% | 9,063 | 60.14% | 14,272 | 1.29% | 306 | 0.38% | 91 | 0.00% | 0 | 23,732 |
| Craven | 37.51% | 17,630 | 59.00% | 27,731 | 2.57% | 1,210 | 0.81% | 380 | 0.11% | 50 | 47,001 |
| Cumberland | 56.16% | 71,605 | 40.21% | 51,265 | 2.65% | 3,373 | 0.85% | 1,084 | 0.14% | 179 | 127,506 |
| Currituck | 22.99% | 2,913 | 72.33% | 9,163 | 3.80% | 482 | 0.66% | 84 | 0.21% | 27 | 12,669 |
| Dare | 36.83% | 7,222 | 58.44% | 11,460 | 3.44% | 674 | 1.03% | 201 | 0.27% | 52 | 19,609 |
| Davidson | 24.19% | 18,109 | 72.56% | 54,317 | 2.48% | 1,859 | 0.65% | 484 | 0.12% | 87 | 74,856 |
| Davie | 24.22% | 5,270 | 71.71% | 15,602 | 2.90% | 631 | 0.95% | 206 | 0.22% | 47 | 21,756 |
| Duplin | 39.72% | 8,283 | 58.58% | 12,217 | 1.25% | 260 | 0.41% | 85 | 0.05% | 11 | 20,856 |
| Durham | 77.66% | 121,250 | 18.16% | 28,350 | 2.56% | 3,999 | 1.28% | 2,000 | 0.34% | 535 | 156,134 |
| Edgecombe | 65.19% | 16,224 | 33.20% | 8,261 | 1.14% | 284 | 0.43% | 106 | 0.04% | 11 | 24,886 |
| Forsyth | 52.98% | 94,464 | 42.61% | 75,975 | 3.01% | 5,370 | 1.15% | 2,054 | 0.25% | 449 | 178,312 |
| Franklin | 42.39% | 12,874 | 53.90% | 16,368 | 2.56% | 777 | 0.97% | 296 | 0.17% | 53 | 30,368 |
| Gaston | 32.33% | 31,177 | 64.09% | 61,798 | 2.54% | 2,445 | 0.91% | 873 | 0.14% | 138 | 96,431 |
| Gates | 44.23% | 2,385 | 53.30% | 2,874 | 2.00% | 108 | 0.46% | 25 | 0.00% | 0 | 5,392 |
| Graham | 18.43% | 768 | 78.77% | 3,283 | 1.78% | 74 | 1.03% | 43 | 0.00% | 0 | 4,168 |
| Granville | 47.19% | 12,909 | 49.69% | 13,591 | 2.18% | 596 | 0.79% | 215 | 0.15% | 42 | 27,353 |
| Greene | 44.53% | 3,605 | 54.03% | 4,374 | 1.05% | 85 | 0.33% | 27 | 0.05% | 4 | 8,095 |
| Guilford | 57.98% | 149,248 | 38.10% | 98,062 | 2.62% | 6,754 | 1.04% | 2,667 | 0.26% | 674 | 257,405 |
| Halifax | 62.57% | 15,748 | 35.88% | 9,031 | 1.15% | 290 | 0.39% | 98 | 0.00% | 0 | 25,167 |
| Harnett | 36.33% | 16,737 | 59.95% | 27,614 | 2.72% | 1,252 | 0.84% | 389 | 0.16% | 73 | 46,065 |
| Haywood | 34.08% | 10,473 | 61.60% | 18,929 | 2.95% | 905 | 0.99% | 303 | 0.38% | 117 | 30,727 |
| Henderson | 34.08% | 19,827 | 61.55% | 35,809 | 2.79% | 1,626 | 1.18% | 687 | 0.39% | 227 | 58,176 |
| Hertford | 67.84% | 6,910 | 30.42% | 3,099 | 1.31% | 133 | 0.43% | 44 | 0.00% | 0 | 10,186 |
| Hoke | 53.35% | 9,726 | 42.57% | 7,760 | 3.17% | 577 | 0.77% | 140 | 0.15% | 27 | 18,230 |
| Hyde | 41.88% | 965 | 55.90% | 1,288 | 1.82% | 42 | 0.35% | 8 | 0.04% | 1 | 2,304 |
| Iredell | 29.96% | 24,734 | 66.31% | 54,754 | 2.65% | 2,185 | 0.91% | 754 | 0.17% | 140 | 82,567 |
| Jackson | 41.22% | 7,713 | 52.74% | 9,870 | 3.97% | 742 | 1.47% | 276 | 0.60% | 112 | 18,713 |
| Johnston | 33.01% | 28,362 | 63.29% | 54,372 | 2.73% | 2,347 | 0.83% | 716 | 0.13% | 112 | 85,909 |
| Jones | 40.21% | 2,065 | 57.92% | 2,974 | 1.15% | 59 | 0.72% | 37 | 0.00% | 0 | 5,135 |
| Lee | 41.74% | 10,469 | 54.66% | 13,712 | 2.73% | 684 | 0.76% | 191 | 0.11% | 28 | 25,084 |
| Lenoir | 47.13% | 12,634 | 50.78% | 13,613 | 1.48% | 398 | 0.53% | 143 | 0.07% | 19 | 26,807 |
| Lincoln | 24.73% | 9,897 | 71.97% | 28,806 | 2.43% | 971 | 0.76% | 305 | 0.11% | 44 | 40,023 |
| Macon | 27.50% | 4,876 | 68.38% | 12,127 | 2.63% | 467 | 1.29% | 228 | 0.20% | 36 | 17,734 |
| Madison | 34.84% | 3,926 | 60.19% | 6,783 | 2.98% | 336 | 0.91% | 103 | 1.07% | 121 | 11,269 |
| Martin | 48.86% | 5,846 | 49.29% | 5,897 | 1.38% | 165 | 0.39% | 47 | 0.08% | 9 | 11,964 |
| McDowell | 23.48% | 4,667 | 73.30% | 14,568 | 1.99% | 396 | 1.15% | 229 | 0.08% | 15 | 19,875 |
| Mecklenburg | 62.29% | 294,562 | 32.89% | 155,518 | 3.28% | 15,488 | 1.26% | 5,937 | 0.29% | 1,352 | 472,857 |
| Mitchell | 19.71% | 1,596 | 77.59% | 6,282 | 1.70% | 138 | 0.69% | 56 | 0.30% | 24 | 8,096 |
| Montgomery | 35.96% | 4,150 | 61.79% | 7,130 | 1.76% | 203 | 0.44% | 51 | 0.05% | 6 | 11,540 |
| Moore | 33.54% | 16,329 | 62.62% | 30,490 | 2.78% | 1,355 | 0.95% | 464 | 0.11% | 54 | 48,692 |
| Nash | 48.75% | 23,235 | 48.92% | 23,319 | 1.57% | 750 | 0.63% | 301 | 0.13% | 60 | 47,665 |
| New Hanover | 45.56% | 50,979 | 49.46% | 55,344 | 3.53% | 3,949 | 1.06% | 1,184 | 0.40% | 449 | 111,905 |
| Northampton | 62.39% | 6,144 | 36.37% | 3,582 | 0.94% | 93 | 0.29% | 29 | 0.00% | 0 | 9,848 |
| Onslow | 30.65% | 17,514 | 64.97% | 37,122 | 3.37% | 1,926 | 0.84% | 481 | 0.16% | 92 | 57,135 |
| Orange | 72.78% | 59,923 | 22.54% | 18,557 | 2.92% | 2,404 | 1.21% | 997 | 0.56% | 459 | 82,340 |
| Pamlico | 35.63% | 2,448 | 61.98% | 4,258 | 1.80% | 124 | 0.44% | 30 | 0.15% | 10 | 6,870 |
| Pasquotank | 49.54% | 8,615 | 47.04% | 8,180 | 2.54% | 442 | 0.70% | 122 | 0.18% | 32 | 17,391 |
| Pender | 33.54% | 9,354 | 63.26% | 17,639 | 2.45% | 683 | 0.56% | 157 | 0.19% | 52 | 27,885 |
| Perquimans | 34.57% | 2,319 | 62.27% | 4,177 | 2.42% | 162 | 0.64% | 43 | 0.10% | 7 | 6,708 |
| Person | 39.93% | 7,833 | 57.02% | 11,185 | 2.14% | 419 | 0.72% | 142 | 0.18% | 36 | 19,615 |
| Pitt | 51.94% | 41,824 | 44.32% | 35,691 | 2.68% | 2,162 | 0.84% | 680 | 0.21% | 170 | 80,527 |
| Polk | 34.16% | 3,735 | 61.90% | 6,768 | 2.49% | 272 | 0.98% | 107 | 0.48% | 52 | 10,934 |
| Randolph | 20.43% | 13,194 | 76.55% | 49,430 | 2.17% | 1,403 | 0.69% | 446 | 0.16% | 102 | 64,575 |
| Richmond | 43.98% | 8,501 | 53.72% | 10,383 | 1.72% | 333 | 0.45% | 87 | 0.12% | 24 | 19,328 |
| Robeson | 46.54% | 19,016 | 50.82% | 20,762 | 1.97% | 803 | 0.62% | 252 | 0.06% | 25 | 40,858 |
| Rockingham | 33.65% | 14,228 | 63.46% | 26,830 | 2.06% | 871 | 0.70% | 294 | 0.13% | 55 | 42,278 |
| Rowan | 30.14% | 19,400 | 66.51% | 42,810 | 2.36% | 1,517 | 0.88% | 564 | 0.12% | 78 | 64,369 |
| Rutherford | 24.79% | 7,512 | 72.16% | 21,871 | 2.06% | 624 | 0.86% | 261 | 0.13% | 39 | 30,307 |
| Sampson | 40.68% | 10,547 | 57.23% | 14,838 | 1.52% | 393 | 0.58% | 150 | 0.00% | 0 | 25,928 |
| Scotland | 52.55% | 7,319 | 44.92% | 6,256 | 1.82% | 254 | 0.52% | 73 | 0.19% | 26 | 13,928 |
| Stanly | 23.71% | 7,094 | 73.42% | 21,964 | 2.22% | 664 | 0.56% | 169 | 0.09% | 26 | 29,917 |
| Stokes | 20.69% | 4,665 | 75.90% | 17,116 | 2.53% | 571 | 0.77% | 173 | 0.11% | 25 | 22,550 |
| Surry | 23.26% | 7,488 | 73.52% | 23,671 | 2.30% | 739 | 0.78% | 250 | 0.15% | 48 | 32,196 |
| Swain | 35.86% | 2,196 | 58.21% | 3,565 | 3.92% | 240 | 1.53% | 94 | 0.47% | 29 | 6,124 |
| Transylvania | 36.70% | 6,558 | 58.87% | 10,520 | 2.74% | 489 | 1.23% | 220 | 0.46% | 82 | 17,869 |
| Tyrrell | 41.40% | 720 | 56.07% | 975 | 1.61% | 28 | 0.63% | 11 | 0.29% | 5 | 1,739 |
| Union | 32.48% | 34,337 | 63.10% | 66,707 | 3.15% | 3,327 | 1.11% | 1,176 | 0.15% | 163 | 105,710 |
| Vance | 61.22% | 12,229 | 36.70% | 7,332 | 1.47% | 294 | 0.49% | 97 | 0.13% | 25 | 19,977 |
| Wake | 57.38% | 302,736 | 37.16% | 196,082 | 3.69% | 19,460 | 1.44% | 7,606 | 0.33% | 1,740 | 527,624 |
| Warren | 65.16% | 6,413 | 32.66% | 3,214 | 1.48% | 146 | 0.70% | 69 | 0.00% | 0 | 9,842 |
| Washington | 56.93% | 3,510 | 41.59% | 2,564 | 1.05% | 65 | 0.41% | 25 | 0.02% | 1 | 6,165 |
| Watauga | 47.15% | 14,138 | 45.68% | 13,697 | 4.46% | 1,336 | 1.80% | 539 | 0.92% | 275 | 29,985 |
| Wayne | 42.95% | 21,770 | 54.33% | 27,540 | 1.90% | 963 | 0.76% | 383 | 0.07% | 33 | 50,689 |
| Wilkes | 21.21% | 6,638 | 75.89% | 23,752 | 2.07% | 647 | 0.73% | 228 | 0.10% | 31 | 31,296 |
| Wilson | 51.56% | 19,663 | 45.97% | 17,531 | 1.75% | 667 | 0.67% | 256 | 0.05% | 18 | 38,135 |
| Yadkin | 17.93% | 3,160 | 78.76% | 13,880 | 2.26% | 398 | 0.86% | 151 | 0.20% | 35 | 17,624 |
| Yancey | 32.09% | 3,196 | 64.11% | 6,385 | 2.62% | 261 | 0.77% | 77 | 0.41% | 41 | 9,960 |
| Totals | 46.17% | 2,189,316 | 49.83% | 2,362,631 | 2.74% | 130,126 | 1.00% | 47,386 | 0.26% | 12,105 | 4,741,564 |
Counties that flipped from Democratic to Republican
- Bladen (largest town: Elizabethtown)
- Gates (largest town: Gatesville)
- Granville (largest city: Oxford)
- Martin (largest town: Williamston)
- Nash (largest city: Rocky Mount)
- Richmond (largest city: Rockingham)
- Robeson (largest city: Lumberton)
By congressional district
Trump won 10 of 13 congressional districts.[20]
| District | Trump | Clinton | Representative |
|---|---|---|---|
| 1st | 30% | 67% | G.K. Butterfield |
| 2nd | 54% | 42% | Renee Ellmers |
| George Holding | |||
| 3rd | 60% | 36% | Walter B. Jones |
| 4th | 27% | 68% | David Price |
| 5th | 57% | 39% | Virginia Foxx |
| 6th | 56% | 41% | Mark Walker |
| 7th | 57% | 39% | David Rouzer |
| 8th | 56% | 41% | Richard Hudson |
| 9th | 54% | 42% | Robert Pittenger |
| 10th | 60% | 36% | Patrick T. McHenry |
| 11th | 62% | 33% | Mark Meadows |
| 12th | 28% | 68% | Alma Adams |
| 13th | 53% | 44% | Ted Budd |
Predictions
The following were final 2016 predictions from various organizations for North Carolina as of Election Day.
- Los Angeles Times: Leans Clinton[21]
- CNN: Tossup[22]
- Sabato's Crystal Ball: Leans Clinton[23]
- NBC: Tossup[24]
- Electoral-vote.com: Leans Clinton[25]
- RealClearPolitics: Tossup[26]
- Fox News: Tossup[27]
- ABC: Tossup[28]
Prior to the 2016 election, North Carolina had been a Republican stronghold since 1968 with the state voting Democratic only once between then and 2008. In 2008, North Carolina voted Democratic for only the second time in 40 years. Although the state returned to the Republican column in 2012, when the party's nominee, Mitt Romney, carried the state, it did so only narrowly, cementing its new status as a battleground state. Throughout the 2016 campaign, North Carolina was considered by most a tossup state, with the outcome going into election night heavily debated. The Trump campaign saw winning North Carolina as crucial in order for Trump to win the Electoral College; conversely, the Clinton campaign felt that it was vital for them to win the state to block Trump's path to an Electoral College win. Both Trump and Clinton campaigned in the state shortly before the general election.[29][30]
Despite winning the state, Trump, in some ways, under-performed in comparison to Romney in 2012. Romney won a majority of the vote in 2012 with 50.4% while Trump only managed a plurality of 49.8%. Similarly, Clinton also under-performed in comparison to Obama, with Clinton winning only 46.2% in comparison to Obama's 48.35%. This situation was the result of the spike in votes for third party candidates in the state as 4% of North Carolinians voted for a candidate other than the Democratic and Republican nominees in 2016 as opposed to just 1.26% in 2012.
An increase in turnout in North Carolina allowed both Trump and Clinton to out-perform Romney and Obama in terms of the total votes each candidate received. In 2016 Trump won around 92,000 more votes than Romney did in 2012 while Clinton won around 10,000 more than Obama. Furthermore, Trump also outperformed Romney by winning North Carolina by a greater margin than Romney was able to as Trump won the state over Clinton by 3.7% compared to the 2% margin Romney won over Obama.
Trump's win in North Carolina marked the 9th time the state has voted Republican in the last 10 elections and, therefore, the state continues to lean more Republican at the presidential level.
See also
References
- "Distribution of Electoral Votes". National Archives and Records Administration. Retrieved December 18, 2020.
- Binker, Mark. "NC approves 27 candidates for presidential primary ballots". WRAL.com. Retrieved November 13, 2016.
- Burns, Matthew. "WRAL News poll: Trump, Clinton poised to win NC". WRAL.com. Retrieved November 13, 2016.
- "NC SBE Election Contest Details". Er.ncsbe.gov. Retrieved November 13, 2016.
- "NC SBE Election Contest Details". Er.ncsbe.gov. Retrieved November 13, 2016.
- "Live results from the North Carolina primary". graphics.latimes.com. Retrieved April 26, 2016.
- "NC SBE Contest Results". North Carolina State Board of Elections. Government of North Carolina. March 16, 2015. Retrieved March 16, 2016.
- Chalian, David (November 4, 2016). "Road to 270: CNN's new election map". CNN. Retrieved April 17, 2019.
- "2016 Electoral Scorecard". The Cook Political Report. November 7, 2016. Retrieved April 17, 2019.
- "2016 Predicted Electoral Map". Electoral-vote.com. Retrieved April 17, 2019.
- Todd, Chuck (November 7, 2016). "NBC's final battleground map shows a lead for Clinton". NBC News. Retrieved April 17, 2019.
- "2016 Election Maps - Battle for White House". RealClearPolitics. Retrieved April 17, 2019.
- Sabato, Larry (November 7, 2016). "The Crystal Ball's 2016 Electoral College ratings". University of Virginia Center for Politics. Retrieved April 17, 2019.
- https://www.realclearpolitics.com/epolls/2016/president/nc/north_carolina_trump_vs_clinton-5538.html#polls
- https://www.realclearpolitics.com/epolls/2016/president/nc/north_carolina_trump_vs_clinton-5538.html#polls
- "NC write-in votes won't count unless they're for Jill Stein". newsobserver.com.
- "Your Write-In Vote Might Not Be Counted In NC". wfmynews2.com.
- "North Carolina State Board of Elections". Retrieved November 14, 2012.
- "Presidential Results by Congressional District, 2000-2008 – Swing State Project". www.swingstateproject.com.
- "Our final map has Clinton winning with 352 electoral votes. Compare your picks with ours". Los Angeles Times. November 6, 2016. Retrieved November 13, 2016.
- "Road to 270: CNN's general election map - CNNPolitics.com". Cnn.com. November 8, 2016. Retrieved November 13, 2016.
- "Larry J. Sabato's Crystal Ball » 2016 President". Centerforpolitics.org. November 7, 2016. Retrieved November 13, 2016.
- Todd, Chuck. "NBC's Final Battleground Map Shows Clinton With a Significant Lead". NBC News. Retrieved November 13, 2016.
- "ElectoralVote". ElectoralVote. December 31, 2000. Retrieved November 13, 2016.
- "2016 Election Maps - Battle for White House". RealClearPolitics. Retrieved November 13, 2016.
- "Electoral Scorecard: Map shifts again in Trump's favor, as Clinton holds edge". Fox News. November 7, 2016. Retrieved November 13, 2016.
- "The Final 15: The Latest Polls in the Swing States That Will Decide the Election". Abcnews.go.com. November 7, 2016. Retrieved November 13, 2016.
- Bradner, Eric (November 3, 2016). "Why North Carolina is so important in 2016". CNN. Retrieved February 10, 2019.
- Catanese, David (November 4, 2016). "Clinton's North Carolina Firewall". US News & World Report. Retrieved February 10, 2019.
Further reading
- Merivaki, Thessalia; Smith, Daniel A. (2019). "A Failsafe for Voters? Cast and Rejected Provisional Ballots in North Carolina". Political Research Quarterly. 73 (1): 65–78. doi:10.1177/1065912919875816. ISSN 1065-9129.
- David Weigel; Lauren Tierney (August 23, 2020), "The six political states of North Carolina", Washingtonpost.com, archived from the original on September 18, 2020
External links
- North Carolina Bipartisan State Board of Elections and Ethics Enforcement
- North Carolina Democratic Party
- North Carolina Republican Party
- North Carolina Libertarian Party
- North Carolina Green Party
- RNC 2016 Republican Nominating Process
- Green papers for 2016 primaries, caucuses, and conventions