1984 United States presidential election in North Carolina
The 1984 United States presidential election in North Carolina took place on November 6, 1984, and was part of the 1984 United States presidential election. Voters chose 13 representatives, or electors to the Electoral College, who voted for president and vice president.
| ||||||||||||||||||||||||||
| ||||||||||||||||||||||||||
 County Results
| ||||||||||||||||||||||||||
| ||||||||||||||||||||||||||
.jpg.webp)

| Elections in North Carolina |
|---|
 |
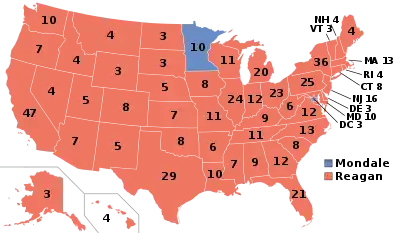
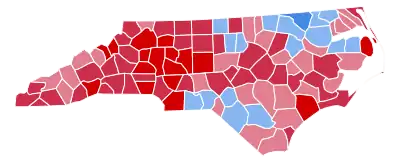
North Carolina strongly voted for the Republican nominee, President Ronald Reagan, over the Democratic nominee, Vice President Walter Mondale in a landslide. The final margin was 61.90% to 37.89%, which compared to the other southern states, was close to the southern average. This margin was a huge swing from 1980, where Reagan had only narrowly carried the state. No Democrat would win in North Carolina again until 2008. As of the 2020 presidential election, this is the last election in which Vance County and Chatham County voted for a Republican presidential candidate and Scotland County would not vote Republican again until 2020.[1]
Results
| 1984 United States presidential election in North Carolina[2] | |||||
|---|---|---|---|---|---|
| Party | Candidate | Votes | Percentage | Electoral votes | |
| Republican | Ronald Reagan | 1,346,481 | 61.90% | 13 | |
| Democratic | Walter Mondale | 824,287 | 37.89% | 0 | |
| Libertarian | David Bergland | 3,794 | 0.17% | 0 | |
| Socialist Workers | Melvin Mason | 799 | 0.04% | 0 | |
| Totals | 2,175,361 | 100.00% | 13 | ||
| Voter turnout | — | ||||
Results by county
| County | Ronald Wilson Reagan[3] Republican |
Walter Frederick Mondale[3] Democratic |
David Peter Bergland[3] Libertarian |
Various candidates[3] Other parties |
Margin | |||||
|---|---|---|---|---|---|---|---|---|---|---|
| % | # | % | # | % | # | % | # | % | # | |
| Avery | 79.87% | 4,702 | 19.69% | 1,159 | 0.29% | 17 | 0.15% | 9 | 60.18% | 3,543 |
| Mitchell | 78.51% | 4,737 | 21.31% | 1,286 | 0.17% | 10 | 0.02% | 1 | 57.19% | 3,451 |
| Randolph | 77.36% | 25,759 | 22.56% | 7,511 | 0.07% | 23 | 0.02% | 6 | 54.80% | 18,248 |
| Yadkin | 74.37% | 8,976 | 25.48% | 3,075 | 0.12% | 14 | 0.04% | 5 | 48.89% | 5,901 |
| Davie | 73.72% | 8,201 | 26.17% | 2,911 | 0.11% | 12 | 0.01% | 1 | 47.55% | 5,290 |
| Gaston | 73.36% | 39,167 | 26.49% | 14,142 | 0.13% | 70 | 0.02% | 13 | 46.87% | 25,025 |
| Wilkes | 73.03% | 18,670 | 26.80% | 6,852 | 0.16% | 40 | 0.01% | 2 | 46.23% | 11,818 |
| Catawba | 72.78% | 31,476 | 27.05% | 11,700 | 0.14% | 61 | 0.03% | 13 | 45.72% | 19,776 |
| Henderson | 72.55% | 19,369 | 27.05% | 7,222 | 0.30% | 80 | 0.10% | 26 | 45.50% | 12,147 |
| Davidson | 72.55% | 30,471 | 27.31% | 11,469 | 0.13% | 54 | 0.02% | 7 | 45.24% | 19,002 |
| Cabarrus | 72.54% | 22,528 | 27.29% | 8,477 | 0.14% | 43 | 0.03% | 10 | 45.24% | 14,051 |
| Dare | 71.83% | 4,738 | 27.88% | 1,839 | 0.24% | 16 | 0.05% | 3 | 43.95% | 2,899 |
| Onslow | 70.75% | 13,928 | 29.02% | 5,713 | 0.17% | 34 | 0.06% | 12 | 41.73% | 8,215 |
| Union | 70.45% | 16,885 | 29.41% | 7,048 | 0.11% | 27 | 0.03% | 8 | 41.04% | 9,837 |
| Alexander | 70.22% | 8,502 | 29.58% | 3,581 | 0.17% | 20 | 0.03% | 4 | 40.65% | 4,921 |
| Rowan | 70.20% | 25,207 | 29.64% | 10,643 | 0.14% | 52 | 0.01% | 5 | 40.56% | 14,564 |
| Iredell | 70.14% | 23,641 | 29.67% | 9,999 | 0.16% | 55 | 0.03% | 9 | 40.48% | 13,642 |
| Caldwell | 69.79% | 17,024 | 29.97% | 7,311 | 0.20% | 50 | 0.04% | 9 | 39.82% | 9,713 |
| Alamance | 69.74% | 26,063 | 30.05% | 11,230 | 0.18% | 68 | 0.02% | 9 | 39.69% | 14,833 |
| Stanly | 67.99% | 13,116 | 31.82% | 6,138 | 0.15% | 29 | 0.05% | 9 | 36.17% | 6,978 |
| Lincoln | 67.64% | 12,621 | 32.13% | 5,996 | 0.20% | 38 | 0.02% | 4 | 35.51% | 6,625 |
| Lee | 67.47% | 8,198 | 32.30% | 3,925 | 0.21% | 25 | 0.02% | 3 | 35.17% | 4,273 |
| Moore | 67.40% | 14,681 | 32.42% | 7,063 | 0.14% | 30 | 0.04% | 9 | 34.97% | 7,618 |
| Johnston | 67.32% | 16,210 | 32.53% | 7,833 | 0.10% | 24 | 0.05% | 13 | 34.79% | 8,377 |
| Nash | 66.73% | 17,295 | 33.14% | 8,588 | 0.09% | 23 | 0.04% | 11 | 33.60% | 8,707 |
| Carteret | 66.28% | 11,637 | 33.50% | 5,882 | 0.20% | 35 | 0.02% | 3 | 32.78% | 5,755 |
| Stokes | 65.63% | 9,515 | 34.14% | 4,950 | 0.19% | 28 | 0.03% | 5 | 31.49% | 4,565 |
| New Hanover | 65.21% | 23,771 | 34.54% | 12,591 | 0.21% | 75 | 0.04% | 15 | 30.67% | 11,180 |
| McDowell | 65.08% | 7,639 | 34.73% | 4,076 | 0.14% | 17 | 0.04% | 5 | 30.36% | 3,563 |
| Macon | 64.93% | 6,661 | 34.80% | 3,570 | 0.20% | 21 | 0.06% | 6 | 30.13% | 3,091 |
| Transylvania | 64.91% | 6,956 | 34.83% | 3,733 | 0.23% | 25 | 0.03% | 3 | 30.07% | 3,223 |
| Polk | 64.73% | 4,046 | 34.70% | 2,169 | 0.54% | 34 | 0.03% | 2 | 30.03% | 1,877 |
| Surry | 64.88% | 13,340 | 34.96% | 7,188 | 0.13% | 26 | 0.04% | 8 | 29.92% | 6,152 |
| Watauga | 64.27% | 9,370 | 35.41% | 5,163 | 0.28% | 41 | 0.03% | 5 | 28.86% | 4,207 |
| Burke | 64.32% | 18,766 | 35.48% | 10,353 | 0.17% | 51 | 0.03% | 8 | 28.83% | 8,413 |
| Wayne | 64.13% | 17,961 | 35.74% | 10,011 | 0.11% | 30 | 0.02% | 6 | 28.38% | 7,950 |
| Craven | 64.04% | 12,893 | 35.69% | 7,186 | 0.20% | 41 | 0.07% | 14 | 28.35% | 5,707 |
| Cherokee | 63.72% | 4,894 | 36.15% | 2,776 | 0.10% | 8 | 0.03% | 2 | 27.58% | 2,118 |
| Currituck | 63.24% | 2,885 | 36.56% | 1,668 | 0.18% | 8 | 0.02% | 1 | 26.68% | 1,217 |
| Mecklenburg | 62.67% | 106,754 | 37.10% | 63,190 | 0.20% | 337 | 0.03% | 58 | 25.57% | 43,564 |
| Rockingham | 62.70% | 17,895 | 37.16% | 10,605 | 0.11% | 32 | 0.02% | 7 | 25.54% | 7,290 |
| Graham | 62.63% | 2,514 | 37.22% | 1,494 | 0.10% | 4 | 0.05% | 2 | 25.41% | 1,020 |
| Clay | 62.39% | 2,259 | 37.01% | 1,340 | 0.52% | 19 | 0.08% | 3 | 25.38% | 919 |
| Cleveland | 62.22% | 17,095 | 37.44% | 10,288 | 0.30% | 82 | 0.04% | 12 | 24.77% | 6,807 |
| Person | 62.30% | 5,854 | 37.54% | 3,528 | 0.12% | 11 | 0.04% | 4 | 24.75% | 2,326 |
| Rutherford | 62.23% | 11,369 | 37.56% | 6,862 | 0.18% | 33 | 0.02% | 4 | 24.67% | 4,507 |
| Ashe | 62.10% | 6,611 | 37.66% | 4,009 | 0.21% | 22 | 0.03% | 3 | 24.44% | 2,602 |
| Buncombe | 61.61% | 37,698 | 38.14% | 23,337 | 0.20% | 122 | 0.05% | 29 | 23.47% | 14,361 |
| Wake | 61.61% | 81,251 | 38.16% | 50,323 | 0.20% | 267 | 0.02% | 30 | 23.45% | 30,928 |
| Forsyth | 61.53% | 59,208 | 38.26% | 36,814 | 0.18% | 174 | 0.02% | 24 | 23.27% | 22,394 |
| Guilford | 61.25% | 73,096 | 38.57% | 46,027 | 0.16% | 186 | 0.03% | 31 | 22.68% | 27,069 |
| Harnett | 61.11% | 11,198 | 38.78% | 7,106 | 0.08% | 15 | 0.02% | 4 | 22.33% | 4,092 |
| Lenoir | 60.79% | 13,321 | 39.04% | 8,556 | 0.12% | 27 | 0.05% | 10 | 21.74% | 4,765 |
| Beaufort | 60.66% | 9,284 | 39.12% | 5,987 | 0.18% | 27 | 0.05% | 7 | 21.54% | 3,297 |
| Wilson | 59.31% | 12,243 | 40.42% | 8,343 | 0.19% | 40 | 0.08% | 17 | 18.89% | 3,900 |
| Brunswick | 58.89% | 9,763 | 40.86% | 6,774 | 0.21% | 35 | 0.04% | 6 | 18.03% | 2,989 |
| Pitt | 58.36% | 18,983 | 41.45% | 13,481 | 0.15% | 48 | 0.04% | 14 | 16.92% | 5,502 |
| Cumberland | 58.18% | 31,602 | 41.63% | 22,614 | 0.16% | 89 | 0.03% | 14 | 16.55% | 8,988 |
| Perquimans | 57.28% | 1,939 | 42.57% | 1,441 | 0.12% | 4 | 0.03% | 1 | 14.71% | 498 |
| Montgomery | 57.07% | 5,109 | 42.79% | 3,831 | 0.07% | 6 | 0.07% | 6 | 14.28% | 1,278 |
| Alleghany | 56.08% | 2,589 | 43.60% | 2,013 | 0.28% | 13 | 0.04% | 2 | 12.48% | 576 |
| Jackson | 55.97% | 5,582 | 43.78% | 4,367 | 0.22% | 22 | 0.03% | 3 | 12.18% | 1,215 |
| Haywood | 55.94% | 10,146 | 43.88% | 7,958 | 0.13% | 24 | 0.05% | 9 | 12.06% | 2,188 |
| Franklin | 55.57% | 5,984 | 44.26% | 4,766 | 0.09% | 10 | 0.07% | 8 | 11.31% | 1,218 |
| Chowan | 55.41% | 2,171 | 44.31% | 1,736 | 0.23% | 9 | 0.05% | 2 | 11.10% | 435 |
| Madison | 54.81% | 3,666 | 44.67% | 2,988 | 0.15% | 10 | 0.37% | 25 | 10.14% | 678 |
| Granville | 54.42% | 6,302 | 45.05% | 5,217 | 0.50% | 58 | 0.03% | 3 | 9.37% | 1,085 |
| Pasquotank | 54.58% | 4,646 | 45.27% | 3,854 | 0.07% | 6 | 0.08% | 7 | 9.30% | 792 |
| Camden | 54.25% | 1,282 | 45.49% | 1,075 | 0.21% | 5 | 0.04% | 1 | 8.76% | 207 |
| Hyde | 54.27% | 1,195 | 45.59% | 1,004 | 0.14% | 3 | 0.00% | 0 | 8.67% | 191 |
| Pamlico | 54.14% | 2,554 | 45.62% | 2,152 | 0.17% | 8 | 0.06% | 3 | 8.52% | 402 |
| Yancey | 53.96% | 4,296 | 45.86% | 3,651 | 0.11% | 9 | 0.06% | 5 | 8.10% | 645 |
| Sampson | 53.87% | 10,665 | 46.04% | 9,115 | 0.07% | 13 | 0.02% | 3 | 7.83% | 1,550 |
| Pender | 53.73% | 5,079 | 46.06% | 4,354 | 0.17% | 16 | 0.04% | 4 | 7.67% | 725 |
| Vance | 53.68% | 6,836 | 46.18% | 5,880 | 0.12% | 15 | 0.02% | 3 | 7.51% | 956 |
| Greene | 53.47% | 3,195 | 46.39% | 2,772 | 0.13% | 8 | 0.00% | 0 | 7.08% | 423 |
| Chatham | 53.39% | 8,595 | 46.33% | 7,458 | 0.24% | 39 | 0.04% | 7 | 7.06% | 1,137 |
| Duplin | 52.96% | 7,708 | 46.93% | 6,830 | 0.09% | 13 | 0.03% | 4 | 6.03% | 878 |
| Martin | 52.32% | 4,266 | 47.47% | 3,870 | 0.15% | 12 | 0.06% | 5 | 4.86% | 396 |
| Columbus | 51.11% | 9,150 | 48.75% | 8,728 | 0.11% | 20 | 0.03% | 6 | 2.36% | 422 |
| Jones | 50.30% | 2,062 | 49.40% | 2,025 | 0.20% | 8 | 0.10% | 4 | 0.90% | 37 |
| Scotland | 50.23% | 4,077 | 49.62% | 4,028 | 0.14% | 11 | 0.01% | 1 | 0.60% | 49 |
| Swain | 50.02% | 2,012 | 49.73% | 2,000 | 0.22% | 9 | 0.02% | 1 | 0.30% | 12 |
| Caswell | 48.84% | 3,992 | 50.86% | 4,157 | 0.23% | 19 | 0.07% | 6 | -2.02% | -165 |
| Tyrrell | 48.89% | 774 | 50.98% | 807 | 0.06% | 1 | 0.06% | 1 | -2.08% | -33 |
| Halifax | 48.65% | 8,832 | 51.11% | 9,278 | 0.17% | 30 | 0.07% | 13 | -2.46% | -446 |
| Bladen | 48.07% | 4,701 | 51.78% | 5,064 | 0.12% | 12 | 0.02% | 2 | -3.71% | -363 |
| Edgecombe | 47.66% | 9,635 | 52.16% | 10,545 | 0.12% | 24 | 0.06% | 12 | -4.50% | -910 |
| Richmond | 47.50% | 6,807 | 52.30% | 7,494 | 0.18% | 26 | 0.02% | 3 | -4.79% | -687 |
| Durham | 47.39% | 29,185 | 52.36% | 32,244 | 0.22% | 134 | 0.03% | 21 | -4.97% | -3,059 |
| Washington | 46.67% | 2,731 | 53.21% | 3,114 | 0.12% | 7 | 0.00% | 0 | -6.54% | -383 |
| Robeson | 45.76% | 12,947 | 53.93% | 15,257 | 0.20% | 56 | 0.11% | 31 | -8.17% | -2,310 |
| Hoke | 43.14% | 2,449 | 56.61% | 3,214 | 0.19% | 11 | 0.05% | 3 | -13.48% | -765 |
| Gates | 43.10% | 1,694 | 56.62% | 2,225 | 0.18% | 7 | 0.10% | 4 | -13.51% | -531 |
| Orange | 42.96% | 15,585 | 56.69% | 20,564 | 0.30% | 108 | 0.06% | 20 | -13.72% | -4,979 |
| Anson | 42.45% | 3,719 | 57.25% | 5,015 | 0.13% | 11 | 0.17% | 15 | -14.79% | -1,296 |
| Bertie | 41.91% | 2,879 | 57.54% | 3,953 | 0.42% | 29 | 0.13% | 9 | -15.63% | -1,074 |
| Hertford | 41.27% | 3,176 | 58.45% | 4,498 | 0.21% | 16 | 0.06% | 5 | -17.18% | -1,322 |
| Warren | 40.25% | 2,664 | 59.63% | 3,946 | 0.05% | 3 | 0.08% | 5 | -19.37% | -1,282 |
| Northampton | 38.39% | 3,198 | 61.15% | 5,094 | 0.29% | 24 | 0.17% | 14 | -22.76% | -1,896 |
References
- Sullivan, Robert David; ‘How the Red and Blue Map Evolved Over the Past Century’; America Magazine in The National Catholic Review; June 29, 2016
- "1984 Presidential General Election Results – North Carolina". Dave Leip's U.S. Election Atlas. Retrieved 2008-08-25.
- Our Campaigns; NC US President Race, November 06, 1984