2000 United States presidential election in North Carolina
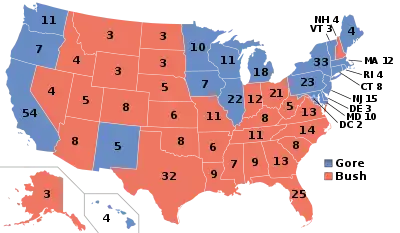
The 2000 United States presidential election in North Carolina took place on November 7, 2000, and was part of the 2000 United States presidential election. Voters chose 14 representatives, or electors, to the Electoral College, who voted for president and vice president.
| ||||||||||||||||||||||||||
| ||||||||||||||||||||||||||
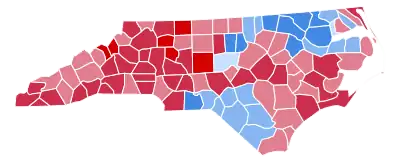 County Results
| ||||||||||||||||||||||||||
| ||||||||||||||||||||||||||

| Elections in North Carolina |
|---|
 |
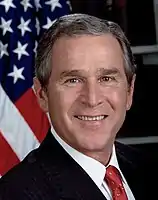
North Carolina was won by Governor George W. Bush with a 12.83% margin of victory. Bush won most of the counties and congressional districts of the state. He won 9 of the 12 districts. He also won the most populated counties of the state including Forsyth County with 56%, Wake County with 53%, Guilford County with 51%, and Mecklenburg County with 51% of the vote.[1] As of the 2020 presidential election, this is the last election in which Guilford County and Mecklenburg County voted for a Republican presidential candidate and the last election in which Columbus County, Chowan County, and Tyrrell County voted for a Democratic presidential candidate.
Results
| 2000 United States presidential election in North Carolina | |||||
|---|---|---|---|---|---|
| Party | Candidate | Votes | Percentage | Electoral votes | |
| Republican | George W. Bush | 1,631,163 | 56.03% | 14 | |
| Democratic | Al Gore | 1,257,692 | 43.20% | 0 | |
| Libertarian | Harry Browne | 12,307 | 0.42% | 0 | |
| Reform | Patrick Buchanan | 8,874 | 0.30% | 0 | |
| Write-In | David McReynolds | 1,226 | 0.04% | 0 | |
| Totals | - | 100.00% | 14 | ||
| Voter turnout (Voting age/registered) | 48%/57% | ||||
Results by county
| County | George Walker Bush Republican |
Albert Arnold Gore, jr. Democratic |
Harry Edson Browne Libertarian |
Patrick Joseph Buchanan Reform |
Margin | |||||
|---|---|---|---|---|---|---|---|---|---|---|
| % | # | % | # | % | # | % | # | % | # | |
| Yadkin | 76.27% | 10,435 | 22.85% | 3,127 | 0.39% | 53 | 0.49% | 67 | 53.42% | 7,308 |
| Mitchell | 75.52% | 4,984 | 23.26% | 1,535 | 0.39% | 26 | 0.83% | 55 | 52.26% | 3,449 |
| Avery | 74.04% | 4,956 | 25.19% | 1,686 | 0.36% | 24 | 0.42% | 28 | 48.85% | 3,270 |
| Davie | 72.75% | 10,184 | 26.08% | 3,651 | 0.48% | 67 | 0.69% | 96 | 46.67% | 6,533 |
| Randolph | 72.51% | 30,959 | 26.62% | 11,366 | 0.35% | 149 | 0.52% | 222 | 45.89% | 19,593 |
| Stokes | 70.00% | 12,028 | 29.27% | 5,030 | 0.33% | 56 | 0.40% | 68 | 40.73% | 6,998 |
| Wilkes | 69.18% | 16,826 | 29.71% | 7,226 | 0.32% | 79 | 0.49% | 120 | 39.47% | 9,600 |
| Graham | 68.55% | 2,304 | 29.93% | 1,006 | 0.62% | 21 | 0.77% | 26 | 38.62% | 1,298 |
| Alexander | 68.50% | 9,242 | 30.88% | 4,166 | 0.27% | 36 | 0.32% | 43 | 37.62% | 5,076 |
| Stanly | 68.14% | 15,548 | 30.97% | 7,066 | 0.30% | 69 | 0.59% | 135 | 37.17% | 8,482 |
| Davidson | 67.99% | 35,387 | 31.12% | 16,199 | 0.33% | 173 | 0.55% | 288 | 36.87% | 19,188 |
| Union | 67.41% | 31,876 | 31.49% | 14,890 | 0.52% | 247 | 0.31% | 146 | 35.92% | 16,986 |
| Catawba | 67.36% | 34,244 | 31.95% | 16,246 | 0.41% | 209 | 0.28% | 141 | 35.41% | 17,998 |
| Gaston | 66.67% | 39,453 | 32.58% | 19,281 | 0.43% | 253 | 0.32% | 192 | 34.09% | 20,172 |
| Henderson | 66.54% | 25,688 | 32.54% | 12,562 | 0.47% | 183 | 0.45% | 174 | 34.00% | 13,126 |
| Caldwell | 66.39% | 17,337 | 32.89% | 8,588 | 0.36% | 95 | 0.36% | 95 | 33.50% | 8,749 |
| Cabarrus | 66.05% | 32,704 | 32.89% | 16,284 | 0.49% | 242 | 0.30% | 151 | 33.16% | 16,420 |
| Johnston | 66.12% | 27,212 | 33.30% | 13,704 | 0.38% | 157 | 0.20% | 82 | 32.82% | 13,508 |
| Surry | 65.93% | 15,401 | 33.21% | 7,757 | 0.36% | 85 | 0.49% | 115 | 32.72% | 7,644 |
| Carteret | 65.39% | 17,381 | 33.25% | 8,839 | 0.40% | 106 | 0.50% | 132 | 32.14% | 8,542 |
| Rowan | 65.53% | 28,922 | 33.74% | 14,891 | 0.33% | 146 | 0.39% | 174 | 31.79% | 14,031 |
| Cherokee | 65.17% | 6,305 | 33.48% | 3,239 | 0.54% | 52 | 0.81% | 78 | 31.69% | 3,066 |
| Iredell | 65.49% | 29,853 | 33.86% | 15,434 | 1.02% | 463 | 0.96% | 436 | 31.63% | 14,419 |
| McDowell | 65.01% | 9,109 | 33.88% | 4,747 | 0.28% | 39 | 0.41% | 57 | 31.13% | 4,362 |
| Onslow | 65.06% | 19,657 | 33.99% | 10,269 | 0.55% | 167 | 0.40% | 122 | 31.07% | 9,388 |
| Lincoln | 65.03% | 15,951 | 34.29% | 8,412 | 0.37% | 90 | 0.31% | 76 | 30.74% | 7,539 |
| Macon | 63.52% | 8,406 | 35.39% | 4,683 | 0.55% | 73 | 0.54% | 72 | 28.13% | 3,723 |
| Rutherford | 63.34% | 13,755 | 35.44% | 7,697 | 0.43% | 93 | 0.79% | 171 | 27.90% | 6,058 |
| Transylvania | 63.35% | 9,011 | 35.46% | 5,044 | 0.64% | 91 | 0.56% | 79 | 27.89% | 3,967 |
| Moore | 63.52% | 19,882 | 35.88% | 11,232 | 0.34% | 106 | 0.26% | 81 | 27.64% | 8,650 |
| Clay | 62.72% | 2,416 | 35.33% | 1,361 | 0.78% | 30 | 0.65% | 25 | 27.39% | 1,055 |
| Alamance | 62.23% | 29,305 | 37.08% | 17,459 | 0.33% | 157 | 0.36% | 170 | 25.15% | 11,846 |
| Polk | 61.11% | 5,074 | 37.50% | 3,114 | 0.75% | 62 | 0.64% | 53 | 23.61% | 1,960 |
| Harnett | 61.08% | 14,762 | 37.88% | 9,155 | 0.30% | 72 | 0.31% | 74 | 23.20% | 5,607 |
| Wayne | 61.26% | 20,758 | 38.38% | 13,005 | 0.19% | 65 | 0.17% | 56 | 22.88% | 7,753 |
| Craven | 60.95% | 19,494 | 38.18% | 12,213 | 0.35% | 113 | 0.52% | 165 | 22.77% | 7,281 |
| Beaufort | 60.83% | 10,531 | 38.32% | 6,634 | 0.36% | 63 | 0.23% | 40 | 22.51% | 3,897 |
| Currituck | 60.77% | 4,095 | 38.51% | 2,595 | 0.46% | 31 | 0.27% | 18 | 22.26% | 1,500 |
| Ashe | 60.35% | 6,226 | 38.88% | 4,011 | 0.41% | 42 | 0.36% | 37 | 21.47% | 2,215 |
| Burke | 60.23% | 18,466 | 38.89% | 11,924 | 0.41% | 125 | 0.47% | 143 | 21.34% | 6,542 |
| Alleghany | 58.68% | 2,531 | 39.76% | 1,715 | 0.37% | 16 | 1.18% | 51 | 18.92% | 816 |
| Nash | 58.97% | 17,995 | 40.56% | 12,376 | 0.00% | 0 | 0.00% | 0 | 18.41% | 5,619 |
| Rockingham | 58.35% | 18,979 | 40.76% | 13,260 | 0.23% | 75 | 0.39% | 127 | 17.59% | 5,719 |
| Cleveland | 58.22% | 19,064 | 41.09% | 13,455 | 0.33% | 109 | 0.32% | 104 | 17.13% | 5,609 |
| Lee | 57.77% | 9,406 | 41.67% | 6,785 | 0.31% | 51 | 0.25% | 41 | 16.10% | 2,621 |
| Camden | 57.51% | 1,628 | 41.93% | 1,187 | 0.32% | 9 | 0.25% | 7 | 15.58% | 441 |
| Pamlico | 57.21% | 2,999 | 41.74% | 2,188 | 0.69% | 36 | 0.36% | 19 | 15.47% | 811 |
| Greene | 57.12% | 3,353 | 42.21% | 2,478 | 0.14% | 8 | 0.51% | 30 | 14.91% | 875 |
| Yancey | 56.71% | 4,970 | 42.38% | 3,714 | 0.11% | 10 | 0.67% | 59 | 14.33% | 1,256 |
| Person | 56.81% | 6,722 | 42.61% | 5,042 | 0.36% | 43 | 0.22% | 26 | 14.20% | 1,680 |
| Madison | 56.17% | 4,676 | 42.10% | 3,505 | 0.48% | 40 | 0.66% | 55 | 14.07% | 1,171 |
| Watauga | 55.75% | 10,438 | 42.51% | 7,959 | 0.81% | 151 | 0.30% | 57 | 13.24% | 2,479 |
| Dare | 56.15% | 7,301 | 42.99% | 5,589 | 0.61% | 79 | 0.25% | 33 | 13.16% | 1,712 |
| Forsyth | 55.98% | 67,700 | 43.37% | 52,457 | 0.37% | 442 | 0.28% | 343 | 12.61% | 15,243 |
| New Hanover | 55.04% | 36,503 | 44.17% | 29,292 | 0.57% | 377 | 0.22% | 147 | 10.87% | 7,211 |
| Montgomery | 55.11% | 4,946 | 44.34% | 3,979 | 0.21% | 19 | 0.22% | 20 | 10.77% | 967 |
| Haywood | 50.79% | 12,118 | 41.05% | 9,793 | 0.45% | 107 | 0.44% | 104 | 9.74% | 2,325 |
| Duplin | 54.48% | 7,840 | 45.00% | 6,475 | 0.25% | 36 | 0.22% | 32 | 9.48% | 1,365 |
| Lenoir | 54.40% | 11,512 | 45.02% | 9,527 | 0.20% | 43 | 0.25% | 53 | 9.38% | 1,985 |
| Wilson | 54.24% | 13,466 | 45.38% | 11,266 | 0.21% | 51 | 0.17% | 43 | 8.86% | 2,200 |
| Buncombe | 53.93% | 46,101 | 45.09% | 38,545 | 0.55% | 471 | 0.42% | 359 | 8.84% | 7,556 |
| Pender | 54.13% | 7,661 | 45.32% | 6,415 | 0.26% | 37 | 0.29% | 41 | 8.81% | 1,246 |
| Sampson | 54.11% | 10,410 | 45.57% | 8,768 | 0.17% | 33 | 0.15% | 28 | 8.54% | 1,642 |
| Pitt | 53.84% | 23,192 | 45.70% | 19,685 | 0.27% | 115 | 0.19% | 81 | 8.14% | 3,507 |
| Brunswick | 53.49% | 15,427 | 45.49% | 13,118 | 0.47% | 136 | 0.55% | 158 | 8.00% | 2,309 |
| Jones | 53.33% | 2,114 | 45.96% | 1,822 | 0.33% | 13 | 0.38% | 15 | 7.37% | 292 |
| Wake | 52.90% | 142,494 | 45.83% | 123,466 | 0.65% | 1,754 | 0.18% | 497 | 7.07% | 19,028 |
| Franklin | 52.96% | 8,501 | 46.44% | 7,454 | 0.39% | 62 | 0.21% | 34 | 6.52% | 1,047 |
| Perquimans | 51.79% | 2,230 | 47.21% | 2,033 | 0.53% | 23 | 0.46% | 20 | 4.58% | 197 |
| Jackson | 51.46% | 6,237 | 47.21% | 5,722 | 0.73% | 88 | 0.61% | 74 | 4.25% | 515 |
| Swain | 50.89% | 2,224 | 47.99% | 2,097 | 0.50% | 22 | 0.57% | 25 | 2.90% | 127 |
| Mecklenburg | 50.97% | 134,068 | 48.25% | 126,911 | 0.49% | 1,291 | 0.19% | 487 | 2.72% | 7,157 |
| Guilford | 50.76% | 84,394 | 48.59% | 80,787 | 0.34% | 569 | 0.29% | 485 | 2.17% | 3,607 |
| Caswell | 50.70% | 4,270 | 48.58% | 4,091 | 0.31% | 26 | 0.42% | 35 | 2.12% | 179 |
| Hyde | 50.60% | 1,132 | 48.64% | 1,088 | 0.45% | 10 | 0.31% | 7 | 1.96% | 44 |
| Chowan | 49.39% | 2,415 | 49.69% | 2,430 | 0.57% | 28 | 0.35% | 17 | -0.30% | -15 |
| Cumberland | 49.42% | 38,129 | 50.07% | 38,626 | 0.31% | 237 | 0.21% | 159 | -0.65% | -497 |
| Chatham | 48.96% | 10,248 | 49.98% | 10,461 | 0.71% | 148 | 0.28% | 58 | -1.02% | -213 |
| Granville | 48.47% | 7,364 | 50.90% | 7,733 | 0.46% | 70 | 0.18% | 27 | -2.43% | -369 |
| Martin | 47.19% | 4,420 | 52.63% | 4,929 | 0.04% | 4 | 0.14% | 13 | -5.44% | -509 |
| Bladen | 45.63% | 4,977 | 53.99% | 5,889 | 0.17% | 18 | 0.22% | 24 | -8.36% | -912 |
| Pasquotank | 45.34% | 4,943 | 53.88% | 5,874 | 0.35% | 38 | 0.44% | 48 | -8.54% | -931 |
| Columbus | 45.28% | 8,342 | 54.20% | 9,986 | 0.26% | 48 | 0.27% | 49 | -8.92% | -1,644 |
| Tyrrell | 45.08% | 706 | 54.21% | 849 | 0.32% | 5 | 0.38% | 6 | -9.13% | -143 |
| Washington | 44.36% | 2,169 | 55.30% | 2,704 | 0.14% | 7 | 0.20% | 10 | -10.94% | -535 |
| Richmond | 43.89% | 6,263 | 55.61% | 7,935 | 0.21% | 30 | 0.29% | 41 | -11.72% | -1,672 |
| Vance | 43.81% | 5,564 | 55.84% | 7,092 | 0.25% | 32 | 0.10% | 13 | -12.03% | -1,528 |
| Gates | 42.95% | 1,480 | 56.41% | 1,944 | 0.15% | 5 | 0.20% | 7 | -13.46% | -464 |
| Hoke | 40.07% | 3,439 | 58.46% | 5,017 | 1.06% | 91 | 0.41% | 35 | -18.39% | -1,578 |
| Scotland | 39.77% | 3,740 | 59.84% | 5,627 | 0.12% | 11 | 0.27% | 25 | -20.07% | -1,887 |
| Anson | 39.59% | 3,161 | 60.01% | 4,792 | 0.18% | 14 | 0.23% | 18 | -20.42% | -1,631 |
| Robeson | 39.40% | 11,721 | 59.95% | 17,834 | 0.17% | 52 | 0.27% | 81 | -20.55% | -6,113 |
| Halifax | 39.47% | 6,698 | 60.24% | 10,222 | 0.15% | 25 | 0.15% | 25 | -20.77% | -3,524 |
| Edgecombe | 37.56% | 6,836 | 62.16% | 11,315 | 0.16% | 30 | 0.12% | 21 | -24.60% | -4,479 |
| Orange | 36.34% | 17,930 | 62.66% | 30,921 | 0.79% | 392 | 0.15% | 75 | -26.32% | -12,991 |
| Durham | 35.39% | 30,150 | 63.27% | 53,907 | 0.51% | 433 | 0.12% | 103 | -27.88% | -23,757 |
| Bertie | 34.67% | 2,488 | 64.94% | 4,660 | 0.15% | 11 | 0.24% | 17 | -30.27% | -2,172 |
| Northampton | 32.52% | 2,667 | 67.23% | 5,513 | 0.11% | 9 | 0.13% | 11 | -34.71% | -2,846 |
| Warren | 32.41% | 2,202 | 67.34% | 4,576 | 0.10% | 7 | 0.12% | 8 | -34.93% | -2,374 |
| Hertford | 30.16% | 2,382 | 69.44% | 5,484 | 0.22% | 17 | 0.18% | 14 | -39.28% | -3,102 |
By congressional district
Bush won 9 of 12 congressional districts.[2]
| District | Bush | Gore | Representative |
|---|---|---|---|
| 1st | 42% | 58% | Eva Clayton |
| 2nd | 56% | 44% | Bob Etheridge |
| 3rd | 62% | 38% | Walter B. Jones |
| 4th | 47% | 52% | David Price |
| 5th | 66% | 33% | Richard Burr |
| 6th | 65% | 34% | Howard Coble |
| 7th | 53% | 47% | Mike McIntyre |
| 8th | 56% | 43% | Robin Hayes |
| 9th | 61% | 38% | Sue Wilkins Myrick |
| 10th | 67% | 33% | Cass Ballenger |
| 11th | 59% | 40% | Charles H. Taylor |
| 12th | 37% | 62% | Mel Watt |
Electors
Technically the voters of North Carolina cast their ballots for electors: representatives to the Electoral College. North Carolina is allocated 14 electors because it has 12 congressional districts and 2 senators. All candidates who appear on the ballot or qualify to receive write-in votes must submit a list of 14 electors, who pledge to vote for their candidate and his or her running mate. Whoever wins the majority of votes in the state is awarded all 14 electoral votes. Their chosen electors then vote for president and vice president. Although electors are pledged to their candidate and running mate, they are not obligated to vote for them. An elector who votes for someone other than his or her candidate is known as a faithless elector.
The electors of each state and the District of Columbia met on December 18, 2000[3] to cast their votes for president and vice president. The Electoral College itself never meets as one body. Instead the electors from each state and the District of Columbia met in their respective capitols.
The following were the members of the Electoral College from the state. All were pledged to and voted for George W. Bush and Dick Cheney:[4]
- Fran Barnhart
- Claude Billings
- Sam Currin
- Tom Dwiggins
- A. Dial Gray
- Barbara Holt
- Marshall Hurley
- Margaret King
- Jeff Mixon
- Joe L. Morgan
- Steve Rader
- Robert Rector
- Dewitt Rhoades
- Linda Young
References
- "2000 Presidential General Election Results – North Carolina". Dave Leip’s U.S. Election Atlas.
- "2000 Presidential General Election Data – North Carolina". Dave Leip’s U.S. Election Atlas.
- "2000 Events Timeline". Dave Leip’s U.S. Election Atlas.
- "Archived copy". Archived from the original on 2012-02-12. Retrieved 2009-11-08.CS1 maint: archived copy as title (link)