Albany County, Wyoming
Albany County (/ˈɔːlbəni/ (![]() listen) AWL-bə-nee) is a county in the U.S. state of Wyoming. As of the 2010 United States Census, the population was 36,299.[1] Its county seat is Laramie,[2] the site of the University of Wyoming. Its south border lies on the northern Colorado state line.
listen) AWL-bə-nee) is a county in the U.S. state of Wyoming. As of the 2010 United States Census, the population was 36,299.[1] Its county seat is Laramie,[2] the site of the University of Wyoming. Its south border lies on the northern Colorado state line.
Albany County | |
|---|---|
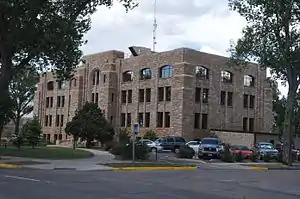 Albany County Courthouse | |
 Flag | |
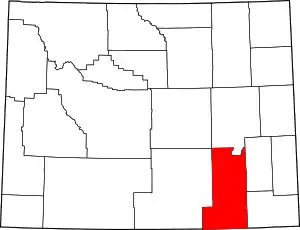 Location within the U.S. state of Wyoming | |
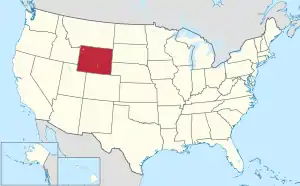 Wyoming's location within the U.S. | |
| Coordinates: 41°39′N 105°44′W | |
| Country | |
| State | |
| Founded | December 16, 1868 |
| Named for | Albany, New York |
| Seat | Laramie |
| Largest city | Laramie |
| Area | |
| • Total | 4,309 sq mi (11,160 km2) |
| • Land | 4,274 sq mi (11,070 km2) |
| • Water | 35 sq mi (90 km2) 0.8% |
| Population (2010) | |
| • Total | 36,299 |
| • Estimate (2019) | 38,880 |
| • Density | 8.4/sq mi (3.3/km2) |
| Time zone | UTC−7 (Mountain) |
| • Summer (DST) | UTC−6 (MDT) |
| Congressional district | At-large |
| Website | www |
Albany County comprises the Laramie, WY Micropolitan Statistical Area. It is the fifth-most populous county in Wyoming.
History
Albany County was organized in 1868 of territory annexed from Laramie County in Dakota Territory, which at the time had jurisdiction over part of modern-day Wyoming.[3] It became a county in Wyoming Territory when its government was formally organized on May 19, 1869.[4][5]
Charles D. Bradley, a member of the legislature of the Dakota Territory named the county for Albany, New York, the capital of his native state.[6] In 1875, the Wyoming Territorial legislature authorized portions of Albany County to be annexed to create Crook and Johnson counties, and in 1888 land was taken from Albany County for the creation of Converse County. Further adjustments were made to the county's boundary in 1911 and 1955.
Geography
According to the US Census Bureau, the county has a total area of 4,309 square miles (11,160 km2), of which 4,274 square miles (11,070 km2) is land and 35 square miles (91 km2) (0.8%) is water.[7]
Adjacent counties
- Converse County – north
- Platte County – northeast
- Laramie County – east
- Larimer County, Colorado – south
- Jackson County, Colorado – southwest
- Carbon County – west
- Natrona County – northwest
Major highways
National protected areas
Demographics
| Historical population | |||
|---|---|---|---|
| Census | Pop. | %± | |
| 1870 | 2,021 | — | |
| 1880 | 4,626 | 128.9% | |
| 1890 | 8,865 | 91.6% | |
| 1900 | 13,084 | 47.6% | |
| 1910 | 11,574 | −11.5% | |
| 1920 | 9,283 | −19.8% | |
| 1930 | 12,041 | 29.7% | |
| 1940 | 13,946 | 15.8% | |
| 1950 | 19,055 | 36.6% | |
| 1960 | 21,290 | 11.7% | |
| 1970 | 26,431 | 24.1% | |
| 1980 | 29,062 | 10.0% | |
| 1990 | 30,797 | 6.0% | |
| 2000 | 32,014 | 4.0% | |
| 2010 | 36,299 | 13.4% | |
| 2019 (est.) | 38,880 | [8] | 7.1% |
| US Decennial Census[9] 1870–2000[10] 2010–2016[1] | |||

2000 census
At the 2000 United States Census,[11] there were 32,014 people, 13,269 households and 7,006 families in the county. The population density was 8 per square mile (3/km2). There were 15,215 housing units at an average density of 4 per square mile (1/km2). The racial makeup of the county was 91.32% White, 1.11% Black or African American, 0.95% Native American, 1.7% Asian, 0.06% Pacific Islander, 2.65% from other races, and 2.22% from two or more races. 7.49% of the population were Hispanic or Latino of any race. 24.4% were of German, 11.1% English, 10.2% Irish and 6.1% American ancestry.
There were 13,269 households, of which 23.9% had children under the age of 18 living with them, 42.0% were married couples living together, 7.5% had a female householder with no husband present, and 47.2% were non-families. 31.4% of all households were made up of individuals, and 6.2% had someone living alone who was 65 years of age or older. The average household size was 2.23 and the average family size was 2.84.
The county population contained 18.4% of the population under the age of 18, 28.2% from 18 to 24, 26.1% from 25 to 44, 19.1% from 45 to 64, and 8.3% who were 65 years of age or older. The median age was 27 years. For every 100 females there were 106.7 males. For every 100 females age 18 and over, there were 106.4 males.
The median household income was $28,790 and the median family income was $44,334. Males had a median income of $31,087 compared with $22,061 for females. The per capita income for the county was $16,706. About 10.8% of families and 21.0% of the population were below the poverty line, including 15.7% of those under the age of 18 and 8.8% of those 65 and older were living below the poverty line.
2010 census
As of the 2010 United States Census, there were 36,299 people, 15,691 households, and 7,430 families in the county.[12] The population density was 8.5 inhabitants per square mile (3.3/km2). There were 17,939 housing units at an average density of 4.2 per square mile (1.6/km2).[13] The racial makeup of the county was 90.1% white, 2.8% Asian, 1.2% black or African American, 0.7% American Indian, 0.1% Pacific islander, 2.4% from other races, and 2.7% from two or more races. Those of Hispanic or Latino origin made up 8.8% of the population.[12] In terms of ancestry, 31.2% were German, 15.3% were Irish, 12.5% were English, and 4.4% were American.[14]
Of the 15,691 households, 21.0% had children under the age of 18 living with them, 36.9% were married couples living together, 6.7% had a female householder with no husband present, 52.6% were non-families, and 34.9% of all households were made up of individuals. The average household size was 2.17 and the average family size was 2.84. The median age was 26.8 years.[12]
The median income for a household in the county was $42,890 and the median income for a family was $70,054. Males had a median income of $43,484 versus $33,512 for females. The per capita income for the county was $25,622. About 7.2% of families and 21.5% of the population were below the poverty line, including 10.7% of those under age 18 and 6.6% of those age 65 or over.[15]
Politics
Owing to the presence of a substantial student body at the University of Wyoming, Albany County voters have supported the Democratic Party candidate in national elections more often than the state as a whole. However, it is still rather conservative for a county dominated by a college town. Since 1892 the county has selected the Republican Party candidate in 63% of national elections (up to 2016), including all but five times since 1952.
Albany County is one of only twelve counties to have voted for Obama in 2008, Romney in 2012, Trump in 2016, and Biden in 2020, a pattern that was particularly evident elsewhere in the Mountain West.[lower-alpha 1]
| Year | Republican | Democratic | Third parties |
|---|---|---|---|
| 2020 | 46.1% 8,579 | 48.8% 9,092 | 5.1% 946 |
| 2016 | 44.6% 7,602 | 40.4% 6,890 | 15.1% 2,568 |
| 2012 | 48.3% 7,866 | 45.8% 7,458 | 6.0% 976 |
| 2008 | 46.4% 7,936 | 50.5% 8,644 | 3.1% 537 |
| 2004 | 54.2% 9,006 | 42.8% 7,117 | 3.0% 501 |
| 2000 | 55.2% 7,814 | 35.8% 5,069 | 9.0% 1,268 |
| 1996 | 42.8% 5,967 | 45.9% 6,399 | 11.3% 1,570 |
| 1992 | 32.5% 4,176 | 44.4% 5,713 | 23.1% 2,978 |
| 1988 | 49.9% 5,653 | 48.4% 5,486 | 1.7% 196 |
| 1984 | 60.4% 7,452 | 38.1% 4,708 | 1.5% 186 |
| 1980 | 50.6% 5,830 | 32.7% 3,772 | 16.7% 1,925 |
| 1976 | 57.9% 6,734 | 40.1% 4,663 | 1.9% 225 |
| 1972 | 58.9% 7,021 | 40.9% 4,873 | 0.2% 23 |
| 1968 | 48.7% 4,422 | 44.9% 4,079 | 6.4% 578 |
| 1964 | 32.7% 2,923 | 67.3% 6,019 | |
| 1960 | 50.4% 4,356 | 49.6% 4,282 | |
| 1956 | 55.9% 4,315 | 44.1% 3,407 | |
| 1952 | 59.6% 4,560 | 40.3% 3,082 | 0.1% 10 |
| 1948 | 47.3% 2,858 | 52.0% 3,141 | 0.8% 46 |
| 1944 | 47.9% 2,970 | 52.1% 3,229 | |
| 1940 | 40.5% 2,756 | 59.1% 4,018 | 0.4% 30 |
| 1936 | 32.1% 1,777 | 66.5% 3,685 | 1.4% 77 |
| 1932 | 43.1% 2,281 | 50.4% 2,665 | 6.5% 343 |
| 1928 | 64.1% 2,941 | 35.3% 1,618 | 0.6% 27 |
| 1924 | 47.7% 2,164 | 16.4% 743 | 35.9% 1,628 |
| 1920 | 59.2% 1,769 | 38.3% 1,145 | 2.5% 76 |
| 1916 | 43.8% 1,313 | 52.5% 1,571 | 3.7% 111 |
| 1912 | 32.8% 882 | 38.8% 1,044 | 28.5% 767 |
| 1908 | 49.7% 1,335 | 42.9% 1,152 | 7.3% 197 |
| 1904 | 63.4% 1,674 | 26.7% 706 | 9.9% 260 |
| 1900 | 60.6% 1,540 | 39.4% 1,001 | |
| 1896 | 52.7% 1,220 | 46.4% 1,073 | 1.0% 22 |
| 1892 | 49.5% 1,100 | 50.5% 1,123 |
See also
- National Register of Historic Places listings in Albany County, Wyoming
- Mortenson Lake National Wildlife Refuge, the last home of the Wyoming toad, located in southern Albany County
Notes
- The other eleven are Butte County, California; Teton County, Idaho; Kendall County, Illinois; McLean County, Illinois; Tippecanoe County, Indiana; Kent County, Michigan; Leelanau County, Michigan; Carroll County, New Hampshire; Rockingham County, New Hampshire; Marion County, Oregon; and Grand County, Utah.
References
- "State & County QuickFacts". US Census Bureau. Archived from the original on June 6, 2011. Retrieved January 25, 2014.
- "Find a County". National Association of Counties. Archived from the original on May 31, 2011. Retrieved June 7, 2011.
- General Laws and Memorials and Resolutions of the Territory of Dakota, 1869 at Google Books
- Long, John H. (2006). "Wyoming: Individual County Chronologies". Wyoming Atlas of Historical County Boundaries. The Newberry Library. Archived from the original on July 18, 2011. Retrieved September 5, 2011.
- Long, John H. (2006). "Dakota Territory, South Dakota, and North Dakota: Individual County Chronologies". Dakota Territory Atlas of Historical County Boundaries. The Newberry Library. Archived from the original on November 12, 2007. Retrieved January 31, 2008.
- Urbanek, Mae (1988). Wyoming Place Names. Missoula MT: Mountain Press Publishing Co. ISBN 0-87842-204-8.
- "2010 Census Gazetteer Files". US Census Bureau. August 22, 2012. Retrieved August 5, 2015.
- "Population and Housing Unit Estimates". Retrieved September 28, 2019.
- "US Decennial Census". US Census Bureau. Retrieved August 5, 2015.
- "Historical Decennial Census Population for Wyoming Counties, Cities, and Towns". Wyoming Department of Administration & Information, Division of Economic Analysis. Retrieved January 25, 2014.
- "U.S. Census website". US Census Bureau. Retrieved May 14, 2011.
- "Profile of General Population and Housing Characteristics: 2010 Demographic Profile Data". US Census Bureau. Archived from the original on February 13, 2020. Retrieved January 12, 2016.
- "Population, Housing Units, Area, and Density: 2010 - County". US Census Bureau. Archived from the original on February 13, 2020. Retrieved January 12, 2016.
- "Selected Social Characteristics in the US – 2006-2010 American Community Survey 5-Year Estimates". US Census Bureau. Archived from the original on February 13, 2020. Retrieved January 12, 2016.
- "Selected Economic Characteristics – 2006-2010 American Community Survey 5-Year Estimates". US Census Bureau. Archived from the original on February 13, 2020. Retrieved January 12, 2016.
- Leip, David. "Atlas of US Presidential Elections". uselectionatlas.org. Retrieved April 5, 2018.
| Wikimedia Commons has media related to Albany County, Wyoming. |
Places adjacent to Albany County, Wyoming | |
|---|---|
Municipalities and communities of Albany County, Wyoming, United States | ||
|---|---|---|
| City | | |
| Town | ||
| CDPs | ||
| Unincorporated communities | ||
| ||
| Authority control |
|---|