Weston County, Wyoming
Weston County is a county in the U.S. state of Wyoming. As of the 2010 United States Census, the population was 7,208.[1] Its county seat is Newcastle.[2] Its east boundary line abuts the west line of the state of South Dakota.
Weston County | |
|---|---|
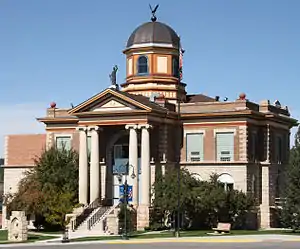 Weston County Courthouse in Newcastle | |
 Flag | |
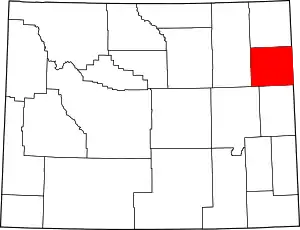 Location within the U.S. state of Wyoming | |
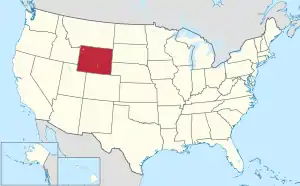 Wyoming's location within the U.S. | |
| Coordinates: 43°50′N 104°34′W | |
| Country | |
| State | |
| Founded | March 12, 1890 |
| Named for | Jefferson B. Weston |
| Seat | Newcastle |
| Largest city | Newcastle |
| Area | |
| • Total | 2,400 sq mi (6,000 km2) |
| • Land | 2,398 sq mi (6,210 km2) |
| • Water | 1.9 sq mi (5 km2) 0.08%% |
| Population (2010) | |
| • Total | 7,208 |
| • Estimate (2019) | 6,927 |
| • Density | 3.0/sq mi (1.2/km2) |
| Time zone | UTC−7 (Mountain) |
| • Summer (DST) | UTC−6 (MDT) |
| Congressional district | At-large |
| Website | westongov |
History
Weston County was created by the legislature of the Wyoming Territory on March 12, 1890, of land partitioned from Crook County.[3]
Weston County was named for John Weston, a geologist and surveyor.[4] In 1887, Jefferson Weston and Frank Mondell found rich coal deposits north of Newcastle which caused a railroad to be built through the area.
In 1911, Campbell County was formed from portions of Weston County and Crook County. Since then, the boundaries of Weston County have been stable.
Geography
According to the US Census Bureau, the county has a total area of 2,400 square miles (6,200 km2), of which 2,398 square miles (6,210 km2) is land and 1.9 square miles (4.9 km2) (0.08%) is water.[5]
Adjacent counties
- Crook County – north
- Lawrence County, South Dakota – northeast
- Pennington County, South Dakota – east
- Custer County, South Dakota – southeast
- Niobrara County – south
- Converse County – southwest
- Campbell County – west
Major highways
 U.S. Highway 16
 U.S. Highway 20
 U.S. Highway 85
 Wyoming Highway 116
 Wyoming Highway 450
 Wyoming Highway 585
National protected areas
- Black Hills National Forest (part)
- Thunder Basin National Grassland (part)
Demographics
| Historical population | |||
|---|---|---|---|
| Census | Pop. | %± | |
| 1890 | 2,422 | — | |
| 1900 | 3,203 | 32.2% | |
| 1910 | 4,960 | 54.9% | |
| 1920 | 4,631 | −6.6% | |
| 1930 | 4,673 | 0.9% | |
| 1940 | 4,958 | 6.1% | |
| 1950 | 6,733 | 35.8% | |
| 1960 | 7,929 | 17.8% | |
| 1970 | 6,307 | −20.5% | |
| 1980 | 7,106 | 12.7% | |
| 1990 | 6,518 | −8.3% | |
| 2000 | 6,644 | 1.9% | |
| 2010 | 7,208 | 8.5% | |
| 2019 (est.) | 6,927 | [6] | −3.9% |
| US Decennial Census[7] 1870–2000[8] 2010–2016[1] | |||
2000 census
As of the 2000 United States Census,[9] there were 6,644 people, 2,624 households, and 1,868 families in the county. The population density was 3 people per square mile (1/km2). There were 3,231 housing units at an average density of 1.3 per square mile (0.5/km2). The racial makeup of the county was 95.94% White, 0.12% Black or African American, 1.26% Native American, 0.20% Asian, 0.02% Pacific Islander, 0.93% from other races, and 1.54% from two or more races. 2.06% of the population were Hispanic or Latino of any race. 33.0% were of German, 13.0% English, 8.9% Irish and 7.2% American ancestry.
There were 2,624 households, out of which 31.10% had children under the age of 18 living with them, 60.40% were married couples living together, 7.30% had a female householder with no husband present, and 28.80% were non-families. 25.00% of all households were made up of individuals, and 11.50% had someone living alone who was 65 years of age or older. The average household size was 2.42 and the average family size was 2.88.
The county population contained 24.10% under the age of 18, 7.40% from 18 to 24, 26.30% from 25 to 44, 26.70% from 45 to 64, and 15.60% who were 65 years of age or older. The median age was 41 years. For every 100 females there were 103.10 males. For every 100 females age 18 and over, there were 103.80 males.
The median income for a household in the county was $32,348, and the median income for a family was $40,472. Males had a median income of $34,321 versus $18,640 for females. The per capita income for the county was $17,366. About 6.30% of families and 9.90% of the population were below the poverty line, including 11.30% of those under age 18 and 13.60% of those age 65 or over.
2010 census
As of the 2010 United States Census, there were 7,208 people, 3,021 households, and 1,957 families in the county.[10] The population density was 3.0 inhabitants per square mile (1.2/km2). There were 3,533 housing units at an average density of 1.5 per square mile (0.58/km2).[11] The racial makeup of the county was 95.5% white, 1.3% American Indian, 0.3% black or African American, 0.3% Asian, 0.9% from other races, and 1.7% from two or more races. Those of Hispanic or Latino origin made up 3.0% of the population.[10] In terms of ancestry, 31.7% were German, 19.3% were Irish, 18.5% were English, 6.6% were Norwegian, 6.1% were Swedish, and 5.6% were American.[12]
Of the 3,021 households, 26.1% had children under the age of 18 living with them, 53.2% were married couples living together, 6.9% had a female householder with no husband present, 35.2% were non-families, and 29.9% of all households were made up of individuals. The average household size was 2.28 and the average family size was 2.81. The median age was 42.3 years.[10]
The median income for a household in the county was $53,853 and the median income for a family was $63,438. Males had a median income of $53,095 versus $28,724 for females. The per capita income for the county was $28,463. About 5.8% of families and 7.9% of the population were below the poverty line, including 10.1% of those under age 18 and 10.1% of those age 65 or over.[13]
Communities
City
- Newcastle (county seat)
Town
Census-designated places
Other places
- Buckhorn[14]
- Clareton
- Four Corners
Government and infrastructure
Like all of the High Plains, and almost all of Wyoming, Weston County is overwhelmingly Republican. Since Wyoming statehood in 1890, it has been carried by a Democrat just three times. Woodrow Wilson carried the county in 1912 as a result of a split between the conservative incumbent William Howard Taft and Progressive ex-President Theodore Roosevelt, whilst in his two 1930s landslides Franklin D. Roosevelt became the other Democrat to win Weston County, although he defeated Republican Alf Landon in 1936 by just 109 votes.
Subsequent to Lyndon Johnson losing the county to Barry Goldwater by just fifty-four votes in 1964, no Democrat has passed 35 percent of Weston County's vote. Indeed, Bill Clinton in 1996 was the last to pass twenty percent for the Democratic Party, and his wife Hillary lost Weston – and most High Plains counties – by worse than a ten-to-one margin in 2016 against Donald Trump.
| Year | Republican | Democratic | Third parties |
|---|---|---|---|
| 2020 | 87.7% 3,107 | 10.2% 360 | 2.1% 75 |
| 2016 | 86.0% 3,033 | 8.5% 299 | 5.5% 194 |
| 2012 | 84.0% 2,821 | 12.6% 422 | 3.5% 116 |
| 2008 | 77.2% 2,618 | 19.4% 658 | 3.5% 117 |
| 2004 | 80.8% 2,739 | 17.1% 580 | 2.2% 73 |
| 2000 | 82.4% 2,521 | 14.7% 449 | 2.9% 90 |
| 1996 | 55.6% 1,763 | 27.4% 871 | 17.0% 540 |
| 1992 | 48.4% 1,465 | 24.0% 727 | 27.6% 835 |
| 1988 | 73.0% 1,988 | 25.7% 699 | 1.4% 37 |
| 1984 | 83.6% 2,614 | 15.4% 482 | 1.0% 31 |
| 1980 | 74.7% 2,219 | 19.7% 584 | 5.6% 167 |
| 1976 | 65.2% 1,770 | 34.4% 934 | 0.4% 10 |
| 1972 | 78.5% 2,063 | 19.8% 520 | 1.8% 46 |
| 1968 | 63.1% 1,497 | 25.7% 610 | 11.2% 266 |
| 1964 | 50.9% 1,473 | 49.1% 1,419 | |
| 1960 | 59.2% 1,743 | 40.8% 1,201 | |
| 1956 | 64.1% 1,837 | 36.0% 1,031 | |
| 1952 | 69.6% 1,931 | 30.3% 839 | 0.1% 4 |
| 1948 | 53.8% 962 | 46.0% 822 | 0.2% 4 |
| 1944 | 59.3% 1,097 | 40.7% 754 | |
| 1940 | 56.6% 1,292 | 43.1% 985 | 0.3% 7 |
| 1936 | 47.2% 1,084 | 52.0% 1,193 | 0.8% 18 |
| 1932 | 35.8% 840 | 62.2% 1,459 | 2.0% 47 |
| 1928 | 61.3% 1,127 | 37.4% 688 | 1.3% 24 |
| 1924 | 45.4% 794 | 18.1% 317 | 36.6% 640 |
| 1920 | 68.7% 1,073 | 29.6% 463 | 1.7% 27 |
| 1916 | 49.9% 791 | 46.3% 734 | 3.9% 61 |
| 1912 | 34.4% 449 | 35.2% 459 | 30.4% 397 |
| 1908 | 58.5% 723 | 38.6% 478 | 2.9% 36 |
| 1904 | 77.7% 810 | 21.2% 221 | 1.2% 12 |
| 1900 | 61.9% 548 | 38.2% 338 | |
| 1896 | 58.1% 451 | 41.1% 319 | 0.8% 6 |
| 1892 | 57.2% 294 | 42.8% 220 |
The Wyoming Department of Corrections Wyoming Honor Conservation Camp & Boot Camp is located in Newcastle.[16][17] The facility was operated by the Wyoming Board of Charities and Reform until that agency was dissolved as a result of a state constitutional amendment passed in November 1990.[18]
References
- "State & County QuickFacts". US Census Bureau. Archived from the original on January 30, 2016. Retrieved January 25, 2014.
- "Find a County". National Association of Counties. Retrieved June 7, 2011.
- Long, John H. (2006). "Wyoming: Individual County Chronologies". Wyoming Atlas of Historical County Boundaries. The Newberry Library. Archived from the original on July 18, 2011. Retrieved September 6, 2011.
- Urbanek, Mae (1988). Wyoming Place Names. Missoula MT: Mountain Press Publ. Co. ISBN 0-87842-204-8.
- "2010 Census Gazetteer Files". US Census Bureau. August 22, 2012. Retrieved August 18, 2015.
- "Population and Housing Unit Estimates". Retrieved September 28, 2019.
- "US Decennial Census". US Census Bureau. Retrieved August 18, 2015.
- "Historical Decennial Census Population for Wyoming Counties, Cities, and Towns". Wyoming Department of Administration & Information, Division of Economic Analysis. Retrieved January 25, 2014.
- "U.S. Census website". US Census Bureau. Retrieved May 14, 2011.
- "Profile of General Population and Housing Characteristics: 2010 Demographic Profile Data". US Census Bureau. Archived from the original on February 13, 2020. Retrieved January 12, 2016.
- "Population, Housing Units, Area, and Density: 2010 - County". US Census Bureau. Archived from the original on February 13, 2020. Retrieved January 12, 2016.
- "Selected Social Characteristics in the US – 2006-2010 American Community Survey 5-Year Estimates". US Census Bureau. Archived from the original on February 13, 2020. Retrieved January 12, 2016.
- "Selected Economic Characteristics – 2006-2010 American Community Survey 5-Year Estimates". US Census Bureau. Archived from the original on February 13, 2020. Retrieved January 12, 2016.
- (Buckhorn, Weston County WY) Google Maps (accessed 14 January 2019)
- Dave Leip's US Election Atlas; 2016 Presidential General Election Results – Weston County, WY (and earlier years)
- Contact Institutions. Wyoming Department of Corrections. Retrieved August 22, 2010.
- Newcastle city, Wyoming. US Census Bureau. Retrieved December 12, 2010.
- About the Department of Corrections. Wyoming Department of Corrections. Retrieved August 22, 2010.
External links
| Wikimedia Commons has media related to Weston County, Wyoming. |
Places adjacent to Weston County, Wyoming | |
|---|---|
Municipalities and communities of Weston County, Wyoming, United States | ||
|---|---|---|
| City | | |
| Town | ||
| CDPs | ||
| Unincorporated communities | ||
| Ghost towns | ||
| ||
| Authority control |
|---|