Sheridan County, Wyoming
Sheridan County is a county in the U.S. state of Wyoming. As of the 2010 United States Census, the population was 29,116.[1] The county seat is Sheridan.[2] Its northern boundary abuts the Montana state border.
Sheridan County | |
|---|---|
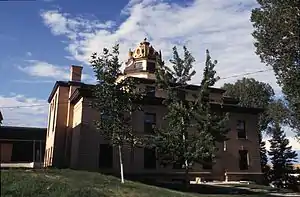 Sheridan County Courthouse | |
 Flag | |
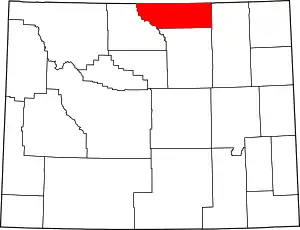 Location within the U.S. state of Wyoming | |
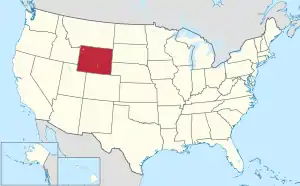 Wyoming's location within the U.S. | |
| Coordinates: 44°47′N 106°53′W | |
| Country | |
| State | |
| Founded | March 9, 1888 |
| Named for | Philip Sheridan |
| Seat | Sheridan |
| Largest city | Sheridan |
| Area | |
| • Total | 2,527 sq mi (6,540 km2) |
| • Land | 2,524 sq mi (6,540 km2) |
| • Water | 3.1 sq mi (8 km2) 0.1%% |
| Population (2010) | |
| • Total | 29,116 |
| • Estimate (2019) | 30,485 |
| • Density | 12/sq mi (4.4/km2) |
| Time zone | UTC−7 (Mountain) |
| • Summer (DST) | UTC−6 (MDT) |
| Congressional district | At-large |
| Website | www |
Sheridan County comprises the Sheridan, WY Micropolitan Statistical Area.
History
Sheridan County was created by the legislature of the Wyoming Territory on March 9, 1888.[3] The county was formed from a portion of Johnson County. Sheridan County was named for Philip Sheridan, a general in the American Civil War and controversial Indian fighter.[4]
A portion of Sheridan County was annexed in 1897 to create Big Horn County. Sheridan County boundary lines were also slightly altered in 1911, and again in 1929, after which it has retained its boundary lines to the present time.
Geography
According to the US Census Bureau, the county has a total area of 2,527 square miles (6,540 km2), of which 2,524 square miles (6,540 km2) is land and 3.1 square miles (8.0 km2) (0.1%) is water.[5]
Adjacent counties
- Big Horn County, Montana – north
- Powder River County, Montana – northeast
- Campbell County – east
- Johnson County – south
- Big Horn County – west
Major highways
.svg.png.webp) Interstate 90
Interstate 90 I-90 Bus.
 U.S. Highway 14
 U.S. Highway 16
 U.S. Highway 87
 Wyoming Highway 330
 Wyoming Highway 331
 Wyoming Highway 332
 Wyoming Highway 334
 Wyoming Highway 335
 Wyoming Highway 336
 Wyoming Highway 337
 Wyoming Highway 338
 Wyoming Highway 339
 Wyoming Highway 341
 Wyoming Highway 342
 Wyoming Highway 343
 Wyoming Highway 345
National protected area
- Bighorn National Forest (part)
Demographics
| Historical population | |||
|---|---|---|---|
| Census | Pop. | %± | |
| 1890 | 1,972 | — | |
| 1900 | 5,122 | 159.7% | |
| 1910 | 16,324 | 218.7% | |
| 1920 | 18,182 | 11.4% | |
| 1930 | 16,875 | −7.2% | |
| 1940 | 19,255 | 14.1% | |
| 1950 | 20,185 | 4.8% | |
| 1960 | 18,989 | −5.9% | |
| 1970 | 17,852 | −6.0% | |
| 1980 | 25,048 | 40.3% | |
| 1990 | 23,562 | −5.9% | |
| 2000 | 26,560 | 12.7% | |
| 2010 | 29,116 | 9.6% | |
| 2019 (est.) | 30,485 | [6] | 4.7% |
| US Decennial Census[7] 1870–2000[8] 2010–2016[1] | |||
2000 census
As of the 2000 United States Census,[9] of 2000, there were 26,560 people, 11,167 households, and 7,079 families in the county. The population density was 10/sq mi (4/km2). There were 12,577 housing units at an average density of 5/sq mi (2/km2). The racial makeup of the county was 95.88% White, 0.18% Black or African American, 1.27% Native American, 0.38% Asian, 0.12% Pacific Islander, 0.82% from other races, and 1.34% from two or more races. 2.43% of the population were Hispanic or Latino of any race. 24.8% were of German, 12.3% English, 10.3% Irish, 7.1% American, 6.0% Norwegian and 5.1% Polish ancestry.
There were 11,167 households, out of which 28.40% had children under the age of 18 living with them, 52.00% were married couples living together, 8.20% had a female householder with no husband present, and 36.60% were non-families. 30.90% of all households were made up of individuals, and 12.50% had someone living alone who was 65 years of age or older. The average household size was 2.31 and the average family size was 2.90.
The county population contained 24.10% under the age of 18, 8.00% from 18 to 24, 25.30% from 25 to 44, 27.10% from 45 to 64, and 15.50% who were 65 years of age or older. The median age was 41 years. For every 100 females there were 95.90 males. For every 100 females age 18 and over, there were 94.00 males.
The median income for a household in the county was $34,538, and the median income for a family was $42,669. Males had a median income of $31,381 versus $20,354 for females. The per capita income for the county was $19,407. About 8.60% of families and 10.70% of the population were below the poverty line, including 14.40% of those under age 18 and 6.40% of those age 65 or over.
2010 census
As of the 2010 United States Census, there were 29,116 people, 12,360 households, and 7,701 families in the county.[10] The population density was 11.5 inhabitants per square mile (4.4/km2). There were 13,939 housing units at an average density of 5.5 per square mile (2.1/km2).[11] The racial makeup of the county was 95.4% white, 1.2% American Indian, 0.7% Asian, 0.4% black or African American, 0.1% Pacific islander, 0.7% from other races, and 1.5% from two or more races. Those of Hispanic or Latino origin made up 3.5% of the population.[10] In terms of ancestry, 31.5% were German, 16.3% were Irish, 11.8% were English, 7.5% were American, 6.2% were Norwegian, and 5.1% were Polish.[12]
Of the 12,360 households, 27.5% had children under the age of 18 living with them, 49.8% were married couples living together, 8.4% had a female householder with no husband present, 37.7% were non-families, and 30.9% of all households were made up of individuals. The average household size was 2.27 and the average family size was 2.84. The median age was 41.9 years.[10]
The median income for a household in the county was $48,141 and the median income for a family was $61,959. Males had a median income of $45,035 versus $30,780 for females. The per capita income for the county was $26,756. About 5.2% of families and 8.5% of the population were below the poverty line, including 8.1% of those under age 18 and 7.2% of those age 65 or over.[13]
Government and infrastructure
The Wyoming Department of Family Services Juvenile Services Division operates the Wyoming Girls' School, located near Sheridan.[20][21] The facility was operated by the Wyoming Board of Charities and Reform until that agency was dissolved as a result of a state constitutional amendment passed in November 1990.[22]
Sheridan County voters have been reliably Republican for decades. In only one national election since 1948 has the county selected the Democratic Party candidate (as of 2020).
| Year | Republican | Democratic | Third parties |
|---|---|---|---|
| 2020 | 72.1% 11,843 | 24.6% 4,043 | 3.3% 542 |
| 2016 | 70.8% 10,266 | 20.2% 2,927 | 9.1% 1,317 |
| 2012 | 71.7% 10,267 | 25.3% 3,618 | 3.1% 437 |
| 2008 | 67.9% 10,177 | 29.8% 4,458 | 2.3% 346 |
| 2004 | 69.1% 9,689 | 29.0% 4,066 | 2.0% 274 |
| 2000 | 68.9% 8,424 | 27.2% 3,330 | 3.9% 482 |
| 1996 | 48.9% 5,892 | 38.1% 4,594 | 13.0% 1,560 |
| 1992 | 37.2% 4,303 | 35.8% 4,139 | 27.0% 3,123 |
| 1988 | 55.5% 5,980 | 43.2% 4,655 | 1.3% 143 |
| 1984 | 66.1% 7,460 | 32.3% 3,648 | 1.5% 171 |
| 1980 | 58.6% 5,649 | 31.5% 3,034 | 10.0% 963 |
| 1976 | 62.2% 5,382 | 37.1% 3,206 | 0.7% 64 |
| 1972 | 69.0% 6,432 | 30.8% 2,874 | 0.1% 12 |
| 1968 | 61.2% 5,163 | 31.5% 2,659 | 7.3% 612 |
| 1964 | 48.6% 4,491 | 51.4% 4,747 | |
| 1960 | 60.1% 5,690 | 40.0% 3,786 | |
| 1956 | 63.4% 5,546 | 36.6% 3,204 | |
| 1952 | 67.6% 6,522 | 32.4% 3,124 | 0.1% 9 |
| 1948 | 48.7% 3,698 | 50.7% 3,852 | 0.7% 51 |
| 1944 | 49.6% 3,802 | 50.4% 3,862 | |
| 1940 | 46.1% 3,814 | 53.7% 4,439 | 0.2% 15 |
| 1936 | 35.5% 2,726 | 61.6% 4,731 | 2.9% 223 |
| 1932 | 38.3% 2,738 | 59.7% 4,260 | 2.0% 144 |
| 1928 | 57.9% 3,616 | 41.0% 2,563 | 1.1% 71 |
| 1924 | 42.8% 2,530 | 18.8% 1,115 | 38.4% 2,272 |
| 1920 | 60.4% 2,645 | 27.2% 1,192 | 12.3% 540 |
| 1916 | 37.9% 1,914 | 57.6% 2,906 | 4.5% 228 |
| 1912 | 20.3% 862 | 38.8% 1,649 | 40.9% 1,737[lower-alpha 1] |
| 1908 | 55.0% 2,158 | 39.2% 1,539 | 5.8% 227 |
| 1904 | 59.5% 1,905 | 33.4% 1,068 | 7.2% 229 |
| 1900 | 49.8% 1,018 | 48.2% 985 | 2.0% 41 |
| 1896 | 44.0% 877 | 55.4% 1,104 | 0.6% 11 |
| 1892 | 46.4% 509 | 53.7% 589 |
Notes
- The leading "other" candidate, Progressive Theodore Roosevelt, received 1,305 votes, while Socialist candidate Eugene Debs received 398 votes, Prohibition candidate Eugene Chafin received 34 votes.
Further reading
- Georgen, Cynde. In the Shadow of the Bighorns: A History of Early Sheridan and the Goose Creek Valley of Northern Wyoming. Sheridan, Wyoming: Sheridan County Historical Society, 2010. ISBN 978-0-9792871-7-6.
- Georgen, Cynde. Snippets of Sheridan County History: 366 Newsy Little Stories from the First 125 Years of Sheridan County, Wyoming, 1888-2013. Sheridan, Wyoming: Sheridan County Historical Society, 2013. ISBN 978-0-9792871-8-3.
External links
References
- "State & County QuickFacts". US Census Bureau. Archived from the original on July 18, 2011. Retrieved January 25, 2014.
- "Find a County". National Association of Counties. Retrieved June 7, 2011.
- Long, John H. (2006). "Wyoming: Individual County Chronologies". Wyoming Atlas of Historical County Boundaries. The Newberry Library. Archived from the original on July 18, 2011. Retrieved September 6, 2011.
- Urbanek, Mae (1988). Wyoming Place Names. Missoula MT: Mountain Press Pub. Co. ISBN 0-87842-204-8.
- "2010 Census Gazetteer Files". US Census Bureau. August 22, 2012. Retrieved August 18, 2015.
- "Population and Housing Unit Estimates". Retrieved September 28, 2019.
- "US Decennial Census". US Census Bureau. Retrieved August 18, 2015.
- "Historical Decennial Census Population for Wyoming Counties, Cities, and Towns". Wyoming Department of Administration & Information, Division of Economic Analysis. Retrieved January 25, 2014.
- "U.S. Census website". US Census Bureau. Retrieved May 14, 2011.
- "Profile of General Population and Housing Characteristics: 2010 Demographic Profile Data". US Census Bureau. Archived from the original on February 13, 2020. Retrieved January 12, 2016.
- "Population, Housing Units, Area, and Density: 2010 - County". US Census Bureau. Archived from the original on February 13, 2020. Retrieved January 12, 2016.
- "Selected Social Characteristics in the US – 2006-2010 American Community Survey 5-Year Estimates". US Census Bureau. Archived from the original on February 13, 2020. Retrieved January 12, 2016.
- "Selected Economic Characteristics – 2006-2010 American Community Survey 5-Year Estimates". US Census Bureau. Archived from the original on February 13, 2020. Retrieved January 12, 2016.
- Acme WY Google Maps (accessed 13 January 2019)
- Beckton WY Google Maps (accessed 13 January 2019)
- Burgess Junction WY Google Maps (accessed 13 January 2019)
- Kleenburn WY Google Maps (accessed 13 January 2019)
- Ucross WY Google Maps (accessed 13 January 2019)
- Ulm WY Google Maps (accessed 13 January 2019)
- Wyoming Girls’ School. Wyoming Department of Family Services. Retrieved on August 22, 2010.
- Sheridan city, Wyoming. US Census Bureau. Retrieved on December 12, 2010.
- About the Department of Corrections. Wyoming Department of Corrections. Retrieved on August 22, 2010.
- Leip, David. "Atlas of US Presidential Elections". uselectionatlas.org. Retrieved April 5, 2018.
| Wikimedia Commons has media related to Sheridan County, Wyoming. |
Places adjacent to Sheridan County, Wyoming | ||||||||||
|---|---|---|---|---|---|---|---|---|---|---|
| ||||||||||
Municipalities and communities of Sheridan County, Wyoming, United States | ||
|---|---|---|
| City | | |
| Towns | ||
| CDPs | ||
| Unincorporated communities | ||
| ||
| Authority control |
|---|