Atheism in the United States
According to the Pew Research Center in a 2014 survey, self-identified "atheists" make up 3.1% of the US population, even though 9% of Americans agreed with the statement "Do not believe in God" while 2% agreed with the statement "Do not know if they believe in God".[4]
| Part of a series on |
| Atheism |
|---|
|
According to the 2014 General Sociological Survey, the number of atheists and agnostics in the U.S. grew over the previous 23 years. In 1991, only 2% identified as atheist, and 4% identified as agnostic; while in 2014, 3.1% identified as atheists, and 5% identified as agnostics.[5]
In 2009, Pew stated that only 5% of the US population did not have a belief in a god and out of that small group only 24% self-identified as "atheist", while 15% self-identified as "agnostic" and 35% self-identified as "nothing in particular".[6]
According to the 2008 ARIS, only 2% the US population was atheist, while 10% were agnostics.[7]
In one 2018 research paper using indirect methods estimated that 26% of Americans are atheists, which is much higher than the 3%-11% rates that are consistently found in surveys.[8] However, methodological problems have been identified with this particular study since people do not have binary relationships to questions on God and instead have more complex responses to such questions.[9]
Accurate demographics of atheism are difficult to obtain since conceptions of atheism and self-identification are context dependent by culture.[10]
Demographics
Age
| Age group | % of lack of belief in god/gods | % of self described atheists | Source | ||
|---|---|---|---|---|---|
| 18-29 year old Americans | 16 | 6 | [4] | ||
| 30-49 year old Americans | 9 | 3 | [4] | ||
| Americans | 9 | 3.1 | [4] | ||
| 50-64 year old Americans | 6 | 2 | [4] | ||
| 65+ year old Americans | 6 | 2 | [4] | ||
Education
| Highest degree earned | % of lack of belief in god/gods | % of self described atheists | Source | ||
|---|---|---|---|---|---|
| Post-graduate degree, Americans | 14 | 5 | [4] | ||
| College graduate, Americans | 14 | 5 | [4] | ||
| Americans | 9 | 3.1 | [4] | ||
| Some college, Americans | 9 | 3 | [4] | ||
| High school or less, Americans | 6 | 2 | [4] | ||
Gender
| Gender | % of lack of belief in god/gods | % of self described atheists | Source | ||
|---|---|---|---|---|---|
| Male American | 12 | 4 | [4] | ||
| Americans | 9 | 3.1 | [4] | ||
| Female American | 6 | 2 | [4] | ||
Generation
| Generation | % of lack of belief in god/gods | % of self described atheists | Source | ||
|---|---|---|---|---|---|
| Younger Millennial Americans | 17 | 6 | [4] | ||
| Older Millennial Americans | 13 | 4 | [4] | ||
| Americans | 9 | 3.1 | [4] | ||
| Generation X Americans | 9 | 3 | [4] | ||
| Greatest Americans | 7 | 2 | [4] | ||
| Baby Boomer Americans | 6 | 2 | [4] | ||
| Silent Americans | 6 | 1 | [4] | ||
Household income
| Cohort | % of lack of belief in god/gods | % of self described atheists | Source | ||
|---|---|---|---|---|---|
| $100,000 or more, Americans | 14 | 5 | [4] | ||
| $50,000-$99,999, Americans | 11 | 3 | [4] | ||
| $30,000-$49,999, Americans | 9 | 3 | [4] | ||
| Americans | 9 | 3.1 | [4] | ||
| Less than $30,000, Americans | 7 | 2 | [4] | ||
Immigrant status
| Generation | % of lack of belief in god/gods | % of self described atheists | Source | ||
|---|---|---|---|---|---|
| Second generation Americans | 14 | 4 | [4] | ||
| Americans | 9 | 3.1 | [4] | ||
| Third generation or higher Americans | 9 | 3 | [4] | ||
| Immigrants | 8 | 3 | [4] | ||
Marital status
| Cohort | % of lack of belief in god/gods | % of self described atheists | Source | ||
|---|---|---|---|---|---|
| Never married Americans | 15 | 5 | [4] | ||
| Living with a partner Americans | 14 | 5 | [4] | ||
| Americans | 9 | 3.1 | [4] | ||
| Married Americans | 7 | 2 | [4] | ||
| Divorced/separated Americans | 6 | 2 | [4] | ||
| Widowed Americans | 3 | 1 | [4] | ||
Metro area
| State/federal district | % of lack of belief in god/gods | % of self described atheists | Source | ||
|---|---|---|---|---|---|
| Greater San Francisco Bay Area | 21 | 5 | [4] | ||
| Seattle metropolitan area | 20 | 10 | [4] | ||
| Boston metropolitan area | 17 | 4 | [4] | ||
| Providence metropolitan area | 15 | 4 | [4] | ||
| Baltimore metropolitan area | 14 | 3 | [4] | ||
| Philadelphia metropolitan area | 13 | 5 | [4] | ||
| Tampa metropolitan area | 13 | 4 | [4] | ||
| San Diego metropolitan area | 12 | 3 | [4] | ||
| Washington metropolitan area | 12 | 4 | [4] | ||
| Greater Los Angeles Area | 11 | 4 | [4] | ||
| New York metropolitan area | 11 | 4 | [4] | ||
| Phoenix metropolitan area | 11 | 3 | [4] | ||
| Chicago metropolitan area | 10 | 3 | [4] | ||
| Americans | 9 | 3.1 | [4] | ||
| Detroit metropolitan area | 9 | 3 | [4] | ||
| Miami metropolitan area | 9 | 3 | [4] | ||
| Riverside metropolitan area | 8 | 1 | [4] | ||
| Dallas–Fort Worth metroplex | 7 | 1 | [4] | ||
| Atlanta metropolitan area | 6 | 3 | [4] | ||
| Houston metropolitan area | 6 | 2 | [4] | ||
| St. Louis metropolitan area | 6 | 3 | [4] | ||
| Pittsburgh metropolitan area | 5 | 3 | [4] | ||
Political affiliation
| Political affiliation | % of lack of belief in god/gods | % of self described atheists | Source | ||
|---|---|---|---|---|---|
| Democrat/Lean Democrat Americans | 13 | 5 | [4] | ||
| Americans | 9 | 3.1 | [4] | ||
| No lean, Americans | 9 | 3 | [4] | ||
| Republican/Lean Republican Americans | 5 | 1 | [4] | ||
Parental status
| Parental status | % of lack of belief in god/gods | % of self described atheists | Source | ||
|---|---|---|---|---|---|
| Non-parents of children under 18 year old Americans | 10 | 3 | [4] | ||
| Americans | 9 | 3.1 | [4] | ||
| Parents of children under 18 year old Americans | 7 | 2 | [4] | ||
Political ideology
| Political ideology | % of lack of belief in god/gods | % of self described atheists | Source | ||
|---|---|---|---|---|---|
| Liberal Americans | 19 | 7 | [4] | ||
| Americans | 9 | 3.1 | [4] | ||
| Moderate Americans | 9 | 3 | [4] | ||
| Don't know, Americans | 8 | [4] | |||
| Conservative Americans | 3 | 1 | [4] | ||
Race
| Racial group | % of lack of belief in god/gods | % of self described atheists | Source | ||
|---|---|---|---|---|---|
| Asian Americans | 19 | 6 | [4] | ||
| White Americans | 11 | 4 | [4] | ||
| Americans | 9 | 3.1 | [4] | ||
| Other/Mixed Americans | 8 | 2 | [4] | ||
| Latino Americans | 6 | 2 | [4] | ||
| African Americans | 2 | 1 | [4] | ||
Region
| State/federal district | % of lack of belief in god/gods | % of self described atheists | Source | ||
|---|---|---|---|---|---|
| Northeastern United States | 12 | 4 | [4] | ||
| Western United States | 12 | 4 | [4] | ||
| Americans | 9 | 3.1 | [4] | ||
| Midwestern United States | 8 | 3 | [4] | ||
| Southern United States | 7 | 2 | [4] | ||
Religion
Sexual orientation
| Sexual orientation | % of self described atheists | Source | |
|---|---|---|---|
| LGBT Americans | 8 | [4] | |
| Americans | 3.1 | [4] | |
| Straight Americans | 3 | [4] | |
State/federal district

| State/federal district | % of lack of belief in god/gods | % of self described atheists | Source | ||||
|---|---|---|---|---|---|---|---|
| # of population | # of population | ||||||
| 131,406 | 21 | 43,802 | 7 | [4][3] | |||
| 1,178,573 | 18 | 327,381 | 5 | [4][3] | |||
| 212,538 | 16 | 26,567 | 2 | [4][3] | |||
| 210,635 | 16 | 78,988 | 6 | [4][3] | |||
| 84,241 | 14 | 24,069 | 4 | [4][3] | |||
| 498,040 | 13 | 191,554 | 5 | [4][3] | |||
| 874,190 | 13 | 336,227 | 5 | [4][3] | |||
| 85,228 | 12 | 35,512 | 5 | [4][3] | |||
| 4,470,475 | 12 | 1,490,158 | 4 | [4][3] | |||
| 427,834 | 12 | 178,264 | 5 | [4][3] | |||
| 324,066 | 12 | 135,028 | 5 | [4][3] | |||
| 682,438 | 12 | 170,610 | 3 | [4][3] | |||
| 2,131,591 | 11 | 968,905 | 5 | [4][3] | |||
| 172,434 | 11 | 31,352 | 2 | [4][3] | |||
| 226,510 | 11 | 61,775 | 3 | [4][3] | |||
| 115,782 | 11 | 42,103 | 4 | [4][3] | |||
| 639,202 | 10 | 191,761 | 3 | [4][3] | |||
| 502,920 | 10 | 201,168 | 4 | [4][3] | |||
| 1,880,131 | 10 | 564,039 | 3 | [4][3] | |||
| 648,380 | 10 | 194,514 | 3 | [4][3] | |||
| 577,355 | 10 | 173,207 | 3 | [4][3] | |||
| 1,270,238 | 10 | 381,071 | 3 | [4][3] | |||
| 122,427 | 9 | 27,206 | 2 | [4][3] | |||
| 1,154,757 | 9 | 384,919 | 3 | [4][3] | |||
| 274,172 | 9 | 121,854 | 4 | [4][3] | |||
| 889,528 | 9 | 296,509 | 3 | [4][3] | |||
| 477,353 | 9 | 159,118 | 3 | [4][3] | |||
| 164,371 | 9 | 18,263 | 1 | [4][3] | |||
| 27,787,098 | 9 | 9,571,112 | 3.1 | [4][3] | |||
| 79,153 | 8 | 39,577 | 4 | [4][3] | |||
| 703,352 | 8 | 175,838 | 2 | [4][3] | |||
| 53,807 | 8 | 13,452 | 2 | [4][3] | |||
| 221,111 | 8 | 82,917 | 3 | [4][3] | |||
| 640,082 | 8 | 160,020 | 2 | [4][3] | |||
| 303,756 | 7 | 173,574 | 4 | [4][3] | |||
| 62,855 | 7 | 17,959 | 2 | [4][3] | |||
| 199,718 | 7 | 57,062 | 2 | [4][3] | |||
| 667,484 | 7 | 190,710 | 2 | [4][3] | |||
| 807,555 | 7 | 230,730 | 2 | [4][3] | |||
| 56,993 | 7 | 24,425 | 3 | [4][3] | |||
| 581,259 | 6 | 193,753 | 2 | [4][3] | |||
| 272,002 | 6 | 90,667 | 2 | [4][3] | |||
| 359,336 | 6 | 119,779 | 2 | [4][3] | |||
| 1,508,734 | 6 | 502,911 | 2 | [4][3] | |||
| 33,818 | 6 | 16,909 | 3 | [4][3] | |||
| 231,268 | 5 | 46,254 | 1 | [4][3] | |||
| 92,650 | 5 | 18,530 | 1 | [4][3] | |||
| 116,637 | 4 | 58,318 | 2 | [4][3] | |||
| 118,692 | 4 | 29,673 | 1 | [4][3] | |||
| 190,383 | 3 | 63,461 | 1 | [4][3] | |||
| 95,595 | 2 | 47,797 | 1 | [4][3] | |||
Public officials
United States Representatives

United States Senators
| Photo | Name | State | Position | Party | Term | Source |
|---|---|---|---|---|---|---|
 | Thomas Gore | Oklahoma | United States Senator from Oklahoma | Democratic | 1907–1921
1931, 1937 |
[14] |
Governors
| Photo | Name | State | Position | Party | Term | Source | |
|---|---|---|---|---|---|---|---|
 | Culbert Olson | California | 29th Governor of California | Democratic | 1939–1943 | [15] | |
 | Jesse Ventura | Minnesota | 38th Governor of Minnesota | Reform (1998-2000) | Independence (2000-2003) | 1999–2003 | [16] |
State legislators
| Photo | Name | State | Position | Party | Term | Source |
|---|---|---|---|---|---|---|
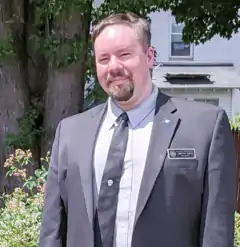 | Timothy Smith | New Hampshire | New Hampshire State Representative | Democratic | 2012-Present | [17] |
| Culbert Olson | California | California State Senator | Democratic | 1934–1938 | [15] |
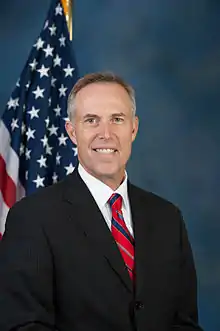 | Jared Huffman | California | California State Assembly, 2nd district | Democratic | 2006–2012 | [12] |
 | Sean Faircloth | Maine | Maine Representative, 17th and 117th districts | Democratic | 1992–1994 2002–2008 1994–1996 |
|
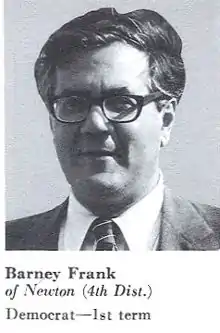 | Barney Frank | Massachusetts | Massachusetts State Representative, 5th and 8th Suffolk districts | Democratic | 1973–1981 | [13] |
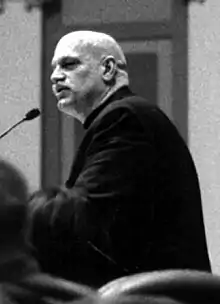
| Ernie Chambers | Nebraska | Nebraska State Senator, 11th district | Independent | 1971–2009 2013–present | [18] | |
 | Lori Lipman Brown | Nevada | Nevada State Senator | Democratic | 1992–1994 | [19] |
| Andrew Zwicker | New Jersey | New Jersey General Assembly, 16th District | Democratic | 2016–present | [20] | |
| Culbert Olson | Utah | Utah State Senator | Democratic | 1916–1920 | [15] |
Mayors
| Photo | Name | State | Position | Party | Term | Source |
|---|---|---|---|---|---|---|
| Jesse Ventura | Minnesota | Mayor of Brooklyn Park, Minnesota | Independent | 1991–1995 | [16] |
 | Rocky Anderson | Utah | 33rd Mayor of Salt Lake City, Utah | Democratic | 2000–2008 | [21] |
City councils
| Photo | Name | State | Position | Party | Term | Source |
|---|---|---|---|---|---|---|
| Sean Faircloth | Maine | Chair of the City Council of Bangor | Democratic | 2016–present | |
 | Cecil Bothwell | North Carolina | City councilor of Asheville | Democratic | 2009–2017 | |
Political views
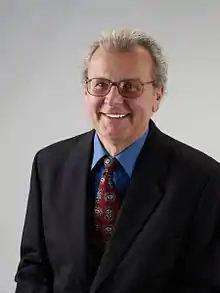
Rocky Anderson, founder of the Justice Party |
 Douglas Campbell, co-founder of the Godless Americans Political Action Committee |
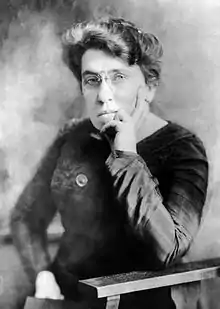 Emma Goldman, founder of anarcho-feminism |
 James P. Cannon, co-founder of the Communist League of America |
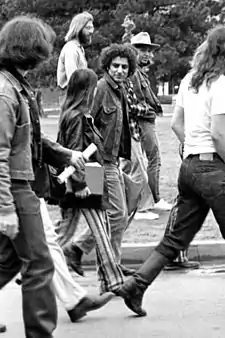 Abbie Hoffman, co-founder of the Youth International Party |
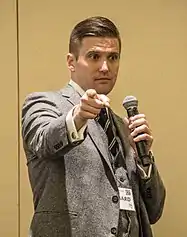 Richard B. Spencer, founder of the alt-right |
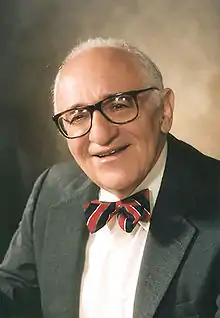 Murray Rothbard, founder of anarcho-capitalism |
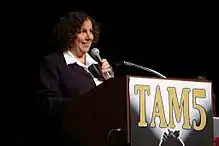
 Cenk Uygur, co-founder of the Justice Democrats |
Views of atheists
A June–September 2014 Pew Research Center survey found that 69% of atheist Americans identity as Democratic or lean Democratic, 17% have no lean, 15% identify as Republican, 56% liberal, 29% moderate, 10% conservative, and 5% don't know. Among Americans who don't believe in god/gods, 65% identity as Democratic or lean Democratic, 17% have no lean, 18% identity as Republican, 50% liberal, 31% moderate, 13% conservative, and 6% don't know. That makes atheist and nonbelievers in god/gods Americans as belief groups to be the most politically liberal belief group in America and the least politically aligned belief group with Republicans and conservatism in the United States.[4]
Views about atheists
In 2014, a Pew survey found that 53% of Americans claimed they would be less likely to vote for a presidential candidate who was an atheist.[22]
Groups that include atheists
A October 2013 Public Religion Research Institute American Values Survey found 58% of American libertarians report they believe in a personal god, 25% believe god is an impersonal force in the universe, and 16% report that they do not believe in a god. It also found 73% of Americans who identify with the Tea Party report they believe in a personal god, 19% believe god is an impersonal force in the universe, and 6% report that they do not believe in a god. It also found 90% of white evangelical Protestants report they believe in a personal god, 8% believe god is an impersonal force in the universe, and less than 1% report that they do not believe in a god.[23]
List of atheist Americans
Organizations
- American Atheists
- Atheist Alliance International
- Freedom From Religion Foundation
- Freethinking Atheist and Agnostic Kinship
- International League of non-religious and atheists
- Internet Infidels
- Military Association of Atheists & Freethinkers
- Rational Response Squad
- Recovering from Religion
- The Clergy Project
See also
References
- "The Size of the U.S. and the World in 2016".
- Inc., Gallup (2007-06-08). "Religion".
- Bureau, U.S. Census. "U.S. Census website". United States Census Bureau. Retrieved 2017-03-22.
- "Religious Landscape Study". Pew Research Center. 2014. Retrieved August 21, 2018.
- Hout, Michael; Smith, Tom (March 2015). "Fewer Americans Affiliate with Organized Religions, Belief and Practice Unchanged: Key Findings from the 2014 General Social Survey" (PDF). General Social Survey. NORC.
The percentage answering 'no religion' was 21 percent in 2014, 20 percent in 2012, just 14 percent as recently as 2000, and only 8 percent in 1990." & "In 2014, 3 percent of Americans did not believe in God and 5 percent expressed an agnostic view; the comparable percentages were 2 percent and 4 percent in 1991. More people believed in a 'higher power' in 2014 (13%) than in 1991 (7%).
- "Not All Nonbelievers Call Themselves Atheists | Pew Research Center's Religion & Public Life Project". Pewforum.org. 2009-04-02. Retrieved 2014-02-27.
- Kosmin, Barry; Keysar, Ariela (2009). "American Nones: The Profile of the No Religion Population" (PDF). Trinity Colloge.
- Gervais, Will M.; Najle, Maxine B. (2018). "How many atheists are there?". Social Psychological and Personality Science. 9: 3–10. doi:10.1177/1948550617707015.
- Resnick, Brian (13 April 2017). "How many American atheists are there really?". Vox. Vox Media. Vox Media. Retrieved 22 April 2017.
- Zuckerman, Phil (2007), "Atheism: Contemporary Rates and Patterns", Cambridge Companion to Atheism, pp. 47–66, doi:10.1017/CCOL0521842700.004
- Stark called himself "a Unitarian who does not believe in a supreme being" and has been identified as an atheist. Rep. Stark applauded for atheist outlook: Believed to be first congressman to declare nontheism, Associated Press, March 13, 2007 (Accessed June 15, 2007)
- "lawmaker isn't sure that God exists. Now, he's finally decided to tell people".
- Wong, Curtis (2013-08-09). "Barney Frank's 'Pot-Smoking Atheist' Revelation Discussed On 'The Rubin Report'". The Huffington Post. Retrieved 2013-08-09.
- "FFRF & Tulsa nontheists salute Gore as first atheist senator". September 7, 2010.
- The Hon. Atheist Governor: Culbert L. Olson Archived 2008-09-23 at the Wayback Machine
- "Jesse Ventura". NNDB.com. Retrieved 25 April 2012.
Formerly a Lutheran, Ventura generally considers himself an atheist.
- ""Humanist PAC Marks Gains for Atheists and Freethinkers – and Hope for All Americans in Future Elections"". Freethought Equality. 2020. Retrieved Dec 20, 2020.
- Hammel, Paul. "Ernie Chambers targets 'so help me God' in oaths". Omaha World-Herald. Archived from the original on 4 September 2013. Retrieved 4 September 2013.
- ""You can be elected as an openly gay politician in this country, but you can't be elected as an openly atheistic one", said Lori Lipman Brown, who was hired last fall to be the Washington, D.C., lobbyist for an organization devoted to atheist causes, the Secular Coalition for America. She's believed to be the first paid lobbyist for the unbelievers in the nation's capital, the front lines of the culture wars. Now, all Brown is seeking is a constituency willing to go public. "Think of where the LGBT movement was 25 years ago", said Brown, who has worked on gay and lesbian rights issues as a legislator and attorney. "That's where atheists are today." [...] Brown, who is married and was raised a "humanistic Jew", talks about how she "came out" as an atheist several years ago, and how most atheists aren't "out yet" at work. She says atheist kids—like many gay children—are made to feel outcasts at school, and explains that she wants to erase the negative connotation to the word "atheist" just as homosexuals have reclaimed slurs like "queer" and "dyke."" Joe Garofoli, 'Atheists hoping to assert rights in religious era', San Francisco Chronicle, February 20, 2006 (accessed June 16, 2008).
- "I'm an atheist, but I don't believe that science and religion are by definition incompatible." Andrew Zwicker, Reddit AMA, 13 May 2014 (accessed 9 November 2017).
- voterocky.org
- "For 2016 Hopefuls, Washington Experience Could Do More Harm than Good". Pew Research Center - U.S. Politics & Policy. 19 May 2014. Retrieved 5 July 2020.
- "In Search of Libertarians in America" (PDF).
Further reading
- Casey Cep, "Without a Prayer: Why are Americans still uncomfortable with atheism?", The New Yorker, October 29, 2018, pp. 66–71. Discusses R. Laurence Moore and Isaac Kramnick, Godless Citizens in a Godly Republic: Atheists in American Public Life, Norton, 2018; and John Gray, Seven Types of Atheism, Farrar, Straus & Giroux, 2018, which defines "atheist" as "anyone with no use for a divine mind that has fashioned the world" (a category that includes nontheist religions with no creator god, such as Buddhism and Taoism).
- Schmidt, Leigh Eric, Village Atheists: How America's Unbelievers Made Their Way in a Godly Nation, Princeton, NJ, Princeton University Press, 2016.
- Michael Shermer, "Silent No More: The rise of the atheists", Scientific American, vol. 318, no. 4 (April 2018), p. 77.
External links
- Reality Check: Being Nonreligious in America 2020 report from American Atheists