Demographics of Lesotho
This article is about the demographic features of the population of Lesotho, including population density, ethnicity, education level, health of the populace, economic status, religious affiliations and other aspects of the population.
The Demographics of Lesotho describe the condition and overview of Lesotho's peoples. Demographic topics include basic education, health, and population statistics as well as identified racial and religious affiliations.
Population

According to the 2016 census, Lesotho has a total population of 2,007,201.[1] Of the population, 34.17 percent lived in urban and 65.83 percent in rural areas.[1] The country's capital, Maseru, accounts for around half of the total urban population. The sex distribution is 982,133 male and 1,025,068 female, or around 96 males for each 100 females.[1]
The average population density in the country is around 66,1 people per square kilometer. The density is lower in the Lesotho Highlands than in the western lowlands. Although the majority of the population—56.1 percent—is between 15 and 64 years of age, Lesotho has a substantial youth population numbering around 37.8 percent.[2] The annual population growth rate is estimated at 0.13%[2]
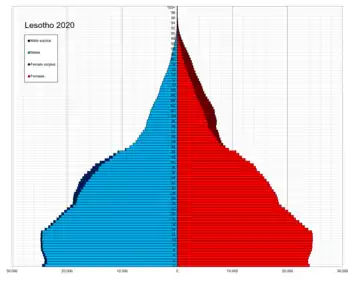
According to the 2019 revision of the World Population Prospects[3][4] the total population was 2,108,328 in 2018, compared to only 734 000 in 1950. The proportion of children below the age of 15 in 2010 was 37.4%, 58.3% was between 15 and 65 years of age, while 4.3% was 65 years or older .[5]
| Total population | Population aged 0–14 (%) | Population aged 15–64 (%) | Population aged 65+ (%) | |
|---|---|---|---|---|
| 1950 | 734 000 | 40.7 | 54.9 | 4.5 |
| 1955 | 788 000 | 41.9 | 53.7 | 4.4 |
| 1960 | 852 000 | 43.1 | 52.7 | 4.3 |
| 1965 | 934 000 | 43.6 | 52.2 | 4.2 |
| 1970 | 1 033 000 | 44.1 | 51.8 | 4.2 |
| 1975 | 1 150 000 | 44.5 | 51.3 | 4.2 |
| 1980 | 1 310 000 | 44.3 | 51.6 | 4.1 |
| 1985 | 1 487 000 | 44.3 | 51.6 | 4.1 |
| 1990 | 1 639 000 | 44.1 | 51.7 | 4.2 |
| 1995 | 1 795 000 | 43.1 | 52.5 | 4.4 |
| 2000 | 1 964 000 | 41.2 | 54.3 | 4.5 |
| 2005 | 2 066 000 | 39.6 | 56.0 | 4.4 |
| 2010 | 2 171 000 | 37.4 | 58.3 | 4.3 |
Vital statistics
Registration of vital events is in Lesotho not complete. The Population Departement of the United Nations prepared the following estimates. [5]
| Period | Live births per year | Deaths per year | Natural change per year | CBR* | CDR* | NC* | TFR* | IMR* |
|---|---|---|---|---|---|---|---|---|
| 1950-1955 | 32 000 | 17 000 | 15 000 | 42.1 | 22.7 | 19.4 | 5.84 | 169 |
| 1955-1960 | 35 000 | 17 000 | 18 000 | 42.2 | 20.3 | 21.9 | 5.86 | 150 |
| 1960-1965 | 38 000 | 16 000 | 21 000 | 42.3 | 18.3 | 24.0 | 5.81 | 134 |
| 1965-1970 | 42 000 | 17 000 | 24 000 | 42.5 | 17.8 | 24.8 | 5.80 | 130 |
| 1970-1975 | 47 000 | 18 000 | 28 000 | 42.8 | 16.9 | 26.0 | 5.80 | 123 |
| 1975-1980 | 52 000 | 19 000 | 33 000 | 42.0 | 15.1 | 27.0 | 5.69 | 110 |
| 1980-1985 | 56 000 | 18 000 | 38 000 | 40.4 | 13.0 | 27.4 | 5.46 | 94 |
| 1985-1990 | 59 000 | 18 000 | 41 000 | 37.6 | 11.6 | 26.0 | 5.14 | 84 |
| 1990-1995 | 60 000 | 17 000 | 42 000 | 34.7 | 10.0 | 24.7 | 4.70 | 70 |
| 1995-2000 | 63 000 | 25 000 | 38 000 | 33.7 | 13.5 | 20.2 | 4.37 | 81 |
| 2000-2005 | 62 000 | 36 000 | 26 000 | 30.7 | 17.9 | 12.8 | 3.79 | 86 |
| 2005-2010 | 60 000 | 35 000 | 25 000 | 28.5 | 16.7 | 11.9 | 3.37 | 77 |
| * CBR = crude birth rate (per 1000); CDR = crude death rate (per 1000); NC = natural change (per 1000); IMR = infant mortality rate per 1000 births; TFR = total fertility rate (number of children per woman) | ||||||||
Fertility and Births
Total Fertility Rate (TFR) (Wanted Fertility Rate) and Crude Birth Rate (CBR):[6]
| Year | CBR (Total) | TFR (Total) | CBR (Urban) | TFR (Urban) | CBR (Rural) | TFR (Rural) |
|---|---|---|---|---|---|---|
| 2004 | 25,3 | 3,5 (2,5) | 19,3 | 1,9 (1,4) | 26,7 | 4,1 (2,9) |
| 2009 | 26,4 | 3,3 (2,4) | 24,5 | 2,1 (1,7) | 27,1 | 4,0 (2,8) |
| 2014 | 24,3 | 3,3 (2,3) | 23,3 | 2,3 (1,7) | 24,7 | 3,9 (2,7) |
Fertility data as of 2014 (DHS Program):[7]
| District | Total fertility rate | Percentage of women age 15-49 currently pregnant | Mean number of children ever born to women age 40-49 |
|---|---|---|---|
| Butha-Buthe | 3.7 | 4.7 | 3.9 |
| Leribe | 3.5 | 3.6 | 3.7 |
| Berea | 3.1 | 3.5 | 3.7 |
| Maseru | 2.6 | 4.4 | 3.5 |
| Mafeteng | 2.8 | 6.1 | 3.5 |
| Mohale’s Hoek | 3.8 | 3.8 | 3.7 |
| Quthing | 3.9 | 3.3 | 4.1 |
| Qacha’s Nek | 2.9 | 5.0 | 3.8 |
| Mokhotlong | 4.4 | 5.2 | 4.9 |
| Thaba-Tseka | 4.0 | 4.3 | 4.6 |
Life expectancy at birth
Life expectancy from 1950 to 2015 (UN World Population Prospects):[8]
| Period | Life expectancy in Years |
|---|---|
| 1950–1955 | 42.15 |
| 1955–1960 | |
| 1960–1965 | |
| 1965–1970 | |
| 1970–1975 | |
| 1975–1980 | |
| 1980–1985 | |
| 1985–1990 | |
| 1990–1995 | |
| 1995–2000 | |
| 2000–2005 | |
| 2005–2010 | |
| 2010–2015 |
Other demographic statistics
Demographic statistics according to the World Population Review in 2019.[9]
- One birth every 9 minutes
- One death every 19 minutes
- One net migrant every 131 minutes
- Net gain of one person every 18 minutes
The following demographic are from the CIA World Factbook[10] unless otherwise indicated.
6,600 people living in Lesotho are from Asia or Europe. They represent 0.3% of the total population of Lesotho. The 5,000 Chinese people form the largest non-African ethnic group in Lesotho.[11]
Population
- 1,962,461 (July 2018 est.)
Age structure

- 0-14 years: 31.84% (male 314,155 /female 310,772)
- 15-24 years: 19.34% (male 181,332 /female 198,236)
- 25-54 years: 38.27% (male 366,652 /female 384,333)
- 55-64 years: 5.02% (male 52,490 /female 46,016)
- 65 years and over: 5.53% (male 55,804 /female 52,671) (2018 est.)
Median age
- total: 24.4 years. Country comparison to the world: 164th
- male: 24.4 years
- female: 24.3 years (2018 est.)
Population growth rate
- 0.24% (2018 est.) Country comparison to the world: 178th
Birth rate
- 24.2 births/1,000 population (2018 est.) Country comparison to the world: 52nd
Death rate
15.1 deaths/1,000 population (2018 est.)
Total fertility rate
- 2.59 children born/woman (2018 est.) Country comparison to the world: 72nd
Mother's mean age at first birth
- 21 years (2014 est.)
- note: median age at first birth among women 25-29
Contraceptive prevalence rate
- 60.2% (2014)
Net migration rate
- -6.8 migrant(s)/1,000 population (2017 est.) Country comparison to the world: 203rd
Religions
Protestant 47.8% (Pentecostal 23.1%, Lesotho Evangelical 17.3%, Anglican 7.4%), Roman Catholic 39.3%, other Christian 9.1%, non-Christian 1.4%, none 2.3% (2014 est.)
Dependency ratios
- total dependency ratio: 66.9 (2015 est.)
- youth dependency ratio: 59.5 (2015 est.)
- elderly dependency ratio: 7.4 (2015 est.)
- potential support ratio: 13.5 (2015 est.)
Urbanization
- urban population: 30.2% of total population (2018)
- rate of urbanization: 2.83% annual rate of change (2015-20 est.)
Life expectancy at birth
- total population: 53 years (2018 est.)
- male: 53 years (2018 est.)
- female: 53.1 years (2018 est.)
Literacy
definition: age 15 and over can read and write (2015 est.)
- total population: 79.4% (2015 est.)
- male: 70.1% (2015 est.)
- female: 88.3% (2015 est.)
School life expectancy (primary to tertiary education)
- total: 11 years (2015)
- male: 10 years (2015)
- female: 11 years (2015)
Unemployment, youth ages 15-24
- total: 34.4% (2013 est.)
- male: NA (2013 est.)
- female: NA (2013 est.)
Ethnic groups and languages
Due to Lesotho's long history as a unified nation, that continued even through British colonial rule, the ethnic makeup of the country is very homogenous. Lesotho's ethno-linguistic structure consists almost entirely of the Basotho (singular Mosotho), a Bantu-speaking people: an estimate of 99.7 percent of the people identify as Basotho.[2] The Kwena (Bakoena) are the largest subgroup of the Sotho; other Basotho subgroups include the Natal (North) Nguni, Batloung (the Tlou), Baphuthi (the Phuti), Bafokeng, Bataung (the Tau), Bats'oeneng (the tso'ene) and the Cape (South) Nguni (Thembu). Other ethnic groups include Europeans, numbering in the thousands, and several hundred Asians.[13]
Sesotho (Southern Sotho) and English languages are both official.[2] Afrikaans, Zulu, Xhosa and French are also spoken.
Religion
The population of Lesotho is estimated to be around 90 percent Christian.[14] Roman Catholics, the largest religious group, make up around 45 percent of the population.[14] Evangelicals comprise 26 percent of the population, and Anglican and other Christian groups an additional 19 percent.[14] Muslims, Hindus, Buddhists, Baháʼí, and members of traditional indigenous religions comprise the remaining 10 percent of the population.[14]
Education and literacy
According to recent estimates, 85 percent of the population 15 and over was literate. Among women the literacy rate was around 95 percent, and among men around 75 percent.[2] As such, Lesotho boasts one of the higher literacy rates in Africa. Although education is not compulsory, the Government of Lesotho is incrementally implementing a programme for free primary education. It was expected that the program would be fully in place by 2006. The National University of Lesotho located in Roma and the Limkokwing University of Creative Technology located in the heart of Maseru, Moshoeshoe 2 are the only universities in the country.[15] In addition, the country has almost 20 other public and 15 private institutes giving tertiary education.[15]
References
| Wikimedia Commons has media related to Demographics of Lesotho. |
- "2016 census" (PDF). Lesotho Bureau of Statistics. Retrieved 2018-08-28.
- CIA. "CIA - The World Factbook - Lesotho". Retrieved 2008-04-15.
- ""World Population prospects – Population division"". population.un.org. United Nations Department of Economic and Social Affairs, Population Division. Retrieved November 9, 2019.
- ""Overall total population" – World Population Prospects: The 2019 Revision" (xslx). population.un.org (custom data acquired via website). United Nations Department of Economic and Social Affairs, Population Division. Retrieved November 9, 2019.
- Population Division of the Department of Economic and Social Affairs of the United Nations Secretariat, World Population Prospects: The 2010 Revision Archived May 6, 2011, at the Wayback Machine
- Demographic and Health Surveys
- http://dhsprogram.com/pubs/pdf/FR309/FR309.pdf
- "World Population Prospects – Population Division – United Nations". Retrieved 2017-07-15.
- "Lesotho Population 2019", World Population Review
- "The World FactBook - Lesotho", The World Factbook, July 12, 2018
 This article incorporates text from this source, which is in the public domain.
 - https://www.nationsonline.org/oneworld/lesotho.htm
- "Africa :: LESOTHO". CIA The World Factbook.
- Commonwealth Secretariat (2004). The Commonwealth Yearbook. p. 181. ISBN 0-11-703227-1.
- "International Religious Freedom Report 2007: Lesotho". United States Bureau of Democracy, Human Rights, and Labor. 2007-09-14. Retrieved 2008-04-15.
- Matora Ntimo-Makara. "INHEA: Lesotho higher education profile". The Boston College Center for International Higher Education. Archived from the original on 2008-05-14. Retrieved 2008-04-15.
![]() This article incorporates public domain material from the CIA World Factbook website https://www.cia.gov/the-world-factbook/.
This article incorporates public domain material from the CIA World Factbook website https://www.cia.gov/the-world-factbook/.