Demographics of Malawi
This article is about the demographic features of the population of Malawi, including population density, ethnicity, education level, health of the populace, economic status, religious affiliations and other aspects of the population.

Malawi derives its name from the Maravi, a Bantu people who came from the southern Congo about 600 years ago. On reaching the area north of Lake Malawi, the Maravi divided. One branch, the ancestors of the present-day Chewas, moved south to the west bank of the lake. The other, the ancestors of the Nyanjas, moved down the east bank to the southern part of the country.
By AD 1500, the two divisions of the tribe had established a kingdom stretching from north of the present-day city of Nkhotakota to the Zambezi River in the south, and from Lake Malawi in the east, to the Luangwa River in Zambia in the west.
Migrations and tribal conflicts precluded the formation of a cohesive Malawian society until the turn of the 20th century. In more recent years, ethnic and tribal distinctions have diminished. Regional distinctions and rivalries, however, persist. Despite some clear differences, no significant friction currently exists between tribal groups, and the concept of a Malawian nationality has begun to take hold. Predominantly a rural people, Malawians are generally conservative and traditionally nonviolent.
The Chewas constitute 90% of the population of the central region; the Nyanja tribe predominates in the south and the Tumbuka in the north. In addition, significant numbers of the Tongas live in the north; Ngonis—an offshoot of the Zulus who came from South Africa in the early 19th century—live in the lower northern and lower central regions; and the Yao, who are mostly Muslim, predominate in the Southern Region of the country and live in a wide band from Blantyre and Zomba north to Lake Malawi and east to the border with Mozambique. Bantus of other tribes came from Mozambique as refugees.
Population
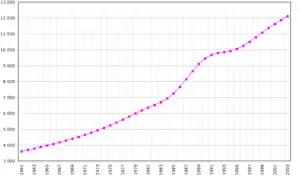
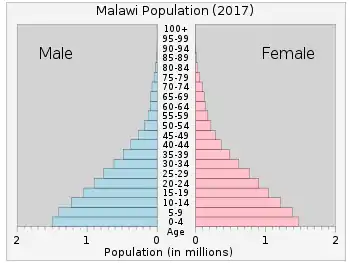
According to the 2019 revision of the World Population Prospects[1][2] the total population was 18,143,217 in 2018, compared to only 2 881 000 in 1950. The proportion of children below the age of 15 in 2010 was 45.8%, 51.1% was between 15 and 65 years of age, while 3.1% was 65 years or older.[3]
| Total population (x 1000) | Population aged 0–14 (%) | Population aged 15–64 (%) | Population aged 65+ (%) | |
|---|---|---|---|---|
| 1950 | 2 881 | 45.7 | 51.2 | 3.1 |
| 1955 | 3 166 | 45.7 | 51.5 | 2.8 |
| 1960 | 3 525 | 45.9 | 51.6 | 2.6 |
| 1965 | 3 975 | 45.3 | 52.3 | 2.4 |
| 1970 | 4 531 | 46.3 | 51.4 | 2.3 |
| 1975 | 5 302 | 46.9 | 50.6 | 2.5 |
| 1980 | 6 240 | 47.1 | 50.3 | 2.6 |
| 1985 | 7 268 | 47.5 | 50.0 | 2.5 |
| 1990 | 9 381 | 45.9 | 51.4 | 2.7 |
| 1995 | 9 883 | 44.7 | 52.2 | 3.1 |
| 2000 | 11 229 | 45.8 | 51.1 | 3.1 |
| 2005 | 12 823 | 46.1 | 50.9 | 3.1 |
| 2010 | 14 901 | 45.8 | 51.1 | 3.1 |
Total and Percent Distribution of Population by Single Year of Age (Census 09.03.2018)
| Age | Population | Percent |
|---|---|---|
| Total | 17,563,749 | 100 |
| 0-4 | 2,552,406 | 14.53 |
| 0 | 522,802 | 2.98 |
| 1 | 509,351 | 2.90 |
| 2 | 490,811 | 2.79 |
| 3 | 511,365 | 2.91 |
| 4 | 518,077 | 2.95 |
| 5-9 | 2,632,878 | 14.99 |
| 5 | 529,111 | 3.01 |
| 6 | 546,708 | 3.11 |
| 7 | 526,347 | 3.00 |
| 8 | 532,846 | 3.03 |
| 9 | 497,866 | 2.83 |
| 10-14 | 2,533,303 | 14.42 |
| 10 | 539,264 | 3.07 |
| 11 | 489,887 | 2.79 |
| 12 | 517,832 | 2.95 |
| 13 | 492,122 | 2.80 |
| 14 | 494,198 | 2.81 |
| 15-19 | 2,035,945 | 11.59 |
| 15 | 452,017 | 2.57 |
| 16 | 339,248 | 1.93 |
| 17 | 384,682 | 2.19 |
| 18 | 497,831 | 2.83 |
| 19 | 362,167 | 2.06 |
| 20-24 | 1,651,576 | 9.40 |
| 20 | 357,667 | 2.04 |
| 21 | 323,511 | 1.84 |
| 22 | 304,519 | 1.73 |
| 23 | 330,222 | 1.88 |
| 24 | 335,657 | 1.91 |
| 25-29 | 1,229,411 | 7.00 |
| 25 | 291,198 | 1.66 |
| 26 | 274,739 | 1.56 |
| 27 | 213,337 | 1.21 |
| 28 | 238,630 | 1.36 |
| 29 | 211,507 | 1.20 |
| 30-34 | 1,107,226 | 6.30 |
| 30 | 243,969 | 1.39 |
| 31 | 209,155 | 1.19 |
| 32 | 226,360 | 1.29 |
| 33 | 218,620 | 1.24 |
| 34 | 209,122 | 1.19 |
| 35-39 | 968,998 | 5.52 |
| 35 | 221,078 | 1.26 |
| 36 | 207,499 | 1.18 |
| 37 | 165,564 | 0.94 |
| 38 | 210,252 | 1.20 |
| 39 | 164,605 | 0.94 |
| 40-44 | 729,600 | 4.15 |
| 40 | 168,637 | 0.96 |
| 41 | 137,967 | 0.79 |
| 42 | 147,438 | 0.84 |
| 43 | 151,363 | 0.86 |
| 44 | 124,195 | 0.71 |
| 45-49 | 535,868 | 3.05 |
| 45 | 129,172 | 0.74 |
| 46 | 121,996 | 0.69 |
| 47 | 89,576 | 0.51 |
| 48 | 112,116 | 0.64 |
| 49 | 83,008 | 0.47 |
| 50-54 | 387,812 | 2.21 |
| 50 | 99,632 | 0.57 |
| 51 | 57,309 | 0.33 |
| 52 | 63,690 | 0.36 |
| 53 | 72,671 | 0.41 |
| 54 | 94,510 | 0.54 |
| 55-59 | 306,921 | 1.75 |
| 55 | 69,274 | 0.39 |
| 56 | 63,914 | 0.36 |
| 57 | 50,534 | 0.29 |
| 58 | 75,091 | 0.43 |
| 59 | 48,108 | 0.27 |
| 60-64 | 234,918 | 1.34 |
| 60 | 69,006 | 0.39 |
| 61 | 38,753 | 0.22 |
| 62 | 44,264 | 0.25 |
| 63 | 40,119 | 0.23 |
| 64 | 42,776 | 0.24 |
| 65-69 | 240,551 | 1.37 |
| 65 | 47,861 | 0.27 |
| 66 | 50,078 | 0.29 |
| 67 | 35,456 | 0.20 |
| 68 | 59,659 | 0.34 |
| 69 | 47,497 | 0.27 |
| 70-74 | 144,788 | 0.82 |
| 70 | 39,380 | 0.22 |
| 71 | 27,618 | 0.16 |
| 72 | 26,622 | 0.15 |
| 73 | 31,656 | 0.18 |
| 74 | 19,512 | 0.11 |
| 75-79 | 124,718 | 0.71 |
| 75 | 25,635 | 0.15 |
| 76 | 28,492 | 0.16 |
| 77 | 19,096 | 0.11 |
| 78 | 35,174 | 0.20 |
| 79 | 16,321 | 0.09 |
| 80-84 | 63,675 | 0.36 |
| 80 | 16,846 | 0.10 |
| 81 | 9,987 | 0.06 |
| 82 | 12,908 | 0.07 |
| 83 | 14,208 | 0.08 |
| 84 | 9,726 | 0.06 |
| 85-89 | 54,754 | 0.31 |
| 85 | 12,054 | 0.07 |
| 86 | 14,628 | 0.08 |
| 87 | 8,331 | 0.05 |
| 88 | 15,327 | 0.09 |
| 89 | 4,414 | 0.03 |
| 90-94 | 15,130 | 0.09 |
| 90 | 5,041 | 0.03 |
| 91 | 2,466 | 0.01 |
| 92 | 2,746 | 0.02 |
| 93 | 2,897 | 0.02 |
| 94 | 1,980 | 0.01 |
| 95+ | 13,271 | 0.08 |
| Age group | Population | Percent |
|---|---|---|
| 0-14 | 7,718,587 | 43.95 |
| 15-64 | 9,188,275 | 52.31 |
| 65+ | 656,887 | 3.74 |
TFR - 4.17
Structure of the population (DHS 2010) (Males 55 159, Females 58 414 = 113 574) :
| Age Group | Male (%) | Female (%) | Total (%) |
|---|---|---|---|
| 0-4 | 17,3 | 17,0 | 17,2 |
| 5-9 | 17,4 | 16,8 | 17,1 |
| 10-14 | 15,1 | 14,3 | 14,7 |
| 15-19 | 10,6 | 9,0 | 9,8 |
| 20-24 | 7,6 | 8,1 | 7,8 |
| 25-29 | 6,8 | 7,7 | 7,3 |
| 30-34 | 5,7 | 5,8 | 5,8 |
| 35-39 | 4,8 | 4,4 | 4,6 |
| 40-44 | 3,1 | 3,1 | 3,1 |
| 45-49 | 2,6 | 2,7 | 2,7 |
| 50-54 | 2,2 | 2,7 | 2,5 |
| 55-59 | 1,8 | 2,1 | 1,9 |
| 60-64 | 1,7 | 1,9 | 1,8 |
| 65-69 | 1,1 | 1,4 | 1,2 |
| 70-74 | 0,8 | 1,1 | 1,0 |
| 75-79 | 0,6 | 0,9 | 0,8 |
| 80+ | 0,6 | 1,0 | 0,8 |
| Age group | Male (%) | Female (%) | Total (%) |
|---|---|---|---|
| 0-14 | 49,8 | 48,1 | 49,0 |
| 15-64 | 47,1 | 47,5 | 47,2 |
| 65+ | 3,1 | 4,4 | 3,8 |
Structure of the population (DHS 2014) (Males 6 855, Females 7 125 = 13 979) :
| Age Group | Male (%) | Female (%) | Total (%) |
|---|---|---|---|
| 0-4 | 16,8 | 16,4 | 16,6 |
| 5-9 | 16,1 | 16,3 | 16,2 |
| 10-14 | 15,7 | 16,0 | 15,9 |
| 15-19 | 8,5 | 6,9 | 7,7 |
| 20-24 | 7,2 | 8,5 | 7,8 |
| 25-29 | 6,1 | 7,3 | 6,7 |
| 30-34 | 6,4 | 6,9 | 6,7 |
| 35-39 | 5,3 | 5,0 | 5,2 |
| 40-44 | 3,8 | 3,3 | 3,5 |
| 45-49 | 3,2 | 1,9 | 2,5 |
| 50-54 | 2,6 | 3,7 | 3,1 |
| 55-59 | 1,5 | 1,9 | 1,7 |
| 60-64 | 1,3 | 1,8 | 1,5 |
| 65-69 | 1,0 | 1,2 | 1,1 |
| 70-74 | 0,9 | 0,8 | 0,8 |
| 75-79 | 0,7 | 0,8 | 0,7 |
| 80+ | 0,7 | 0,9 | 0,8 |
| Age group | Male (%) | Female (%) | Total (%) |
|---|---|---|---|
| 0-14 | 48,6 | 48,7 | 48,7 |
| 15-64 | 48,1 | 47,6 | 47,9 |
| 65+ | 3,3 | 3,7 | 3,4 |
UN population projections
Numbers are in thousands. UN medium variant projections [3]
- 2015 17,522
- 2020 20,677
- 2025 24,212
- 2030 28,173
- 2035 32,667
- 2040 37,797
- 2045 43,521
- 2050 49,719
Vital statistics
Registration of vital events is in Malawi not complete. The Population Departement of the United Nations prepared the following estimates. [3]
| Period | Live births per year | Deaths per year | Natural change per year | CBR* | CDR* | NC* | TFR* | IMR* |
|---|---|---|---|---|---|---|---|---|
| 1950-1955 | 144 000 | 85 000 | 59 000 | 47.5 | 28.0 | 19.5 | 6.78 | 198 |
| 1955-1960 | 162 000 | 89 000 | 72 000 | 48.3 | 26.7 | 21.7 | 6.84 | 192 |
| 1960-1965 | 187 000 | 97 000 | 91 000 | 49.9 | 25.7 | 24.1 | 7.00 | 186 |
| 1965-1970 | 219 000 | 107 000 | 113 000 | 51.5 | 25.1 | 26.5 | 7.20 | 180 |
| 1970-1975 | 257 000 | 115 000 | 142 000 | 52.3 | 23.4 | 28.9 | 7.40 | 168 |
| 1975-1980 | 314 000 | 130 000 | 183 000 | 54.3 | 22.6 | 31.8 | 7.50 | 159 |
| 1980-1985 | 351 000 | 139 000 | 212 000 | 51.9 | 20.6 | 31.3 | 7.30 | 151 |
| 1985-1990 | 410 000 | 157 000 | 253 000 | 49.3 | 18.8 | 30.4 | 7.00 | 143 |
| 1990-1995 | 453 000 | 173 000 | 280 000 | 47.0 | 17.9 | 29.1 | 6.50 | 133 |
| 1995-2000 | 479 000 | 189 000 | 290 000 | 45.4 | 17.9 | 27.5 | 6.20 | 121 |
| 2000-2005 | 522 000 | 199 000 | 323 000 | 43.4 | 16.6 | 26.8 | 6.03 | 107 |
| 2005-2010 | 610 000 | 190 000 | 420 000 | 44.0 | 13.7 | 30.3 | 6.00 | 95 |
| * CBR = crude birth rate (per 1000); CDR = crude death rate (per 1000); NC = natural change (per 1000); IMR = infant mortality rate per 1000 births; TFR = total fertility rate (number of children per woman) | ||||||||
Births and deaths [5]
| Year | Population | Live births | Deaths | Natural increase | Crude birth rate | Crude death rate | Rate of natural increase | TFR |
|---|---|---|---|---|---|---|---|---|
| 1966 | 4,039,583 | |||||||
| 1977 | 5,547,460 | 48.3 | 7.6 | |||||
| 1987 | 7,988,507 | 41.2 | 14.1 | 27.1 | 7.4 | |||
| 1998 | 9,933,868 | 37.9 | 20.9 | 17.9 | 6.5 | |||
| 2008* | 13,077,160 | 516,629 | 135,865 | 380,764 | 37.9 | 10.0 | 27.9 | 5.19 |
| 2018* | 17,563,749 | 576,606 | 110,776 | 465,830 | 32.8 | 6.3 | 26.5 | 4.17 |
- Data refer to the 12 months preceding the census in June
Fertility and births
Total Fertility Rate (TFR) (Wanted Fertility Rate) and Crude Birth Rate (CBR):[6][7]
| Year | CBR (Total) | TFR (Total) | CBR (Urban) | TFR (Urban) | CBR (Rural) | TFR (Rural) |
|---|---|---|---|---|---|---|
| 1984 | 52 | 7.58 | ||||
| 1992 | 42.9 | 6.73 (5.74) | 40.5 | 5.51 (4.38) | 43.2 | 6.88 (5.92) |
| 2000 | 45.5 | 6.3 (5.2) | 40.8 | 4.5 (3.5) | 46.2 | 6.7 (5.5) |
| 2004 | 42.4 | 6.0 (4.9) | 37.0 | 4.2 (3.3) | 43.4 | 6.4 (5.2) |
| 2010 | 39.2 | 5.7 (4.5) | 36.0 | 4.0 (3.3) | 39.8 | 6.1 (4.8) |
| 2015-16 | 32.2 | 4.4 (3.4) | 29.5 | 3.0 (2.5) | 32.6 | 4.7 (3.6) |
| 2017 | 32.1 | 4.2 | 27.4 | 2.8 | 33.0 | 4.5 |
Fertility data as of 2016 (DHS Program):[8]
| Region | Total fertility rate | Percentage of women age 15-49 currently pregnant | Mean number of children ever born to women age 40-49 |
|---|---|---|---|
| Northern | 4.2 | 8.1 | 5.7 |
| Central | 4.4 | 7.8 | 6.2 |
| Southern | 4.6 | 7.3 | 5.7 |
| Total | 4.4 | 7.6 | 5.9 |
Life expectancy birth
| Period | Life expectancy in Years[9] |
|---|---|
| 1950–1955 | 36.26 |
| 1955–1960 | |
| 1960–1965 | |
| 1965–1970 | |
| 1970–1975 | |
| 1975–1980 | |
| 1980–1985 | |
| 1985–1990 | |
| 1990–1995 | |
| 1995–2000 | |
| 2000–2005 | |
| 2005–2010 | |
| 2010–2015 |
Other demographic statistics
Demographic statistics according to the World Population Review in 2019.[10]
- One birth every 45 seconds
- One death every 4 minutes
- One net migrant every 44 minutes
- Net gain of one person every 57 seconds
The following demographic are from the CIA World Factbook[11] unless otherwise indicated.
Population
- 19,842,560 (July 2018 est.)
- 19,196,246 (July 2017 est.)
Age structure
- 0-14 years: 46.17% (male 4,560,940 /female 4,600,184)
- 15-24 years: 20.58% (male 2,023,182 /female 2,059,765)
- 25-54 years: 27.57% (male 2,717,613 /female 2,752,983)
- 55-64 years: 3% (male 284,187 /female 310,393)
- 65 years and over: 2.69% (male 234,776 /female 298,537) (2018 est.)
Median age
- total: 16.6 years. Country comparison to the world: 223th
- male: 16.5 years
- female: 16.8 years (2018 est.)
Birth rate
- 40.7 births/1,000 population (2018 est.) Country comparison to the world: 8th
- 41 births/1,000 population (2017 est.)
Death rate
- 7.7 deaths/1,000 population (2018 est.) Country comparison to the world: 100th
- 7.9 deaths/1,000 population (2017 est.)
Total fertility rate
- 4 children born/woman (2018 est.) Country comparison to the world: 9th
Population growth rate
- 3.31% (2018 est.) Country comparison to the world: 3rd
- 3.31% (2017 est.)
Mother's mean age at first birth
- 18.9 years (2015/16 est.)
- note: median age at first birth among women 25-29
Contraceptive prevalence rate
- 59.2% (2015/16)
Net migration rate
- 0 migrant(s)/1,000 population (2017 est.) Country comparison to the world: 91st
- 0 migrants/1,000 population (2017). There is an increasing flow of Zimbabweans into South Africa and Botswana in search of better economic opportunities.
Religions[12]
Protestant 27.2% (includes Church of Central Africa Presbyterian 17.7%, Seventh Day Adventist/Baptist 6.9%, Anglican 2.6%), Catholic 18.4%, other Christian 41%, Muslim 12.1%, other 0.3%, none 1% (2015-16 est.)
Dependency ratios
- total dependency ratio: 91 (2015 est.)
- youth dependency ratio: 85.3 (2015 est.)
- elderly dependency ratio: 5.7 (2015 est.)
- potential support ratio: 17.4 (2015 est.)
Urbanization
- urban population: 16.9% of total population (2018)
- rate of urbanization: 4.19% annual rate of change (2015-20 est.)
Life expectancy at birth
- total population: 62.2 years (2018 est.)
- male: 60.2 years (2018 est.)
- female: 64.3 years (2018 est.)
- total population: 61.7 years
- male: 59.7 years
- female: 63.8 years (2017 est.)
Sex ratio
- at birth: 1.03 male(s)/female
- under 15 years: 1 male(s)/female
- 15-64 years: 0.97 male(s)/female
- 65 years and over: 0.69 male(s)/female
- total population: 0.97 male(s)/female (2000 est.)
Ratio of medical doctors to general population
1 Doctor/65,000 Malawians [13]
Nationality
- noun: Malawian(s)
- adjective: Malawian
Ethnic groups
Languages[12]
- English (official)
- Chichewa (official) - 6,500,000
- Chiyao - 1,760,000
- Chitumbuka - 1,180,000
- Chilomwe - 2,290,000
- Chingoni - 37,500
- Chimakhuwa - 200,000
- Chisena - 468,000
- Chitonga - 271,000
- Chinyika - 5,000
- Chinyiha - 10,000
- Chindali - 70,000
- Chinyakyusa - 149,000
- Chilambya - 59,500
- Afrikaans - 26,000
Literacy
definition: age 15 and over can read and write
- total population: 62.1%
- male: 69.8%
- female: 55.2% (2015 est.)
School life expectancy (primary to tertiary education)
- total: 11 years (2011)
- male: 11 years (2011)
- female: 11 years (2011)
Unemployment, youth ages 15-24
- total: 8% (2013 est.)
- male: 7.4% (2013 est.)
- female: 8.5% (2013 est.)
White Malawians
There has been reported a 7,400 white population. White Malawians are descended from English, Scottish, Dutch, French, Italian, Greek, Spanish, Portuguese, Middle Eastern, Belgian, Scandinavian, or Germans. White Malawians live in Lilongwe, Dedza, Dowa, Blantyre, Kasungu, Mchinji, Nkhotakota, Ntcheu, Ntchisi, Salima, Chitipa, Karonga, Likoma, Mzimba, Nkhata Bay, Rumphi, Balaka, Chikwawa, Chiradzulu, Machinga, Magochi, Mulanje, Mwanza, Nsanje, Thyolo, Phalombe, Zomba, and Mzuzu.
See also
References
| Wikimedia Commons has media related to Demographics of Malawi. |
- ""World Population prospects – Population division"". population.un.org. United Nations Department of Economic and Social Affairs, Population Division. Retrieved November 9, 2019.
- ""Overall total population" – World Population Prospects: The 2019 Revision" (xslx). population.un.org (custom data acquired via website). United Nations Department of Economic and Social Affairs, Population Division. Retrieved November 9, 2019.
- Population Division of the Department of Economic and Social Affairs of the United Nations Secretariat, World Population Prospects: The 2010 Revision Archived May 6, 2011, at the Wayback Machine
- "2018 Population and Housing Census Main Report" (PDF). Malawi National Statistical Office. Retrieved 25 December 2019.
- "3. Live births, deaths, and infant deaths, latest available year (2002 - 2016)" (PDF). Unstats.un.org. 21 July 2017. Retrieved 2017-08-04.
- "MEASURE DHS: Demographic and Health Surveys". Microdata.worldbank.org. Retrieved 4 August 2017.
- "STATcompiler". www.statcompiler.com. Retrieved 2020-02-17.
- "Malawi Demographic and Demographic and Health Survey : Health Survey 2015-16" (PDF). Dhsprogram.com. Retrieved 2017-08-04.
- "World Population Prospects - Population Division - United Nations". esa.un.org. Retrieved 2018-08-26.
- "Malawi Population 2019", World Population Review
- "The World FactBook - Malawi", The World Factbook, July 12, 2018
 This article incorporates text from this source, which is in the public domain.
 - "Africa :: MALI". CIA The World Factbook. Retrieved 2017-08-04.
- von Bothmer, Eleanore (2009). "Global lack of medical doctors". Development and Cooperation. Frankfurt am Main: Societäts-Verlag. 36 (3): 94. Archived from the original on 2009-07-26.