Demographics of Senegal
This article is about the demographic features of the population of Senegal, including population density, ethnicity, education level, health of the populace, economic status, religious affiliations and other aspects of the population.
About 42% of Senegal's population is rural. In rural areas, population density varies from about 77 per square kilometer (200/mile²) in the west-central region to 2 per square kilometer (5/mile²) in the arid eastern section. The average population density for the country is 68 people per square kilometer (169/sq mi).[1] French is the official language but is used regularly only by the literate minority. Almost all Senegalese speak an indigenous language, of which Wolof has the largest usage. Many Senegalese live in Europe, particularly in France, Italy and Spain.
Population
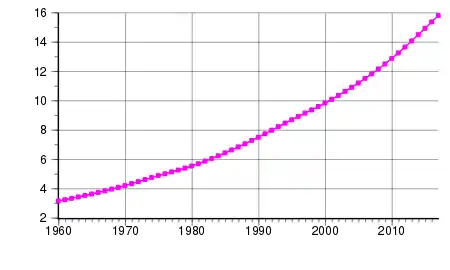
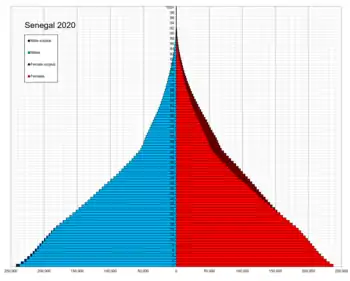
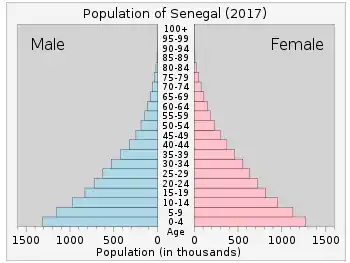
According to the 2018 revision of the World Population Review[1] the total population was 16,302,789 in May 2018, compared to only 2,416,000 in 1950. The proportion of children below the age of 15 in 2017 was 41.5%, between 15 and 54 years of age was 31.1%, while 55 years or older was 6.9%. .[2]
| Total population | Population aged 0–14 (%) | Population aged 15–64 (%) | Population aged 65+ (%) | |
|---|---|---|---|---|
| 1950 | 2,416,000 | 41.6 | 55.0 | 3.4 |
| 1955 | 2,684,000 | 41.5 | 55.6 | 2.9 |
| 1960 | 3,048,000 | 41.9 | 55.5 | 2.6 |
| 1965 | 3,505,000 | 43.0 | 54.6 | 2.4 |
| 1970 | 4,096,000 | 44.3 | 53.5 | 2.3 |
| 1975 | 4,786,000 | 45.3 | 52.5 | 2.2 |
| 1980 | 5,414,000 | 47.2 | 50.5 | 2.2 |
| 1985 | 6,232,000 | 47.7 | 50.0 | 2.3 |
| 1990 | 7,242,000 | 47.2 | 50.4 | 2.4 |
| 1995 | 8,369,000 | 46.2 | 51.3 | 2.5 |
| 2000 | 9,506,000 | 45.4 | 52.1 | 2.5 |
| 2005 | 10,872,000 | 44.4 | 53.1 | 2.5 |
| 2010 | 12,434,000 | 43.7 | 53.9 | 2.4 |
| 2017 | 14,668,522 | 41.5 | 55.5 | 2.9 |
Vital statistics
Registration of vital events in Senegal is not complete. The Population Department of the United Nations prepared the following estimates.[2]
| Period | Live births per year | Deaths per year | Natural change per year | CBR* | CDR* | NC* | TFR* | IMR* |
|---|---|---|---|---|---|---|---|---|
| 1950–1955 | 115,000 | 68,000 | 47,000 | 45.2 | 26.8 | 18.4 | 6.05 | 131 |
| 1955–1960 | 137,000 | 73,000 | 64,000 | 47.7 | 25.4 | 22.3 | 6.42 | 128 |
| 1960–1965 | 163,000 | 82,000 | 81,000 | 49.7 | 24.9 | 24.8 | 6.85 | 123 |
| 1965–1970 | 193,000 | 92,000 | 101,000 | 50.8 | 24.2 | 26.6 | 7.25 | 117 |
| 1970–1975 | 224,000 | 100,000 | 125,000 | 50.5 | 22.4 | 28.1 | 7.45 | 108 |
| 1975–1980 | 251,000 | 99,000 | 153,000 | 49.3 | 19.3 | 29.9 | 7.50 | 99 |
| 1980–1985 | 274,000 | 93,000 | 181,000 | 47.1 | 16.0 | 31.0 | 7.28 | 89 |
| 1985–1990 | 303,000 | 92,000 | 211,000 | 45.0 | 13.6 | 31.4 | 6.90 | 80 |
| 1990–1995 | 335,000 | 98,000 | 237,000 | 42.9 | 12.5 | 30.3 | 6.36 | 72 |
| 1995–2000 | 365,000 | 104,000 | 261,000 | 40.8 | 11.6 | 29.2 | 5.77 | 66 |
| 2000–2005 | 405,000 | 108,000 | 297,000 | 39.8 | 10.6 | 29.2 | 5.36 | 60 |
| 2005–2010 | 450,000 | 111,000 | 339,000 | 38.6 | 9.5 | 29.1 | 5.03 | 55 |
| * CBR = crude birth rate (per 1000); CDR = crude death rate (per 1000); NC = natural change (per 1000); IMR = infant mortality rate per 1000 births; TFR = total fertility rate (number of children per woman) | ||||||||
Births and deaths [3]
| Year | Population | Live births | Deaths | Natural increase | Crude birth rate | Crude death rate | Rate of natural increase | TFR |
|---|---|---|---|---|---|---|---|---|
| 2009 | 498 714 | 138 182 | 360 532 | 41,0 | 11,4 | 29,6 | 4,91 | |
| 2010 | 456 212 | 132 218 | 323 994 | 36,5 | 10,6 | 25,9 | 4,86 | |
| 2011 | 464 464 | 134 450 | 330 014 | 36,2 | 10,5 | 25,7 | ||
| 2012 | 471 629 | 135 468 | 336 161 | 35,7 | 10,3 | 25,5 | ||
| 2013 | 12 874 000 | 478 898 | 136 460 | 342 438 | 35,3 | 10,1 | 25,2 | |
Fertility and births
Total Fertility Rate (TFR) (Wanted Fertility Rate) and Crude Birth Rate (CBR):[4]
| Year | CBR (Total) | TFR (Total) | CBR (Urban) | TFR (Urban) | CBR (Rural) | TFR (Rural) |
|---|---|---|---|---|---|---|
| 1980-82 | 7,4 | 6,3 | 7,9 | |||
| 1983-85 | 6,6 | 5,4 | 7,1 | |||
| 1992-93 | 40,8 | 6,03 (5,1) | 37,4 | 5,06 (3,8) | 42,9 | 6,74 (5,9) |
| 1997 | 37 | 5,67 (4,6) | 31 | 4,29 (3,2) | 42 | 6,74 (5,6) |
| 1999 | 36 | 5,2 | 30 | 3,9 | 40 | 6,1 |
| 2005 | 39,3 | 5,3 (4,5) | 33,4 | 4,1 (3,3) | 44,0 | 6,4 (5,7) |
| 2008–2009 | 37,3 | 4,9 | 33,4 | 4,0 | 40,1 | 5,8 |
| 2010–2011 | 37,4 | 5,0 (3,2) | 32,3 | 3,9 (2,6) | 41,6 | 6,0 (3,8) |
| 2012–2013 | 38,6 | 5,3 | 32,9 | 4,1 | 42,7 | 6,3 |
| 2014 | 37,6 | 5,0 (3,7) | 33,4 | 4,0 (3,1) | 41,6 | 6,3 (4,4) |
| 2015 | 35.7 | 4.9 (4.3) | 28.1 | 3.5 (3.1) | 41.5 | 6.1 (5.4) |
| 2016 | 34.6 | 4.7 (4.2) | 27.2 | 3.5 (3.1) | 40.8 | 5.9 (5.2) |
| 2017 | 33.7 | 4.6 (4.0) | 27.1 | 3.4 (3.0) | 39.2 | 5.9 (5.1) |
| 2018 | 32.7 | 4.4 (4.0) | 27.2 | 3.2 (3.0) | 37.0 | 5.5 (5.0) |
Fertility data by region (DHS Program):[5]
| Region | Total fertility rate (2005) |
Total fertility rate (2010/11) |
Total fertility rate (2017) |
|---|---|---|---|
| Dakar | 3.7 | 3.7 | 3.0 |
| Thiès | 5.4 | 4.8 | 4.6 |
| Diourbel | 6.2 | 5.2 | 5.8 |
| Kaolack | 5.9 | 6.0 | 5.2 |
| Kaffrine | 6.5 | 6.2 | |
| Louga | 5.6 | 4.8 | 5.1 |
| Fatick | 6.8 | 6.3 | 5.2 |
| Ziguinchor | 5.0 | 4.8 | 4.6 |
| Sédhiou | 6.9 | 6.4 | |
| Kolda | 6.3 | 6.8 | 5.5 |
| Matam | 3.7 | 5.4 | 5.3 |
| Saint-Louis | 5.3 | 5.0 | 4.7 |
| Kédougou | 6.1 | 6.4 | |
| Tambacounda | 6.2 | 6.0 | 5.8 |
Life expectancy
| Period | Life expectancy in Years[6] |
|---|---|
| 1950–1955 | 35.47 |
| 1955–1960 | |
| 1960–1965 | |
| 1965–1970 | |
| 1970–1975 | |
| 1975–1980 | |
| 1980–1985 | |
| 1985–1990 | |
| 1990–1995 | |
| 1995–2000 | |
| 2000–2005 | |
| 2005–2010 | |
| 2010–2015 |
Ethnic groups
- Wolof 37.1%, Pular 26.2%, Serer 17%, Mandinka 5.6%, Jola 4.5%, Soninke 1.4%, Other 8.3% (includes 50,000 Europeans and persons of Lebanese descent) (2017)[7]
- About 50,000 Europeans -represents the 0.3% of the population of Senegal- (mostly French) and Lebanese and Vietnamese reside in Senegal, mainly in the cities.
| Ethnic group |
census 1976 [8] | census 1988[9] | ||
|---|---|---|---|---|
| Number | % | Number | % | |
| Wolof | 2,001,416 | 41.0 | 2,890,402 | 42.7 |
| Serer | 716,919 | 14.7 | 1,009,921 | 14.9 |
| Peul | 605,584 | 12.4 | 978,366 | 14.4 |
| Toucouleur | 528,490 | 10.8 | 631,892 | 9.3 |
| Diola | 265,353 | 5.4 | 357,672 | 5.3 |
| Mandingue | 179,050 | 3.7 | 245,651 | 3.6 |
| Soce | 42,751 | 0.6 | ||
| Sarakhole | 84,102 | 1.7 | 113,184 | 1.7 |
| Bambara | 65,096 | 1.3 | 91,071 | 1.3 |
| Maure | 59,784 | 1.2 | 67,726 | 1.0 |
| Mandjaag | 41,628 | 0.9 | 66,605 | 1.0 |
| Lebou | 94,837 | 1.9 | 56,758 | 0.8 |
| Balant | 33,915 | 0.7 | 54,398 | 0.8 |
| Malinke | 202,472 | 4.1 | 28,643 | 0.4 |
| Mancagne | 23,180 | 0.3 | ||
| Laobe | 18,250 | 0.3 | ||
| Bassari | 6,195 | 0.1 | ||
| Khassonke | 1,752 | 0.0 | ||
| Coniagui | 1,119 | 0.0 | ||
| Fula | 108 | 0.0 | ||
| Other | 87,773 | 1.3 | ||
| Total | 4,879,103 | 6,773,417 | ||
Religion
The religion beliefs of the 2016 population of Senegal are: Muslim 96.1% (mostly Sunni), Christian 3.6% (mostly Roman Catholic), animist 0.3%.[7]
Other general statistics
The following demographic statistics of Senegal are from the World Population Review.[1]
- One birth every 56 seconds
- One death every 6 minutes
- One net migrant every 26 minutes
- Net gain of one person every 1 minutes
The following demographic are from the CIA World Factbook[10] unless otherwise indicated.
Population
- 15,020,945 (July 2018 est.)
Age structure
- 0-14 years: 41.15% (male 3,106,942 /female 3,074,740)
- 15-24 years: 20.33% (male 1,521,868 /female 1,531,484)
- 25-54 years: 31.45% (male 2,176,052 /female 2,547,566)
- 55-64 years: 4.05% (male 261,682 /female 347,374)
- 65 years and over: 3.02% (male 200,079 /female 253,158) (2018 est.)
Median age
- total: 19 years. Country comparison to the world: 205th
- male: 18.1 years
- female: 19.9 years (2018 est.)
- Total: 18.8 years
- Male: 18 years
- Female: 19.7 years (2017 est.)
Birth rate
- 32.9 births/1,000 population (2018 est.) Country comparison to the world: 27th
- 33.4 births/1,000 population (2017 est.)
Death rate
- 7.9 deaths/1,000 population (2018 est.) Country comparison to the world: 94th
- 8.1 deaths/1,000 population (2017 est.)
Total fertility rate
- 4.2 children born/woman (2018 est.) Country comparison to the world: 30th
Population growth rate
- 2.36% (2018 est.) Country comparison to the world: 30th
- 2.39% (2017 est.)
Mother's mean age at first birth
- 21.9 years (2017 est.)
- 21.5 years (2016 est.)
note: median age at first birth among women 25-29
Contraceptive prevalence rate
- 25.1% (2016)
Net migration rate
- -1.4 migrant(s)/1,000 population (2018 est.) Country comparison to the world: 151st
Dependency ratios
- Total: 85.4
- Youth: 79.8
- Elderly: 5.6
- Potential support ratio: 18 (2015 est.)
Urbanization
- urban population: 47.2% of total population (2018)
- rate of urbanization: 3.73% annual rate of change (2015-20 est.)
Life expectancy at birth
- total population: 62.5 years
- male: 60.4 years
- female: 64.7 years (2018 est.)
- Total population: 62.1 years (2017 est.), 59.78 years (2011 est.), 59.25 years (2006 est.)
- Male: 60 years (2017 est.), 57.85 years (2011 est.), 57.7 years (2006 est.)
- Female: 64.3 years (2017 est.), 61.77 years (2011 est.), 60.85 years (2006 est.)
Religions
Muslim 95.9% (most adhere to one of the four main Sufi brotherhoods), Christian 4.1% (mostly Roman Catholic) (2016 est.)
Urbanization
- urban population: 47.2% of total population (2018)
- rate of urbanization: 3.73% annual rate of change (2015-20 est.)
Maternal mortality ratio
- 315 deaths/100,000 live births (2015 est.)
Drinking water source
- improved
- total: 78.5% of population
- urban: 92.9% of population
- rural: 67.3% of population
- unimproved
- total: 21.5% of population
- urban: 7.1% of population
- rural: 32.7% of population (2015 est.)
Literacy
definition: age 15 and over can read and write (2017 est.) total population: 51.9% male: 64.8% female: 39.8% (2017 est.)
- Total population: 57.7%
- Male: 69.7%
- Female: 46.6% (2015 est.)
School life expectancy (primary to tertiary education)
- total: 9 years
- male: 9 years
- female: 9 years (2017)
- total: 9 years
- male: 9 years
- female: 9 years (2015)
Unemployment, youth ages 15-24
- total: 5.3%
- male: 5.2%
- female: 5.5% (2015 est.)
Gender ratio
- At birth: 1.03 male(s)/female
- Under 15 years: 1.01 male(s)/female
- 15-64 years: 0.98 male(s)/female
- 65 years and over: 0.87 male(s)/females
- Total population: 0.99 male(s)/female (2011 est.)
Emigration
Senegal aforetime was a destination country for neighboring economic migrants, but in recent decades West African migrants more often use Senegal as a transit point to North Africa and also to illegally onward to Europe.[7] The country also has been host to several thousand black Mauritanian refugees since they were expelled from Mauritania during the 1989 border conflict with Senegal. The country’s economic crisis in the 1970s stimulated emigration; departures accelerated from the 1990s. Destinations shifted from neighboring countries to Libya and Mauritania, because of their booming oil industries, and to France, Italy and Spain.[7]
See also
References
- World Population Review: Senegal Population 2018, 14 June 2018
- Population Division of the Department of Economic and Social Affairs of the United Nations Secretariat, World Population Prospects: The 2010 Revision Archived 6 May 2011 at the Wayback Machine
- "United Nations Statistics Division - Demographic and Social Statistics". unstats.un.org.
- "MEASURE DHS: Demographic and Health Surveys". microdata.worldbank.org.
- "STATcompiler". www.statcompiler.com. Retrieved 17 February 2020.
- "World Population Prospects - Population Division - United Nations". esa.un.org. Retrieved 26 August 2018.
- "Africa :: SENEGAL". The World Factbook. CIA.
- Rapport National de Présentation du Recensement Général de la Population 1976 (RGP I) Archived 13 November 2012 at the Wayback Machine
- "United Nations Statistics Division - Demographic and Social Statistics". unstats.un.org.
- "The World FactBook - Sao Tome and Principe", The World Factbook, 12 July 2018
 This article incorporates text from this source, which is in the public domain.
External links
 Media related to Demographics of Senegal at Wikimedia Commons
|
| History |  | ||||
|---|---|---|---|---|---|
| Geography |
| ||||
| Politics |
| ||||
| Economy | |||||
| Society |
| ||||