Demographics of Eswatini
This article is about the demographic features of the population of Eswatini, including population density, ethnicity, education level, health of the populace, economic status, religious affiliations and other aspects of the population.
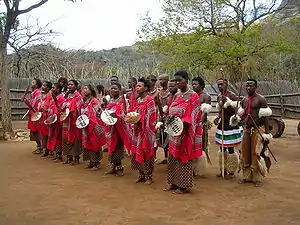
The majority of Eswatini's population is ethnic Swazi, mixed with a small number of Zulus and white Africans, predominantly of British and Afrikaner origin. This population also includes a small segment within it that is mixed with any number of these ancestries.
Traditionally Swazis have been subsistence farmers and herders, but most now work in the growing urban formal economy and in government. Some Swazis work in the mines in South Africa. Eswatini also received Portuguese settlers and black refugees from Mozambique. Christianity in Eswatini is sometimes mixed with traditional beliefs and practices. Most Swazis ascribe a special spiritual role to the Swazi Royal Family.
The country's official languages are Siswati (a language related to Zulu) and English. Government and commercial business is conducted mainly in English. Asians, Afrikaners, Portuguese, and black Mozambicans speak their own languages.
Population
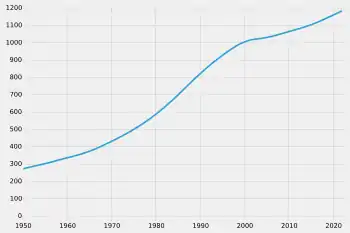
Eswatini's population is 1,113,276 according to the July 2021 estimate from the CIA World Factbook. The 2007 Census put the nation's population at 912,229. This number is lower than the 1997 Census, which gave 929,718 residents. The small difference is believed to be the result of massive emigration of Swazis to South Africa in search of work.[1]
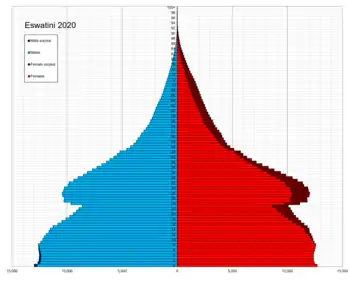
According to the 2010 revision of the World Population Prospects the total population was 1,186,000 in 2010, compared to only 273,000 in 1950. The proportion of children below the age of 15 in 2010 was 38.4%, 58.2% was between 15 and 65 years of age, while 3.4% was 65 years or older .[2]
| Total population | Population aged 0–14 (%) | Population aged 15–64 (%) | Population aged 65+ (%) | |
|---|---|---|---|---|
| 1950 | 273 000 | 43.0 | 54.3 | 2.7 |
| 1955 | 307 000 | 44.2 | 53 | 2.8 |
| 1960 | 349 000 | 45.2 | 52 | 2.8 |
| 1965 | 392 000 | 46.3 | 51.0 | 2.7 |
| 1970 | 446 000 | 47.2 | 50.1 | 2.7 |
| 1975 | 517 000 | 48.0 | 49.3 | 2.7 |
| 1980 | 603 000 | 48.8 | 48.5 | 2.7 |
| 1985 | 706 000 | 48.9 | 48.3 | 2.8 |
| 1990 | 863 000 | 48.1 | 49.2 | 2.7 |
| 1995 | 964 000 | 47.6 | 49.6 | 2.8 |
| 2000 | 1 064 000 | 44.6 | 52.4 | 3.0 |
| 2005 | 1 105 000 | 41.8 | 55 | 3.2 |
| 2010 | 1 186 000 | 38.4 | 58.2 | 3.4 |
Vital statistics
Registration of vital events is in Eswatini not complete. The Population Department of the United Nations prepared the following estimates. [2]
| Period | Live births per year | Deaths per year | Natural change per year | CBR* | CDR* | NC* | TFR* | IMR* |
|---|---|---|---|---|---|---|---|---|
| 1950-1955 | 14 000 | 7 000 | 7 000 | 48.1 | 22.6 | 25.5 | 6.70 | 174 |
| 1955-1960 | 16 000 | 7 000 | 9 000 | 47.6 | 20.8 | 26.8 | 6.70 | 160 |
| 1960-1965 | 18 000 | 7 000 | 10 000 | 47.9 | 19.6 | 28.2 | 6.75 | 150 |
| 1965-1970 | 20 000 | 8 000 | 13 000 | 49.0 | 18.5 | 30.4 | 6.85 | 141 |
| 1970-1975 | 24 000 | 8 000 | 16 000 | 49.3 | 16.4 | 32.9 | 6.87 | 124 |
| 1975-1980 | 27 000 | 8 000 | 19 000 | 48.5 | 14.2 | 34.2 | 6.73 | 108 |
| 1980-1985 | 31 000 | 8 000 | 23 000 | 47.7 | 12.0 | 35.7 | 6.54 | 90 |
| 1985-1990 | 36 000 | 8 000 | 28 000 | 46.1 | 10.3 | 35.8 | 6.13 | 77 |
| 1990-1995 | 36 000 | 9 000 | 28 000 | 39.9 | 9.4 | 30.4 | 5.30 | 69 |
| 1995-2000 | 35 000 | 12 000 | 22 000 | 34.1 | 11.9 | 22.1 | 4.49 | 80 |
| 2000-2005 | 34 000 | 17 000 | 17 000 | 31.8 | 15.7 | 16.1 | 4.01 | 87 |
| 2005-2010 | 34 000 | 17 000 | 17 000 | 30.1 | 14.9 | 15.2 | 3.57 | 76 |
| * CBR = crude birth rate (per 1000); CDR = crude death rate (per 1000); NC = natural change (per 1000); IMR = infant mortality rate per 1000 births; TFR = total fertility rate (number of children per woman) | ||||||||
Fertility and Births
Total Fertility Rate (TFR) (Wanted Fertility Rate) and Crude Birth Rate (CBR):[3]
| Year | CBR Total | TFR Total | CBR Urban | TFR Urban | CBR Rural | TFR Rural |
|---|---|---|---|---|---|---|
| 1986 | 6,4 | |||||
| 1991 | 5,6 | |||||
| 1997 | 4,5 | |||||
| 1999-2002 | 4,2 | |||||
| 2006-2007 | 31,1 | 3,8 (2,1) | 31,9 | 3,0 (1,8) | 31,0 | 4,2 (2,2) |
Life expectancy at birth
Life expectancy from 1950 to 2015 (UN World Population Prospects):[4]
| Period | Life expectancy in Years |
|---|---|
| 1950–1955 | 41.44 |
| 1955–1960 | |
| 1960–1965 | |
| 1965–1970 | |
| 1970–1975 | |
| 1975–1980 | |
| 1980–1985 | |
| 1985–1990 | |
| 1990–1995 | |
| 1995–2000 | |
| 2000–2005 | |
| 2005–2010 | |
| 2010–2015 |
Other demographic statistics
Demographic statistics according to the World Population Review in 2019.[5]
- One birth every 14 minutes
- One death every 41 minutes
- One net migrant every 288 minutes
- Net gain of one person every 22 minutes
The following demographic statistics are from the CIA World Factbook.[6]
Population
- 1,087,200 (July 2018 est.)
Median age
- total: 23.2 years. Country comparison to the world: 175th
- male: 22.2 years
- female: 24 years (2018 est.)
- total: 21.7 years
- male: 21.5 years
- female: 21.9 years (2017 est.)
Age structure
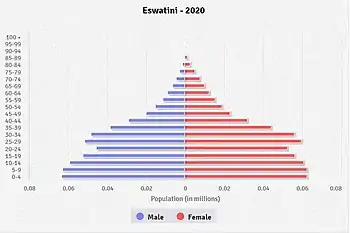
- 0-14 years: 34.41% (male 186,747 /female 187,412)
- 15-24 years: 19.31% (male 99,192 /female 110,770)
- 25-54 years: 38.22% (male 193,145 /female 222,405)
- 55-64 years: 4.28% (male 19,915 /female 26,663)
- 65 years and over: 3.77% (male 15,470 /female 25,481) (2018 est.)
- 0-14 years: 35.01% (male 259,646/female 253,976)
- 15-24 years: 22.12% (male 164,117/female 160,478)
- 25-54 years: 34.6% (male 264,262/female 243,362)
- 55-64 years: 4.3% (male 25,319/female 37,763)
- 65 years and over: 3.97% (male 22,113/female 36,116) (2017 est.)
Population growth rate
- 0.82% (2018 est.) Country comparison to the world: 128th
- 1.08% (2017 est.)
Birth rate
- 25.8 births/1,000 population (2018 est.) Country comparison to the world: 48th
- 24 births/1,000 population (2017 est.)
Death rate
- 10.7 deaths/1,000 population (2018 est.)
- 13.2 deaths/1,000 population (2017 est.)
Total fertility rate
- 2.63 children born/woman (2018 est.) Country comparison to the world: 68th
- 2.69 children born/woman (2017 est.)
Net migration rate
- 0 migrant(s)/1,000 population (2017 est.) Country comparison to the world: 82nd
Contraceptive prevalence rate
- 66.1% (2014)
Dependency ratios
- total dependency ratio: 68.8 (2015 est.)
- youth dependency ratio: 63.5 (2015 est.)
- elderly dependency ratio: 5.2 (2015 est.)
- potential support ratio: 19.1 (2015 est.)
Urbanization
- urban population: 23.8% of total population (2018)
- rate of urbanization: 2.46% annual rate of change (2015-20 est.)
Maternal mortality rate
389 deaths/100,000 live births (2015 est.)
Infant mortality rate
- total: 48.4 deaths/1,000 live births
- male: 52.2 deaths/1,000 live births
- female: 44.4 deaths/1,000 live births (2017 est.)
Life expectancy at birth
- total population: 57.2 years
- male: 55.1 years
- female: 59.3 years (2018 est.)
- male: 52.7 years (2017 est.)
- female: 51.5 years (2017 est.)
- total population:
- 49.06 (2012 est.)
- 47.85 (2010 est.)
- 33.22 (2005 est.)
- 39.47 (2003 est.)
Sex ratio
- at birth: 1.02 (2017, 2003 est.), 1.03 male(s)/female (2000 est.)
- 0-14 years: 1.02 (2017 est.), 0.99 male(s)/female (2003, 2000 est.)
- 15-24 years: 1.08 (2017 est.)
- 25-54 years: 0.66 male(s)/female (2017 est.)
- 65 years and over: 0.64 (2017 est.), 0.78 (2003 est.), 0.7 male(s)/female (2000 est.)
- total population: 1 (2017 est.), 0.99 (2003 est.), 0.95 male(s)/female (2000 est.)
Education expenditures
7.1% of GDP (2014)
Health expenditures
9.3% of GDP (2014)
Obesity - adult prevalence rate
16.5% (2016)
Children under the age of 5 years underweight
5.8% (2014)
Physicians density
0.15 physicians/1,000 population (2009)
Hospital bed density
2.1 beds/1,000 population (2011)
HIV/AIDS
- adult prevalence rate: 27.4% (2017 est.)
- people living with HIV/AIDS: 210,000 (2017 est.)
- deaths: 3,500 (2017 est.)
Major infectious diseases
- degree of risk: intermediate
- food or waterborne diseases: bacterial diarrhea, hepatitis A, and typhoid fever
- vectorborne disease: malaria
- water contact disease: schistosomiasis (2016)
Nationality
noun: Swazi(s) adjective: Swazi
Religions[8]
- Zionist 40% (a blend of Christianity and Indigenous ancestral worship)
- Roman Catholic 20%
- Islam 2%
- Other Christian 30% (includes Anglican, Methodist, Latter-Day Saint, Jehovah's Witness)
- Other non-Christian 8% (includes Baháʼí, Buddhist, Hindu, indigenous religionist, Sikhism Judaism)
Literacy
- definition: age 15 and over can read and write
- total population: 87.5% (2015 est.), 81.6% (2003 est.), 76.7% (1995 est.)
- male: 87.4% (2015 est.), 82.6% (2003 est.), 78% (1995 est.)
- female: 87.5% (2015 est.), 80.8% (2003 est.), 75.6% (1995 est.)
School life expectancy (primary to tertiary education)
- total: 11 years (2013)
- male: 12 years (2013)
- female: 11 years (2013)
See also
Notes
| Wikimedia Commons has media related to Demographics of Eswatini. |
- Nolen, Stephanie (2009-04-03). "Where have all the Swazis gone?". The Globe and Mail. Archived from the original on December 26, 2015. Retrieved 2015-12-26.
- Population Division of the Department of Economic and Social Affairs of the United Nations Secretariat, World Population Prospects: The 2010 Revision Archived May 6, 2011, at the Wayback Machine
- http://www.safaids.net/files/Swaziland%20Demographic%20and%20Health%20Survey%202006-2007.pdf%5B%5D
- "World Population Prospects – Population Division – United Nations". Archived from the original on 2016-09-19. Retrieved 2017-07-15.
- "Swaziland Population 2019", World Population Review
- "The World FactBook - Eswatini", The World Factbook, July 12, 2018
 This article incorporates text from this source, which is in the public domain.
 - "Archived copy". Archived from the original on 2018-05-29. Retrieved 2018-04-23.CS1 maint: archived copy as title (link)
- "Africa :: ESWATINI". CIA The World Factbook. Retrieved 12 September 2018.
| History |  | ||
|---|---|---|---|
| Geography | |||
| Politics | |||
| Economy |
| ||
| Society | |||
![]() This article incorporates public domain material from the CIA World Factbook website https://www.cia.gov/the-world-factbook/.
This article incorporates public domain material from the CIA World Factbook website https://www.cia.gov/the-world-factbook/.