Demographics of Ethiopia
The demographics of Ethiopia encompass the demographic features of Ethiopia's inhabitants, including ethnicity, languages, population density, education level, health, economic status, religious affiliations and other aspects of the population.
| Demographics of Ethiopia | |
|---|---|
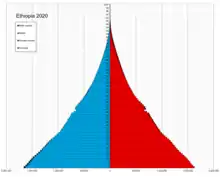 Ethiopia population pyramid in 2020 | |
| Population | 109,224,414[1][2] |
| Growth rate | 2.9% (2013 est.) (12th) |
| Birth rate | 33.5 births/1,000 population (2012 est.)[3] |
| Death rate | 7.8 deaths/1,000 population (2012 est.) |
| Life expectancy | 60 years (2013 est.) |
| • male | 57.73 years (2013 est.) |
| • female | 62.35 years (2013 est.) |
| Fertility rate | 4.6 children born/woman (2012 est.) |
| Infant mortality rate | 68 deaths/1,000 live births (2012 est.) |
| Sex ratio | |
| At birth | 1.03 male(s)/female (2013 est.) |
| Under 15 | 1.00 male(s)/female (2009 est.) |
| 15–64 years | 0.99 male(s)/female (2009 est.) |
| 65 and over | 0.95 male(s)/female (2009 est.) |
| Nationality | |
| Major ethnic | See Ethnic Groups of Ethiopia |
| Language | |
| Official | See Languages of Ethiopia |
Ethnic groups
The country's population is highly diverse, comprising over 80 different ethnic groups. Most people in Ethiopia speak Afroasiatic languages, mainly of the Semitic or Cushitic branches. Among these are the Oromo, Amhara, Somali and Tigrayans, who together constitute around three-quarters of the population.
Nilo-Saharan-speaking Nilotic ethnic minorities also inhabit the southern regions of the country, particularly in areas bordering South Sudan. Among these are the Mursi and Anuak.
White Ethiopians
White people are born of Italian, Greek, African American, Swedish, Jamaican and Armenian descent. White Ethiopians live in Addis Ababa, Dire Dawa, and other various locales.
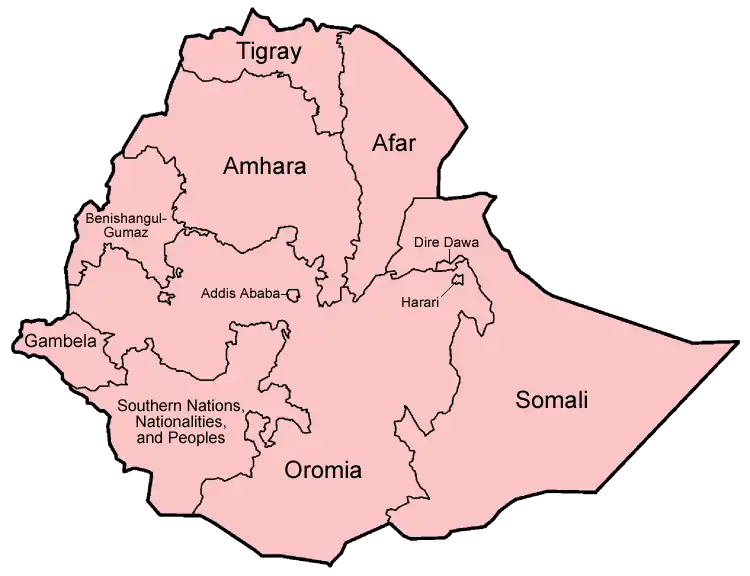
Languages
Ethiopia, like most countries in Africa, is a multi-ethnic state. Although the original physical differences between the major ethnic groups have been blurred by centuries, if not millennia, of intermarriage, there remain many who are distinct and unique.
Ethnic differences may also be observed from the great variety of languages spoken in the country, of which there are eighty-three, with 200 dialects. These can be broken into four main groups: Semitic, Cushitic, Omotic, and Nilo-Saharan.
The Semitic languages of Ethiopia are related to both Hebrew and Arabic. The Ethiopian languages of this family are derived from Ethio-Semitic the ancestor of Ge'ez, the language of the ancient Axumite kingdom, which was also the language of the country's literature prior to the mid-nineteenth century, as well as parts of most present-day church services.
Ethiopia's Semitic languages are today spoken mainly in the north and centre of the country. The most important of them in the north is Tigrinya, which is used throughout Tigray.
The principal Semitic language of the north-western and centre of the country is Amharic, which is the language of the Amhara Region. Moreover, Amharic is also the official language of administration of all Ethiopia, and the language of much modern Ethiopian literature.
Two other Semitic languages are spoken to the south and east of Addis Ababa: the Gurage languages, a cluster of languages used by the Gurage in an area to the south of the capital, and Adare, a tongue spoken only within the old walled city of Harar and used by the Adare people, also known as Harrari.
The Cushitic languages, which are less closely related than the Semitic, are found mainly in the south of the country. The most important tongue in this group is Oromo. It is used in a wide stretch of the country, including Oromia, Dire Dawa, Harari Region, Oromia Zone and Addis Ababa and the surrounding Special Zone.
Oromo serves as the official working language of the Oromia,[5] Harar and Dire Dawa regional states and of the Oromia Zone in the Amhara Region. It is a language of primary education in Oromia, Harar, Dire Dawa, Addis Ababa and of the Oromia Zone in the Amhara Region. It is used as an internet language for federal websites along with Tigrinya.[6][7]
Other Cushitic languages in the area comprise Somali, which is spoken by the Somali in the Somali Region to the east, as well as in the neighboring Somali Republic and parts of Djibouti, and the Sidamo language, used in the Sidama Region. Cushitic languages, however, are also used in the north of the country, namely Afar, spoken in the Afar Region and the northern half of the Djibouti Republic; Saho, in parts of Tigray; and Agaw, a group of languages in various pockets in western and northern Ethiopia.
The Omotic group of languages, which comprise considerably fewer speakers than either the Semitic or the Cushitic languages, are spoken in the south-west of the country. They have been given that name because they are spoken in the general area of the Omo River.
The Nilo-Saharan languages are spoken in a wide arc of the country towards the Sudan and South-Sudan frontier. They include, from north to south, Gumuz and Berta in the Benishangul-Gumuz Region, and Anuak in Gambela Region.
Religion
Various religions are adhered to in Ethiopia. Most Christians live in the highlands, whereas Muslims mainly inhabit the lowlands. Adherents of traditional faiths are primarily concentrated in the southern regions.
According to the Ethiopian Central Statistical Agency (2007 census), the national religious composition is Ethiopian Orthodox 43.5%, Protestantism 18.6%, Roman Catholicism 0.7%, Islam 33.9%, traditional 2.6%, and others 0.6%.[8]
Population
| Year | Pop. | ±% p.a. |
|---|---|---|
| 2011 | 85,555,555 | — |
| 2012 | 84,320,987 | −1.44% |
| 2013 | 86,613,986 | +2.72% |
Source: Central Statistical Agency (CSA)[9]
UN estimates
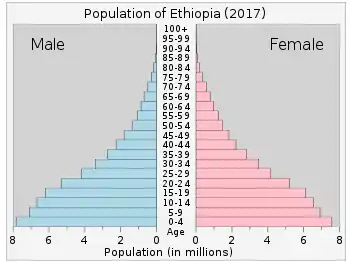
According to the 2019 revision of the World Population Prospects[1][2], the total population was 109,224,414 in 2018, compared to 18,434,000 in 1950. The proportion of children below the age of 15 in 2010 was 41.5%, 55.8% was between 15 and 65 years of age, while 3.3% was 65 years or older. The average age was 25.1.[10]
| Total population | Population aged 0–14 (%) | Population aged 15–64 (%) | Population aged 65+ (%) | |
|---|---|---|---|---|
| 1950 | 18 434 000 | 44.1 | 52.9 | 3 |
| 1955 | 20 298 000 | 43.9 | 53.3 | 2.8 |
| 1960 | 22 553 000 | 43.5 | 53.8 | 2.6 |
| 1965 | 25 480 000 | 43.5 | 53.9 | 2.6 |
| 1970 | 28 959 000 | 44.1 | 53.3 | 2.7 |
| 1975 | 32 959 000 | 44.5 | 52.7 | 2.8 |
| 1980 | 35 426 000 | 44.5 | 52.6 | 2.9 |
| 1985 | 41 078 000 | 44.6 | 52.6 | 2.9 |
| 1990 | 48 333 000 | 45.4 | 52.1 | 2.9 |
| 1995 | 57 042 000 | 45.9 | 51.2 | 2.9 |
| 2000 | 65 578 000 | 45.9 | 51.1 | 3.0 |
| 2005 | 74 264 000 | 44.5 | 52.4 | 3.1 |
| 2010 | 82 950 000 | 41.5 | 55.2 | 3.3 |
UN projections
Below are the UN's medium variant projections:[10]
| Year | Pop. | ±% p.a. |
|---|---|---|
| 2020 | 114,963,583 | — |
| 2025 | 129,749,447 | +2.45% |
| 2030 | 144,944,302 | +2.24% |
| 2035 | 160,230,927 | +2.03% |
| 2040 | 175,465,980 | +1.83% |
| 2045 | 190,610,528 | +1.67% |
| 2050 | 205,410,671 | +1.51% |
Vital statistics
Registration of vital events in Ethiopia is incomplete. The Population Department of the United Nations prepared the following estimates: [10]
| Period | Live births per year | Deaths per year | Natural change per year | CBR | CDR | NC | TFR | IMR |
|---|---|---|---|---|---|---|---|---|
| 1950-1955 | 956 000 | 580 000 | 377 000 | 49.4 | 29.9 | 19.5 | 7.17 | 199 |
| 1955-1960 | 1 027 000 | 572 000 | 455 000 | 47.9 | 26.7 | 21.2 | 6.90 | 181 |
| 1960-1965 | 1 155 000 | 565 000 | 589 000 | 48.1 | 23.5 | 24.5 | 6.90 | 160 |
| 1965-1970 | 1 298 000 | 594 000 | 704 000 | 47.7 | 21.8 | 25.9 | 6.87 | 148 |
| 1970-1975 | 1 450 000 | 638 000 | 812 000 | 46.8 | 20.6 | 26.2 | 6.81 | 140 |
| 1975-1980 | 1 579 000 | 676 000 | 902 000 | 46.2 | 19.8 | 26.4 | 6.76 | 135 |
| 1980-1985 | 1 804 000 | 794 000 | 1 011 000 | 47.2 | 20.8 | 26.4 | 6.94 | 140 |
| 1985-1990 | 2 145 000 | 850 000 | 1 295 000 | 48.0 | 19.0 | 29.0 | 7.06 | 127 |
| 1990-1995 | 2 501 000 | 913 000 | 1 588 000 | 47.5 | 17.3 | 30.1 | 7.00 | 115 |
| 1995-2000 | 2 694 000 | 932 000 | 1 763 000 | 43.9 | 15.2 | 28.7 | 6.48 | 101 |
| 2000-2005 | 2 713 000 | 908 000 | 1 805 000 | 38.8 | 13.0 | 25.8 | 5.60 | 87 |
| 2005-2010 | 2 619 000 | 822 000 | 1 797 000 | 33.3 | 10.5 | 22.9 | 4.60 | 72 |
| 2010-2015 | 3 108 000 | 730 000 | 2 378 000 | 4.59 |
CBR = crude birth rate (per 1,000); CDR = crude death rate (per 1,000); NC = natural change (per 1,000); IMR = infant mortality rate per 1,000 births; TFR = total fertility rate (number of children per woman)
Births and deaths[11]
| Year | Population | Live births | Deaths | Natural increase | Crude birth rate | Crude death rate | Rate of natural increase | TFR |
|---|---|---|---|---|---|---|---|---|
| 2007* | 73 750 932 | 2 218 457 | 839 038 | 1 379 419 | 28,8 | 10,9 | 17,9 | 4,16 |
- Data refer to the 12 months preceding the census in May.
Life expectancy
| Period | Life expectancy in Years |
Period | Life expectancy in Years |
|---|---|---|---|
| 1950–1955 | 34.1 | 1985–1990 | 46.2 |
| 1955–1960 | 36.7 | 1990–1995 | 48.1 |
| 1960–1965 | 40.1 | 1995–2000 | 50.7 |
| 1965–1970 | 42.1 | 2000–2005 | 53.6 |
| 1970–1975 | 43.5 | 2005–2010 | 59.1 |
| 1975–1980 | 44.3 | 2010–2015 | 63.7 |
| 1980–1985 | 43.5 |
Source: UN World Population Prospects[12]
Total Fertility rate in Ethiopia (Census 2007)
As per 2007 Population and Housing Census of Ethiopia [13]
| Region | Urban TFR | Rural TFR | Total TFR (U+R) |
|---|---|---|---|
| Ethiopia (Country Total) | 2,220 | 4,650 | 4,160 |
| Tigray Region | 2,915 | 4,905 | 4,440 |
| Affar Region | 2,440 | 2,000 | 2,075 |
| Amhara Region | 2,135 | 4,540 | 4,175 |
| Oromia Region | 2,635 | 5,235 | 4,845 |
| Somali Region | 2,175 | 1,985 | 2,010 |
| Benishangul - Gumuz Region | 3,005 | 4,800 | 4,520 |
| S.N.N.P Region | 2,750 | 4,715 | 4,495 |
| Gambella Region | 2,725 | 2,930 | 2,885 |
| Harari Region | 1,725 | 4,725 | 2,885 |
| Addis Ababa City Administration | 1,485 | - | 1,485 |
| Dira Dawa City Administration | 2,155 | 5,455 | 2,985 |
| Region 17 | 3,210 | 2,585 | 2,845 |
Fertility and Births (Demographic and Health Surveys)
Total Fertility Rate (TFR) (Wanted Fertility Rate) and Crude Birth Rate (CBR):[14]
| Year | CBR (Total) | TFR (Total) | CBR (Urban) | TFR (Urban) | CBR (Rural) | TFR (Rural) |
|---|---|---|---|---|---|---|
| 2000 | 41.3 | 5.9 (4.9) | 30.7 | 3.3 (2.7) | 42.9 | 6.4 (5.4) |
| 2005 | 35.7 | 5.4 (4.0) | 23.4 | 2.4 (1.8) | 37.3 | 6.0 (4.5) |
| 2011 | 34.5 | 4.8 (3.8) | 26.4 | 2.6 | 36.2 | 5.5 |
| 2016 | 31.8 | 4.6 (3.6) | 23.9 | 2.3 (2.1) | 33.2 | 5.2 (4.0) |
| 2019 | 26.5 | 4.1 | 24.6 | 3.2 | 27.2 | 4.5 |
Fertility data as of 2011 (DHS Program):[15]
| Region | Total fertility rate | Percentage of women age 15-49 currently pregnant | Mean number of children ever born to women age 40-49 |
|---|---|---|---|
| Tigray | 4.6 | 7.2 | 6.4 |
| Afar | 5.0 | 9.9 | 7.3 |
| Amhara | 4.2 | 4.7 | 6.9 |
| Oromiya | 5.6 | 8.3 | 7.1 |
| Somali | 7.1 | 12.4 | 7.9 |
| Benishangul-Gumuz | 5.2 | 10.2 | 6.6 |
| SNNP | 4.9 | 9.3 | 7.3 |
| Gambela | 4.0 | 5.7 | 5.6 |
| Harari | 3.8 | 6.7 | 5.5 |
| Addis Ababa | 1.5 | 3.6 | 3.3 |
| Dire Dawa | 3.4 | 7.2 | 4.8 |
Other demographic statistics
Demographic statistics according to the World Population Review in 2019.[5]
- One birth every 10 seconds
- One death every 45 seconds
- One net migrant every 44 minutes
- Net gain of one person every 12 seconds
The following demographic statistics are from the CIA World Factbook.[16]
Age structure
- 0-14 years: 43.21% (male 23,494,593 /female 23,336,508)
- 15-24 years: 20.18% (male 10,857,968 /female 11,011,100)
- 25-54 years: 29.73% (male 15,978,384 /female 16,247,086)
- 55-64 years: 3.92% (male 2,059,129 /female 2,185,814)
- 65 years and over: 2.97% (male 1,445,547 /female 1,770,262) (2018 est.)
- 0-14 years: 43.94% (male 21,900,571/female 21,809,643)
- 15-24 years: 19.98% (male 9,865,976/female 10,009,596)
- 25-54 years: 29.31% (male 14,487,280/female 14,667,179)
- 55-64 years: 3.88% (male 1,882,315/female 1,981,762)
- 65 years and over: 2.88% (male 1,289,336/female 1,572,161) (2015 est.)
Median age
- total: 18 years. Country comparison to the world: 213rd
- male: 17.8 years
- female: 18.2 years (2018 est.)
- total: 17.7 years
- male: 17.5 years
- female: 17.8 years (2015 est.)
Population growth rate
- 2.83% (2018 est.) Country comparison to the world: 11th
- 2.89% (2015 est.)
Birth rate
- 36 births/1,000 population (2018 est.) Country comparison to the world: 17th
- 37.27 births/1,000 population (2015 est.)
Death rate
- 7.5 deaths/1,000 population (2018 est.) Country comparison to the world: 110th
- 8.19 deaths/1,000 population (2015 est.)
Total fertility rate
- 4.91 children born/woman (2018 est.) Country comparison to the world: 15th
- 5.15 children born/woman (2015 est.)
Net migration rate
- -0.2 migrant(s)/1,000 population (2017 est.) Country comparison to the world: 107th
Mother's mean age at first birth
- 20 years (2016 est.)
- note: median age at first birth among women 25-29
Contraceptive prevalence rate
- 36.5% (2017)
Urbanization
- urban population: 20.8% of total population (2018)
- rate of urbanization: 4.63% annual rate of change (2015-20 est.)
- urban population: 19.5% of total population (2015)
- rate of urbanization: 4.89% annual rate of change (2010-15 est.)
Dependency ratios
- total dependency ratio: 82.1 (2015 est.)
- youth dependency ratio: 75.8 (2015 est.)
- elderly dependency ratio: 6.3 (2015 est.)
- potential support ratio: 15.8 (2015 est.)
Sex ratio
- at birth: 1.03 male(s)/female
- 0-14 years: 1 male(s)/female
- 15-24 years: 0.99 male(s)/female
- 25-54 years: 0.99 male(s)/female
- 55-64 years: 0.95 male(s)/female
- 65 years and over: 0.82 male(s)/female
- total population: 0.99 male(s)/female (2015 est.)
Life expectancy at birth
- total population: 63 years
- male: 60.5 years
- female: 65.5 years (2018 est.)
- total population: 61.48 years
- male: 59.11 years
- female: 63.93 years (2015 est.)
HIV/AIDS
- adult prevalence rate: 1.15%
- people living with HIV/AIDS: 730,300
- deaths: 23,400 (2014 est.)
Literacy
- definition: age 15 and over can read and write
- total population: 49.1%
- male: 57.2%
- female: 41.1% (2015 est.)
School life expectancy (primary to tertiary education)
- total: 8 years (2012)
- male: 9 years (2012)
- female: 8 years (2012)
Unemployment, youth ages 15-24
- total: 25.2% (2016 est.) Country comparison to the world: 46th
- male: 17.1% (2016 est.)
- female: 30.9% (2016 est.)
See also
| Wikimedia Commons has media related to Demographics of Ethiopia. |
References
- ""World Population prospects – Population division"". population.un.org. United Nations Department of Economic and Social Affairs, Population Division. Retrieved November 9, 2019.
- ""Overall total population" – World Population Prospects: The 2019 Revision" (xslx). population.un.org (custom data acquired via website). United Nations Department of Economic and Social Affairs, Population Division. Retrieved November 9, 2019.
- "Statistics". Unicef.org. Retrieved 27 August 2017.
- "Table 2.2 Percentage distribution of major ethnic groups: 2007" (PDF). Summary and Statistical Report of the 2007 Population and Housing Census Results. Population Census Commission. p. 16. Archived from the original (PDF) on 25 March 2009. Retrieved 14 December 2020.
- "Ethiopia Population 2019", World Population Review
- http://www.mcit.gov.et/. Missing or empty
|title=(help) - "ቤት | FMOH". www.moh.gov.et.
- "Summary and Statistical Report of the 2007 Population and Housing Census" (PDF). 14 February 2012. Archived from the original on 14 February 2012. Retrieved 27 August 2017.CS1 maint: bot: original URL status unknown (link)
- "Archived copy". Archived from the original on 2013-05-05. Retrieved 2013-04-29.CS1 maint: archived copy as title (link)
- "Population Division of the Department of Economic and Social Affairs of the United Nations Secretariat, World Population Prospects: The 2010 Revision". Esa.un.org. Retrieved 2017-08-27.
- "3. Live births, deaths, and infant deaths, latest available year (2002 - 2016)" (PDF). Unstats.un.org. Retrieved 2017-08-27.
- "World Population Prospects – Population Division – United Nations". Retrieved 2017-07-15.
- "Country Level". 2007 Population and Housing Census of Ethiopia. CSA. 13 July 2010. Retrieved 18 January 2013.
- "MEASURE DHS: Demographic and Health Surveys". Microdata.worldbank.org. Retrieved 2017-08-27.
- "Ethiopia Demographic and Health Survey 2011" (PDF). Dhsprogram.com. Retrieved 2017-08-27.
- "The World FactBook - Ethiopia", The World Factbook, July 12, 2018
 This article incorporates text from this source, which is in the public domain.
![]() This article incorporates public domain material from the CIA World Factbook document: "2006 edition".
This article incorporates public domain material from the CIA World Factbook document: "2006 edition".
| Afro-Asiatic |
| ||||
|---|---|---|---|---|---|
| Omotic | |||||
| Nilo-Saharan | |||||
| Non-Indigenous | |||||