Demographics of Eritrea
Eritrea has an estimated population of approximately 5,750,433 in 2019.[2][3][4][5][6] The population has doubled over the past 30 years, with an accelerating growth rate estimated at close to 3.2% p.a. during 2005–2010.
 | |
| Regions with significant populations | |
|---|---|
| Languages | |
| Languages of Eritrea | |
| Religion | |
| Predominantly: Christianity (Eritrean Orthodoxy, Protestantism, Catholicism),[1] and · Islam (Sunni) |
The nation has nine recognized ethnic groups.[7] According to SIL Ethnologue, Tigriniya make up about 60% of the population; the Tigre people make up about 30% of population, who also speak a Semitic language, constitute around 30% of residents. Most of the rest of the population belong to other Afro-Asiatic-speaking communities of the Cushitic branch. Additionally, there are a number of Nilo-Saharan-speaking ethnic minorities and other smaller groups.[7][8]
A majority of Eritrea's population adheres to Abrahamic religions. The two most followed religions are Christianity and Islam, which have an almost equal number of followers.
Ethno-linguistic groups
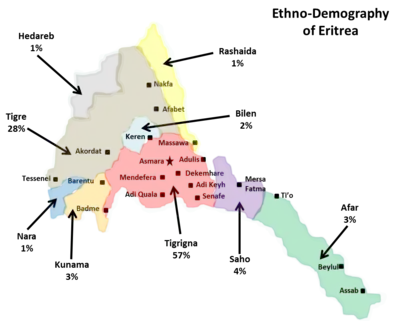
Eritrea's population comprises nine recognized ethnic groups, most of whom speak languages from the Ethiopian Semitic branch of the Afro-Asiatic family.[8] The East African Semitic languages spoken in Eritrea are Tigre, Tigrinya, and the newly recognized Dahlik. Other Afro-Asiatic languages belonging to the Cushitic branch are also widely spoken in the country.[8] The latter include Afar, Beja, Blin, and Saho.
In addition, languages belonging to the Nilo-Saharan language family (Kunama and Nara) are spoken as a mother tongue by the Kunama and Nara Nilotic ethnic minorities that live in the north and northwestern part of the country.[8] The Rashaida speak Arabic, while there are also a number of Italians who speak their native Italian language.
Tigrinya
The majority of the Tigrinya inhabit the highlands of Eritrea; however, migration to other parts of the country has occurred. Their language is called Tigrinya. They are the largest ethnic group in the country, constituting about 60% of the population.[7] The predominantly Tigrinya populated urban centers in Eritrea are the capital Asmara, Mendefera, Dekemhare, Adi Keyh, Adi Quala and Senafe, while there is a significant population of Tigrinya in other cities including Keren, and Massawa.
They are 96% Christians, (of which 90% are of the Eritrean Orthodox faith, 5% Roman Catholic and Eastern Catholic (whose mass is held in Ge'ez as opposed to Latin), and 5% belonging to various Protestant and other Christian denominations, the majority of which belong to the (Lutheran) Evangelical Church of Eritrea).
Tigre
The Tigre reside in the western lowlands in Eritrea. Many also migrated to Sudan at the time of the Ethiopian-Eritrean conflict and lived there since. They are a nomadic and pastoralist people, related to the Tigrinya and to the Beja people. They are a predominantly Muslim nomadic people who inhabit the northern, western, and coastal lowlands of Eritrea, where they constitute 30% of local residents.[7] Some also inhabit areas in eastern Sudan. 95% of the Tigre people adhere to the Islamic religion Sunni Islam, but there are a small number of Christians among them as well (often referred to as the Mensaï in Eritrea). Their language is called Tigre.
Rashaida
The Rashaida are one of Eritrea's nine recognized ethnic groups. They represent around 2% of the population of Eritrea.[7] The Rashaida reside in the northern coastal lowlands of Eritrea and the northern eastern coasts of Sudan. They are predominantly Muslim and are the only ethnic group in Eritrea to have Arabic as their communal language, specifically the Hejazi dialect. The Rashaida first came to Eritrea in the 19th century from the Arabian Coast.[9]
Jeberti
The Jeberti people in Eritrea trace descent from early Muslim adherents. The term Jeberti is also locally sometimes used to generically refer to all Islamic inhabitants of the highlands.[10] The Jeberti in Eritrea speak Arabic and Tigrinya.[11] They account for about 4% of the Tigrinya speakers in the nation.
Afar
According to the CIA, the Afar constitute under 5% of the nation's population.[7] They live in the Debubawi Keyih Bahri Region of Eritrea, as well as the Afar Region in Ethiopia, and Djibouti. They speak the Afar language as a mother tongue, and are predominantly Muslim. Afars in Eritrea number about 397,000 individuals, the smallest population out of the countries they reside in. In Djibouti, there are about 780,000 group members, and in Ethiopia, they number approximately 1,300,000.
Saho
The Saho represent 4% of Eritrea's population.[7] They principally reside in the Debubawi Keyih Bahri Region and the Northern Red Sea Region of Eritrea. Their language is called Saho. They are predominantly Muslim, although a few Christians known as the Irob live in the Debub Region of Eritrea and the Tigray region of Ethiopia.
Bilen
The Bilen in Eritrea represent around 2% of the country's population.[7] They are primarily concentrated in the north-central areas, in and around the city of Keren, and south towards Asmara, the nation's capital. Many of them entered Eritrea from Kush (central Sudan) in the 8th century and settled at Merara, after which they went to Lalibela and Lasta. The Bilen then returned to Axum in Ethiopia's Tigray Province, and battled with the natives; in the resulting aftermath, the Bilen returned to their main base at Merara. The Bilen include adherents of both Islam and Christianity. They speak the Bilen as a mother tongue. Christian adherents are mainly urban and have intermingled with the Tigrinya who live in the area. Muslim adherents are mainly rural and have interbred with the adjacent Tigre.
Beja
The Beja in Eritrea, or Hedareb, constitute under 5% of local residents.[7] They mainly live along the north-western border with Sudan. Group members are predominantly Muslim and communicate in Hedareb as a first or second language. The Beja also include the Beni-Amer people, who have retained their native Beja language alongside Hedareb.
Kunama
According to the CIA, the Kunama constitute around 2% of Eritrea's population.[7] They mainly live in the country's Gash Barka Region, as well as in adjacent parts of Ethiopia's Tigray Region. Many of them reside in the contested border village of Badme. Their language is called Kunama. Although some Kunama still practice traditional beliefs, most are converts to either Christianity (Roman Catholic and Protestant) or Islam.
Nara
The Nara represent under 5% of the nation's population.[7] They principally reside along the south-western border with Sudan and Ethiopia. They are generally Muslim, with a few Christians and some practising their indigenous beliefs. Their language is called Nara.
Italians
A few monolingual Italian Eritreans remain. As of 2008, they were estimated at 900 people, down from around 38,000 residents at the end of World War II.
Religion
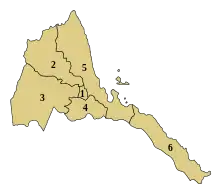
People in Eritrea practice various religions. According to the Pew Research Center (2010), 62.9% of the population are Christian, mostly followers of Eritrean Orthodox Tewahdo, and to a lesser extent, Roman Catholicism, with the second-largest denomination being Muslims.[13] In general, most local residents who adhere to Christianity live in the Maekel and Debub regions, whereas those who follow Islam predominantly inhabit the Anseba, Northern Red Sea, Southern Red Sea and Gash-Barka regions. A few adherents of traditional faiths can also be found, particularly in the lowlands.
| Region | Population | Christians60% | Muslims 40% | Other1% |
|---|---|---|---|---|
| Maekel Region, ዞባ ማእከል | 1,053,254 | 97% | 3% | 1% |
| Debub region, ዞባ ደቡብ | 1,476,765 | 96% | 3% | <1% |
| Gash-Barka Region, ዞባ ጋሽ ባርካ | 1,103,742 | 9% | 90% | 1% |
| Anseba Region, ዞባ ዓንሰባ | 893,587 | 27% | 72% | <1% |
| Northern Red Sea Region, Semienawi Keyih Bahri ዞባ ሰሜናዊ ቀይሕ ባሕሪ |
897,454 | 1% | 99% | 0% |
| Southern Red Sea Region, Debubawi Keyih Bahri ዞባ ደቡባዊ ቀይሕ ባሕሪ |
398,073 | 23% | 76% | <1% |
Population
Eritrea has an estimated population of approximately 5,750,433 in 2019.[2][3][4][5][6] The population has doubled over the past 30 years, with an accelerating growth rate estimated at close to 3.2% p.a. during 2005–2010.[14] In the 2010s, worsening conditions have fuelled migration pressure, with Eritreans trying to reach Europe illegally.[15]
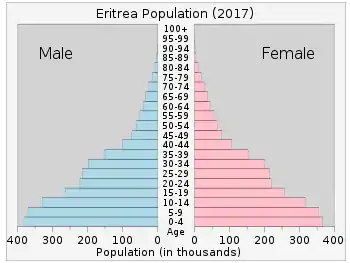
The proportion of children below the age of 15 in 2010 was 41.6%, 55.9% was between 15 and 65 years of age, while 2.5% was 65 years or older.[16]
| Total population | Population aged 0–14 (%) | Population aged 15–64 (%) | Population aged 65+ (%) | |
|---|---|---|---|---|
| 1950 | 1 141 000 | 45.3 | 51.5 | 3.2 |
| 1955 | 1 264 000 | 44.9 | 52.1 | 3.0 |
| 1960 | 1 424 000 | 44.8 | 52.5 | 2.8 |
| 1965 | 1 619 000 | 44.7 | 52.7 | 2.6 |
| 1970 | 1 847 000 | 45.3 | 52.2 | 2.5 |
| 1975 | 2 115 000 | 45.4 | 52.1 | 2.5 |
| 1980 | 2 469 000 | 47.1 | 49.1 | 3.8 |
| 1985 | 2 806 000 | 47.8 | 49.2 | 3.0 |
| 1990 | 3 158 000 | 46.3 | 51.1 | 2.6 |
| 1995 | 3 213 000 | 47.0 | 50.5 | 2.5 |
| 2000 | 3 668 000 | 44.9 | 52.7 | 2.4 |
| 2005 | 4 486 000 | 42.0 | 55.7 | 2.4 |
| 2010 | 5 254 000 | 41.6 | 55.9 | 2.5 |
UN medium variant population projections as of 2010 expected a radically reduced growth rate of 2.0% during the 2020s and of 1.8% during the 2030s.[16] This was corrected as too optimistic an outlook in the 2012 edition, which now expected a more pessimistic, but still declining growth rate of 2.7% during the 2020s (10.3 million in 2030) and of 2.4% during the 2030s (13 million in 2040).[17]
Vital statistics
Registration of vital events in Eritrea is incomplete. The Population Department of the United Nations prepared the following estimates:[16]
| Period | Live births per year | Deaths per year | Natural change per year | CBR* | CDR* | NC* | TFR* | IMR* |
|---|---|---|---|---|---|---|---|---|
| 1950-1955 | 58 000 | 34 000 | 24 000 | 48.4 | 28.0 | 20.4 | 6.97 | 176 |
| 1955-1960 | 66 000 | 35 000 | 31 000 | 49.2 | 25.7 | 23.4 | 6.97 | 163 |
| 1960-1965 | 74 000 | 36 000 | 38 000 | 48.5 | 23.6 | 24.9 | 6.82 | 151 |
| 1965-1970 | 83 000 | 38 000 | 45 000 | 47.6 | 21.7 | 25.9 | 6.70 | 139 |
| 1970-1975 | 91 000 | 39 000 | 52 000 | 46.1 | 19.7 | 26.3 | 6.52 | 133 |
| 1975-1980 | 103 000 | 43 000 | 60 000 | 45.1 | 18.9 | 26.2 | 6.50 | 127 |
| 1980-1985 | 112 000 | 54 000 | 58 000 | 42.4 | 20.5 | 21.9 | 6.50 | 116 |
| 1985-1990 | 123 000 | 52 000 | 71 000 | 41.1 | 17.3 | 23.9 | 6.31 | 104 |
| 1990-1995 | 127 000 | 45 000 | 83 000 | 40.0 | 14.1 | 25.9 | 6.08 | 90 |
| 1995-2000 | 131 000 | 38 000 | 93 000 | 38.1 | 11.1 | 27.0 | 5.66 | 73 |
| 2000-2005 | 157 000 | 39 000 | 118 000 | 38.4 | 9.5 | 28.9 | 5.19 | 62 |
| 2005-2010 | 183 000 | 40 000 | 143 000 | 37.5 | 8.3 | 29.3 | 4.68 | 54 |
| * CBR = crude birth rate (per 1000); CDR = crude death rate (per 1000); NC = natural change (per 1000); IMR = infant mortality rate per 1000 births; TFR = total fertility rate (number of children per woman) | ||||||||
Fertility and Births
Total Fertility Rate (TFR) (Wanted Fertility Rate) and Crude Birth Rate (CBR):[18]
| Year | Total CBR | Total TFR | Urban CBR | Urban TFR | Rural CBR | Rural TFR |
|---|---|---|---|---|---|---|
| 1995 | 37,5 | 6,10 (5,7) | 29,3 | 4,23 (3,8) | 40,3 | 6,99 (6,5) |
| 2002 | 32 | 4,8 (4,4) | 28 | 3,5 (3,1) | 35 | 5,7 (5,3) |
Fertility data as of 2002 (DHS Program):[19]
| Zoba | Total fertility rate | Percentage of women age 15-49 currently pregnant | Mean number of children ever born to women age 40-49 |
|---|---|---|---|
| Debubawi Keih Bahri | 3.9 | 8.9 | 5.1 |
| Maekel | 3.4 | 7.1 | 4.8 |
| Semenawi Keih Bahri | 4.5 | 8.9 | 5.8 |
| Anseba | 5.6 | 8.8 | 6.3 |
| Gash-Barka | 5.1 | 10.2 | 6.3 |
| Debub | 5.7 | 9.5 | 6.6 |
Life expectancy
| Period | Life expectancy in Years[20] |
|---|---|
| 1950–1955 | 34.08 |
| 1955–1960 | |
| 1960–1965 | |
| 1965–1970 | |
| 1970–1975 | |
| 1975–1980 | |
| 1980–1985 | |
| 1985–1990 | |
| 1990–1995 | |
| 1995–2000 | |
| 2000–2005 | |
| 2005–2010 | |
| 2010–2015 |
Demographic statistics
Demographic statistics according to the World Population Review in 2019.[21]
- One birth every 3 minutes
- One death every 16 minutes
- One net migrant every 55 minutes
- Net gain of one person every 4 minutes
The following demographic statistics are from the CIA World Factbook.[22]
Population
- 5,970,646 (July 2018 est.)
Age structure
- 0-14 years: 39.53% (male 1,186,749 /female 1,173,530)
- 15-24 years: 19.94% (male 592,365 /female 598,305)
- 25-54 years: 32.88% (male 965,405 /female 997,771)
- 55-64 years: 3.7% (male 96,967 /female 123,895)
- 65 years and over: 3.95% (male 97,816 /female 137,843) (2018 est.)
- 0–14 years: 42.9% (male 1,085,116/female 1,072,262)
- 15–64 years: 53.5% (male 1,332,349/female 1,355,494)
- 65 years and over: 3.6% (male 88,068/female 95,186) (2008 est.)
Total fertility rate
- 3.9 children born/woman (2018 est.) Country comparison to the world: 37th
- According to 2002 official survey, fertility rate was 4.8 with 3.5 in urban and 5.7 in rural.[23]
Birth rate
- 29.1 births/1,000 population (2018 est.) Country comparison to the world: 40th
Death rate
- 7.1 deaths/1,000 population (2018 est.) Country comparison to the world: 126th
Population growth rate
- 0.89% (2018 est.) Country comparison to the world: 123rd
- 2.445% (2011 est.)
Median age
- total: 19.9 years Country comparison to the world: 194th
- male: 19.4 years
- female: 20.4 years (2018 est.)
Mother's mean age at first birth
- 21.3 years (2010 est.)
- note: median age at first birth among women 25-29
Contraceptive prevalence rate
- 8.4% (2010)
Net migration rate
- -13.9 migrant(s)/1,000 population (2017 est.) Country comparison to the world: 215th
Dependency ratios
- total dependency ratio: 85 (2015 est.)
- youth dependency ratio: 78.3 (2015 est.)
- elderly dependency ratio: 6.8 (2015 est.)
- potential support ratio: 14.8 (2015 est.)
Urbanization
- urban population: 40.1% of total population (2018)
- rate of urbanization: 3.86% annual rate of change (2015-20 est.)
Sex ratio
at birth:
1.03 male(s)/female
under 15 years:
1.01 male(s)/female
15–64 years:
0.98 male(s)/female
65 years and over:
0.93 male(s)/female
total population:
0.99 male(s)/female (2008 est.)
Life expectancy at birth
- total population: 65.6 years (2018 est.)
- male: 63 years (2018 est.)
- female: 68.2 years (2018 est.)
Nationality
noun:
Eritrean(s)
adjective:
Eritrean
Ethnic groups
Tigrinya 55%, Tigre 30%, Saho 4%, Kunama 2%, Rashaida 2%, Bilen 2%, other (Afar, Beni-Amer, Nera) 5% (2010 est.)[24]
Religions
- Eritrean Orthodox Tewahdo, Muslim, Roman Catholic, Protestant
Languages
Literacy
definition: age 15 and over can read and write (2015 est.)
- total population: 73.8% (2015 est.)
- male: 82.4% (2015 est.)
- female: 65.5% (2015 est.)
School life expectancy (primary to tertiary education)
- total: 5 years (2015)
- male: 6 years (2015)
- female: 5 years (2015)
See also
References
- Trimingham, J. (2013). Islam in Ethiopia. Routledge. p. 23. ISBN 978-1136970221. Retrieved 19 September 2016.
- (2019)https://www.cia.gov/library/publications/the-world-factbook/geos/print_er.html
- "Eritrea population (2020) live — Countrymeters". countrymeters.info.
- https://www.statista.com/statistics/510498/total-population-of-eritrea/
- https://www.indexmundi.com/eritrea/demographics_profile.html
- https://www.who.int/countries/eri/en/
- "The World Factbook". Retrieved 31 May 2015.
- Minahan, James (1998). Miniature empires: a historical dictionary of the newly independent states. Greenwood Publishing Group. p. 76. ISBN 0-313-30610-9.
The majority of the Eritreans speak Semitic or Cushitic languages of the Afro-Asiatic language group. The Kunama, Baria, and other smaller groups in the north and northwest speak Nilotic languages.
- Alders, Anne. "the Rashaida". Retrieved 2006-06-07.
- Kifleyesus, Abbebe (January 2009). "Jeberti Women Traders' Innumeracy: Its Impact on Commercial Activity in Eritrea". L'Homme: Revue française d'anthropologie (189): 59. Retrieved 27 February 2015.
- Facts On File, Incorporated (2009). Encyclopedia of the Peoples of Africa and the Middle East. Infobase Publishing. p. 336. ISBN 978-1438126760.
- "Eritrea". U.S. State Department.
- "Table: Christian Population as Percentages of Total Population by Country". Pew Research Center's Religion & Public Life Project. 19 December 2011. Archived from the original on 7 January 2012. Retrieved 31 May 2015.
- Bilateral Estimates of Migrant Stocks in 2010 estimates 942,000 emigrants, of whom 450,000 migrated to Sudan and 290,000 to Ethiopia. C.f. the World' Bank's Migration and Remittances Factbook 2011.
- Why they leave -- Eritreans are taking to the seas because of worsening conditions at home 12 October 2013. "Some 30,000 people reached Italy illegally in boats in the first nine months of 2013, three times as many as in the whole of 2012, according to Frontex, [...] the largest batch came from Eritrea, a country that has supposedly been at peace for the past 13 years." Emigration has left Eritrea ‘desolate’, say bishops", Catholic Herald, 6 September 2014.
- "World Population Prospects, the 2012 Revision". Retrieved 31 May 2015.
- Based on an a-priori assumption of worldwide "convergence towards low fertility". "World Population Prospects: The 2012 Revision", "Methodology", p. 15: "The 2012 Revision drew on new empirical evidence on fertility levels and trends that became available since the publication of the 2010 Revision. The empirical evidence from available surveys and the 2010 round of censuses has provided the basis for a reassessment of fertility levels and trends experienced within the last decade. In a number of countries, particularly in Africa, slower than expected fertility declines or even stalled fertility was observed. In some cases, increases in total fertility were also recorded. This led to the decision not to apply the additional adjustment that was used in the 2010 Revision for a small number of countries at the very early stage of their fertility transition (for example, Mali, Niger, Nigeria, and Somalia) or that had experienced recent fertility stalling (for example, Congo, Gabon, Kenya, Malawi, Mozambique, Rwanda, Sao Tome and Principe, United Republic of Tanzania, Zambia, and Zimbabwe). For these countries, the recent fertility decline has been much slower than typically experienced in the past decades by other countries at similar levels of fertility, and the additional adjustment would have delayed any potential future decline, implying even more population growth than already anticipated with the standard assumption."
- "MEASURE DHS: Demographic and Health Surveys". Retrieved 31 May 2015.
- http://dhsprogram.com/pubs/pdf/FR137/FR137.pdf
- "World Population Prospects - Population Division - United Nations". esa.un.org. Retrieved 2018-08-26.
- "Eritrea Population 2019", World Population Review
- "The World FactBook - Eritrea", The World Factbook, July 12, 2018
 This article incorporates text from this source, which is in the public domain.
 - http://www.measuredhs.com/pubs/pdf/FR137/FR137.pdf
- "Africa :: ERITREA". CIA The World Factbook.
![]() This article incorporates public domain material from the CIA World Factbook document: "2008 edition".
This article incorporates public domain material from the CIA World Factbook document: "2008 edition".
External links
| Wikimedia Commons has media related to Demographics of Eritrea. |
- Languages in Eritrea
- Ethnic groups in Eritrea
- Eritrean website featuring resources relevant to Tigre history and culture
| Afro-Asiatic |
| ||||||
|---|---|---|---|---|---|---|---|
| Nilo-Saharan | |||||||
| Indo-European |
| ||||||
| History | .svg.png.webp) | ||||
|---|---|---|---|---|---|
| Geography | |||||
| Politics | |||||
| Economy |
| ||||
| Culture |
| ||||