Demographics of Ivory Coast
This article is about the demographic features of the population of Ivory Coast, including population density, ethnicity, education level, health of the populace, economic status, religious affiliations and other aspects of the population.
| Year | Pop. | ±% |
|---|---|---|
| 1950 | 2,630,000 | — |
| 1960 | 3,504,000 | +33.2% |
| 1970 | 5,102,000 | +45.6% |
| 1980 | 8,034,000 | +57.5% |
| 1990 | 11,925,000 | +48.4% |
| 2000 | 16,455,000 | +38.0% |
| 2010 | 20,533,000 | +24.8% |
| 2019 | 25,717,000 | +25.2% |
| source:[1][2] | ||
Population
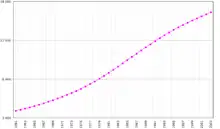
According to the 2019 revision of the World Population Prospects[1][2] the total population was 25,069,230 in 2018, compared to only 2 630 000 in 1950. The proportion of children below the age of 15 in 2010 was 40.9%, 55.3% was between 15 and 65 years of age, while 3.8% was 65 years or older .[3]
| Total population | Population aged 0–14 (%) | Population aged 15–64 (%) | Population aged 65+ (%) | |
|---|---|---|---|---|
| 1950 | 2 630 000 | 43.1 | 54.6 | 2.3 |
| 1955 | 3 072 000 | 43.0 | 54.6 | 2.4 |
| 1960 | 3 638 000 | 43.8 | 53.8 | 2.4 |
| 1965 | 4 424 000 | 44.6 | 52.9 | 2.4 |
| 1970 | 5 416 000 | 45.0 | 52.6 | 2.4 |
| 1975 | 6 768 000 | 45.4 | 52.2 | 2.4 |
| 1980 | 8 501 000 | 45.9 | 51.7 | 2.5 |
| 1985 | 10 495 000 | 45.9 | 51.5 | 2.5 |
| 1990 | 12 518 000 | 45.1 | 52.2 | 2.6 |
| 1995 | 14 677 000 | 43.2 | 54.0 | 2.8 |
| 2000 | 16 582 000 | 41.8 | 55.1 | 3.1 |
| 2005 | 18 021 000 | 41.8 | 54.8 | 3.5 |
| 2010 | 19 738 000 | 40.9 | 55.3 | 3.8 |
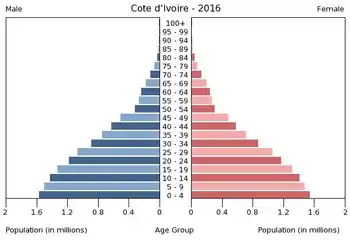
Structure of the population (DHS 2011-2012) (Males 23 630, Females 25 193 = 48 823) :
| Age Group | Male (%) | Female (%) | Total (%) |
|---|---|---|---|
| 0-4 | 16,0 | 16,0 | 16,0 |
| 5-9 | 15,3 | 14,8 | 15,1 |
| 10-14 | 13,2 | 13,0 | 13,1 |
| 15-19 | 8,9 | 9,1 | 9,0 |
| 20-24 | 8,4 | 8,7 | 8,5 |
| 25-29 | 7,5 | 8,6 | 8,0 |
| 30-34 | 6,9 | 7,0 | 7,0 |
| 35-39 | 5,3 | 5,1 | 5,2 |
| 40-44 | 4,6 | 3,8 | 4,2 |
| 45-49 | 3,3 | 2,9 | 3,1 |
| 50-54 | 2,9 | 3,7 | 3,3 |
| 55-59 | 2,0 | 2,3 | 2,2 |
| 60-64 | 2,3 | 1,8 | 2,1 |
| 65-69 | 1,3 | 1,2 | 1,3 |
| 70-74 | 1,0 | 1,0 | 1,0 |
| 75-79 | 0,5 | 0,4 | 0,5 |
| 80+ | 0,6 | 0,6 | 0,6 |
| Age group | Male (%) | Female (%) | Total (%) |
|---|---|---|---|
| 0-14 | 44,5 | 43,8 | 44,2 |
| 15-64 | 52,1 | 53,0 | 52,4 |
| 65+ | 3,4 | 3,2 | 3,4 |
Population Growth: 1.88% (2016 est.)[4]
Vital statistics
Registration of vital events is in Ivory Coast not complete. The Population Departement of the United Nations prepared the following estimates. [3]
| Period | Live births per year | Deaths per year | Natural change per year | CBR* | CDR* | NC* | TFR* | IMR* |
|---|---|---|---|---|---|---|---|---|
| 1950-1955 | 145 000 | 70 000 | 74 000 | 50.8 | 24.6 | 26.1 | 6.77 | 167 |
| 1955-1960 | 174 000 | 81 000 | 93 000 | 51.9 | 24.1 | 27.8 | 7.15 | 160 |
| 1960-1965 | 211 000 | 94 000 | 117 000 | 52.3 | 23.3 | 29.0 | 7.53 | 155 |
| 1965-1970 | 258 000 | 109 000 | 149 000 | 52.4 | 22.2 | 30.2 | 7.83 | 147 |
| 1970-1975 | 317 000 | 116 000 | 200 000 | 52.0 | 19.1 | 32.9 | 7.93 | 127 |
| 1975-1980 | 386 000 | 123 000 | 263 000 | 50.5 | 16.1 | 34.4 | 7.81 | 109 |
| 1980-1985 | 446 000 | 133 000 | 313 000 | 46.9 | 14.0 | 32.9 | 7.31 | 96 |
| 1985-1990 | 494 000 | 154 000 | 340 000 | 42.9 | 13.4 | 29.5 | 6.61 | 93 |
| 1990-1995 | 542 000 | 186 000 | 357 000 | 39.9 | 13.6 | 26.2 | 5.92 | 95 |
| 1995-2000 | 587 000 | 224 000 | 363 000 | 37.6 | 14.3 | 23.2 | 5.31 | 92 |
| 2000-2005 | 639 000 | 249 000 | 390 000 | 36.9 | 14.4 | 22.5 | 5.05 | 85 |
| 2005-2010 | 660 000 | 245 000 | 415 000 | 35.0 | 13.0 | 22.0 | 4.65 | 77 |
| * CBR = crude birth rate (per 1000); CDR = crude death rate (per 1000); NC = natural change (per 1000); IMR = infant mortality rate per 1000 births; TFR = total fertility rate (number of children per woman) | ||||||||
Fertility and Births
Total Fertility Rate (TFR) (Wanted Fertility Rate) and Crude Birth Rate (CBR):[5]
| Year | CBR (Total) | TFR (Total) | CBR (Urban) | TFR (Urban) | CBR (Rural) | TFR (Rural) |
|---|---|---|---|---|---|---|
| 1994 | 41,3 | 5,7 (4,7) | 38,8 | 4,7 (3,7) | 42,5 | 6,4 (5,4) |
| 1998-99 | 39,3 | 5,2 (4,5) | 36,5 | 4,0 (3,4) | 40,7 | 6,0 (5,2) |
| 2005 | 38,4 | 4,6 | 35,1 | 3,6 | 40,8 | 5,5 |
| 2011-12 | 36,8 | 5,0 (4,1) | 31,9 | 3,7 (3,2) | 40,3 | 6,3 (5,0) |
Fertility data as of 2011-2012 (DHS Program):[6]
| Region | Total fertility rate | Percentage of women age 15-49 currently pregnant | Mean number of children ever born to women age 40-49 |
|---|---|---|---|
| Centre | 6.1 | 10.6 | 6.9 |
| Centre-Est | 4.6 | 7.7 | 5.4 |
| Centre-Nord | 5.4 | 9.6 | 6.1 |
| Centre-Ouest | 5.4 | 11.0 | 5.7 |
| Nord | 6.1 | 9.7 | 6.9 |
| Nord-Est | 6.0 | 11.5 | 6.6 |
| Nord-Ouest | 6.8 | 12.4 | 7.1 |
| Ouest | 6.1 | 12.4 | 6.2 |
| Sud | 4.8 | 10.6 | 6.0 |
| Sud-Ouest | 5.0 | 15.5 | 5.9 |
| Ville d'Abidjan | 3.1 | 6.9 | 4.2 |
Life expectancy
| Period | Life expectancy in Years[7] |
|---|---|
| 1950–1955 | 32.14 |
| 1955–1960 | |
| 1960–1965 | |
| 1965–1970 | |
| 1970–1975 | |
| 1975–1980 | |
| 1980–1985 | |
| 1985–1990 | |
| 1990–1995 | |
| 1995–2000 | |
| 2000–2005 | |
| 2005–2010 | |
| 2010–2015 |
Ethnic groups
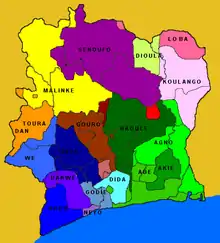
Ivory Coast has more than 60 ethnic groups, usually classified into five principal divisions: Akan (east and center, including Lagoon peoples of the southeast), Krou (southwest), Southern Mandé (west), Northern Mandé (northwest), Sénoufo/Lobi (north center and northeast). The Baoulés, in the Akan division, probably comprise the largest single subgroup with 15%-20% of the population. They are based in the central region around Bouaké and Yamoussoukro. The Bétés in the Krou division, the Sénoufos in the north, and the Malinkés in the northwest and the cities are the next largest groups, with 10%-15% of the national population. Most of the principal divisions have a significant presence in neighboring countries.
Of the more than 5 million non-Ivorian Africans living in Ivory Coast, one-third to one-half are from Burkina Faso; the rest are from Ghana, Guinea, Mali, Nigeria, Benin, Senegal, Liberia, and Mauritania. The non-African expatriate community includes roughly 50,000 French (this number may be inaccurate due to the evacuation of roughly 8,000 Frenchmen in November 2004) and possibly 40,000 Lebanese. The number of elementary school-aged children attending classes increased from 22% in 1960 to 67% in 1995.
Languages
French is the official language, while there are 60 living indigenous languages spoken in Ivory Coast. The Dioula dialect of Bambara is the most widely spoken one.[9] Other language groups include the Gur languages, the Senufo languages, the Kru languages (including the Bété languages, Dida, Nyabwa, Wè, and Western Krahn), and the Kwa languages (including Akan, Anyin, and Baoulé).
Religion
The economic development and relative prosperity of Ivory Coast fostered huge demographic shifts during the 20th century. "In 1922, an estimated 100,000 out of 1.6 million (or 6 percent) of people in Côte d'Ivoire were Muslims. By contrast, at independence (in 1960), their share of the population had increased rapidly, and Muslims were moving southward to the cocoa-producing areas and the southern cities. By 1998, [...], Muslims constituted a majority in the north of the country, and approximately 38.6 percent of the total population. This was a significantly larger population than the next largest religious group, Christians, who constituted approximately 29.1 percent of the total."[10] In earlier decades, this shift was mainly due to large-scale immigration from neighboring countries of the interior, that has been going on since colonial times and continued to be promoted during the Houphouet-Boigny era. Since the 1990s, the widening fertility gap between different religious groups has continued to tilt the demographic balance in favor of Muslims although immigration has become less important.[11]
Ivorian diaspora
The table below shows the number of people born in Ivory Coast who have migrated to OECD countries only (the table only includes communities consisting of at least 1,000 members).[12]
| Country | Ivorian-born population | See also |
|---|---|---|
| 63,441 | Ivorians in France | |
| 7,595 | Ivorian Americans | |
| 7,242 | ||
| 2,794 | Ivorians in the United Kingdom | |
| 1,865 | ||
| 1,363 | ||
| 1,100 |
Other demographic statistics
Demographic statistics according to the World Population Review in 2019.[13]
- One birth every 35 seconds
- One death every 2 minutes
- One net migrant every 90 minutes
- Net gain of one person every 50 seconds
The following demographic are from the CIA World Factbook[14] unless otherwise indicated.
Population
- 26,260,582 (July 2018 est.)
- 21,058,798 (2010 est.)
Age structure
- 0-14 years: 39.59% (male 5,213,630 /female 5,182,872)
- 15-24 years: 19.91% (male 2,613,772 /female 2,615,680)
- 25-54 years: 34.25% (male 4,577,394 /female 4,416,408)
- 55-64 years: 3.47% (male 460,048 /female 451,604)
- 65 years and over: 2.78% (male 325,510 /female 403,664) (2018 est.)
Median age
- total: 19.9 years. Country comparison to the world: 192nd
- male: 20 years
- female: 19.8 years (2018 est.)
Birth rate
- 30.1 births/1,000 population (2018 est.) Country comparison to the world: 36th
Death rate
- 8.4 deaths/1,000 population (2018 est.) Country comparison to the world: 80th
Total fertility rate
- 3.83 children born/woman (2018 est.) Country comparison to the world: 38th
Population growth rate
- 2.3% (2018 est.) Country comparison to the world: 33rd
Mother's mean age at first birth
- 19.8 years (2011/12 est.)
- note: median age at first birth among women 25-29
Contraceptive prevalence rate
- 15.5% (2016)
Sex ratio
| At birth | 1.03 male(s)/female |
| Under 15 years | 1.02 male(s)/female |
| 15–64 years | 1.04 male(s)/female |
| 65 years and over | 0.99 male(s)/female |
| Total population | 1.03 male(s)/female (2011 est.) |
Net migration rate
- 0 migrant(s)/1,000 population (2017 est.) Country comparison to the world: 79th
Life expectancy at birth
- total population: 60.1 years (2018 est.)
- male: 58 years (2018 est.)
- female: 62.4 years (2018 est.)
Dependency ratios
- total dependency ratio: 83.8 (2015 est.)
- youth dependency ratio: 78.5 (2015 est.)
- elderly dependency ratio: 5.3 (2015 est.)
- potential support ratio: 18.9 (2015 est.)
Urbanization
- urban population: 50.8% of total population (2018)
- rate of urbanization: 3.38% annual rate of change (2015-20 est.)
Religions
- Muslim 42.9%, Catholic 17.2%, Evangelical 11.8%, Methodist 1.7%, other Christian 3.2%, animist 3.6%, other religion 0.5%, none 19.1% (2014 est.)
- note: the majority of foreign migrant workers are Muslim (72.7%) and Christian (17.7%)
HIV/AIDS
- adult prevalence rate: 2.8% (2017 est.)
- people living with HIV/AIDS: 500,000 (2017 est.)
- deaths: 24,000 (2017 est.)
Major infectious diseases
| Degree of risk | very high |
| Food or Waterborne diseases | bacterial diarrhea, hepatitis A, and typhoid fever |
| Water contact | schistosomiasis |
| Animal contact disease | rabies |
Note: highly pathogenic H5N1 avian influenza has been identified in this country; it poses a negligible risk with extremely rare cases possible among US citizens who have close contact with birds (2009)
Nationality
Noun and adjective: Ivorian (Ivoirian)
Ethnic Groups
| other | 2.8% (includes 130,000 Lebanese and 14,000 French) (1998) |
Literacy
definition: age 15 and over can read and write (2015 est.)
- total population: 43.1% (2015 est.)
- male: 53.1% (2015 est.)
- female: 32.5% (2015 est.)
School life expectancy (primary to tertiary education)
- total: 10 years (2016)
- male: 11 years (2016)
- female: 9 years (2016)
Unemployment, youth ages 15-24
- total: 3.9% (2016 est.)
- male: 2.8% (2016 est.)
- female: 5.1% (2016 est.)
References
| Wikimedia Commons has media related to Demographics of Ivory Coast. |
![]() This article incorporates public domain material from the CIA World Factbook document: "2006 edition".
This article incorporates public domain material from the CIA World Factbook document: "2006 edition".
- ""World Population prospects – Population division"". population.un.org. United Nations Department of Economic and Social Affairs, Population Division. Retrieved 9 November 2019.
- ""Overall total population" – World Population Prospects: The 2019 Revision" (xslx). population.un.org (custom data acquired via website). United Nations Department of Economic and Social Affairs, Population Division. Retrieved 9 November 2019.
- "Population Division of the Department of Economic and Social Affairs of the United Nations Secretariat, World Population Prospects: The 2010 Revision". Esa.un.org. Retrieved 27 August 2017.
- CIA World Factbook
- "MEASURE DHS: Demographic and Health Surveys". microdata.worldbank.org.
- "Enquête Démographique et de Santé et à Indicateurs Multiples 2011-2012" (PDF). Dhsprogram.com. Retrieved 27 August 2017.
- "World Population Prospects - Population Division - United Nations". esa.un.org. Retrieved 26 August 2018.
- "Africa :: IVORY COAST". CIA The World Factbook.
- "Africa :: Cote d'Ivoire — the World Factbook - Central Intelligence Agency". Retrieved 24 August 2020.
- Nordås, Ragnhild (2012). "The Devil in the Demography?". In Goldstone, Jack A.; Kaufmann, Eric P.; Toft, Monica Duffy (eds.). Political Demography. How Population Changes Are Reshaping International Security and National Politics. New York: Oxford University Press. p. 256.
- Nordås, Ragnhild (2012). "The Devil in the Demography?". In Goldstone, Jack A.; Kaufmann, Eric P.; Toft, Monica Duffy (eds.). Political Demography. How Population Changes Are Reshaping International Security and National Politics. New York: Oxford University Press. p. 257 f.
- "Country-of-birth database". Organisation for Economic Co-operation and Development. Archived from the original on 17 June 2009. Retrieved 25 June 2010.
- "Ivory Coast Population 2019", World Population Review
- "The World FactBook - Cote d'Ivoire", The World Factbook, 12 July 2018
 This article incorporates text from this source, which is in the public domain.