Demographics of Niger
This article is about the demographic features of the population of Niger, including population density, ethnicity, education level, health of the populace, economic status, religious affiliations and other aspects of the population.
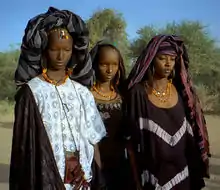 Fulani women with traditional facial tattoos. | |
| Languages | |
|---|---|
| French and Regional languages | |
| Religion | |
| Islam • Christianity • Traditional Beliefs |
The largest ethnic groups in Niger are the Hausa, who also constitute the major ethnic group in northern Nigeria, and the Zarma Songhay (also spelled Djerma-Songhai), who also are found in parts of Mali. Both groups are sedentary farmers who live in the arable, southern tier. The Kanouri (including Beri Beri, Manga) make up the majority of sedentary population in the far southeast of the nation. The remainder of the Nigerien people are nomadic or seminomadic livestock-raising peoples—Tuareg, Fulani,[1] Toubou and Diffa Arabs. With rapidly growing populations and the consequent competition for meager natural resources, lifestyles of these two types of peoples have come increasingly into conflict in Niger in recent years.
Niger's high infant mortality rate is comparable to levels recorded in neighboring countries. However, the child mortality rate (deaths among children between the ages of 1 and 4) is exceptionally high (274 per 1,000) due to generally poor health conditions and inadequate nutrition for most of the country's children. Niger's very high total fertility rate (6.89 children born per woman, which is the highest in the world[2]), nonetheless, means that nearly half (49%) of the Nigerien population is under age 15. School attendance is low (34%), including 38% of males and 27% of females. Additional education occurs through Koranic schools.
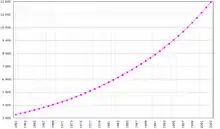
Population
| Year | Population
(persons) |
%+ |
|---|---|---|
| 1960 | 3,240,000 | — |
| 1970 | 4,210,000 | 29.9% |
| 1980 | 5,578,000 | 32.5% |
| 1990 | 7,754,610 | 39.0% |
| 2000 | 10,492,569 | 35.3% |
| 2010 | 15,203,822 | 44.9% |
Source: Institut National de la Statistique - Niger[3]
Census results
| Year | Pop. | ±% |
|---|---|---|
| 1977 | 5,102,990 | — |
| 1988 | 7,251,626 | +42.1% |
| 2001 | 11,060,291 | +52.5% |
| 2012 | 17,138,707 | +55.0% |
UN estimates
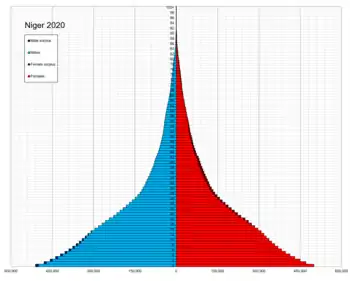
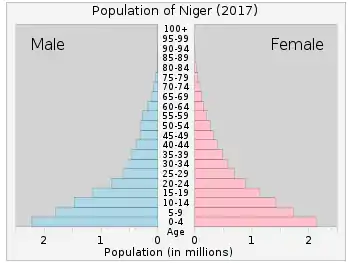
According to the 2019 revision of the World Population Prospects[4][5] the total population was 22,442,831 in 2018, compared to only 2 462 000 in 1950. The proportion of children and teenagers below the age of 15 in 2010 was 49%, 48.8% was between 15 and 65 years of age, while only 2.2% was 65 years or older.[6]
| Total population | Population aged 0–14 (%) | Population aged 15–64 (%) | Population aged 65+ (%) | |
|---|---|---|---|---|
| 1950 | 2 462 000 | 49.5 | 49.6 | 0.9 |
| 1955 | 2 834 000 | 48.1 | 51.1 | 0.8 |
| 1960 | 3 250 000 | 47.1 | 51.8 | 1.1 |
| 1965 | 3 766 000 | 46.9 | 51.7 | 1.3 |
| 1970 | 4 373 000 | 47.7 | 50.8 | 1.5 |
| 1975 | 5 071 000 | 48.1 | 50.3 | 1.6 |
| 1980 | 5 871 000 | 48.0 | 50.3 | 1.7 |
| 1985 | 6 744 000 | 48.2 | 49.9 | 1.9 |
| 1990 | 7 788 000 | 48.3 | 49.7 | 2.0 |
| 1995 | 9 179 000 | 48.3 | 49.6 | 2.1 |
| 2000 | 10 922 000 | 48.5 | 49.4 | 2.1 |
| 2005 | 12 994 000 | 48.9 | 49.0 | 2.1 |
| 2010 | 15 512 000 | 49.0 | 48.8 | 2.2 |
Life expectancy
| Period | Life expectancy in Years[7] |
|---|---|
| 1950–1955 | 34.50 |
| 1955–1960 | |
| 1960–1965 | |
| 1965–1970 | |
| 1970–1975 | |
| 1975–1980 | |
| 1980–1985 | |
| 1985–1990 | |
| 1990–1995 | |
| 1995–2000 | |
| 2000–2005 | |
| 2005–2010 | |
| 2010–2015 |
Vital statistics
Registration of vital events in Niger is incomplete. The Population Departement of the United Nations prepared the following estimates. [6]
| Period | Live births per year | Deaths per year | Natural change per year | CBR* | CDR* | NC* | TFR* | IMR* |
|---|---|---|---|---|---|---|---|---|
| 1950-1955 | 139 000 | 66 000 | 74 000 | 52.6 | 24.8 | 27.8 | 6.86 | 174 |
| 1955-1960 | 164 000 | 76 000 | 88 000 | 53.8 | 24.9 | 29.0 | 6.96 | 171 |
| 1960-1965 | 195 000 | 89 000 | 105 000 | 55.5 | 25.5 | 30.1 | 7.13 | 167 |
| 1965-1970 | 229 000 | 105 000 | 124 000 | 56.2 | 25.8 | 30.4 | 7.32 | 164 |
| 1970-1975 | 263 000 | 121 000 | 142 000 | 55.8 | 25.6 | 30.2 | 7.52 | 162 |
| 1975-1980 | 301 000 | 138 000 | 164 000 | 55.1 | 25.1 | 29.9 | 7.63 | 161 |
| 1980-1985 | 350 000 | 157 000 | 193 000 | 55.4 | 24.8 | 30.6 | 7.76 | 159 |
| 1985-1990 | 406 000 | 179 000 | 227 000 | 55.9 | 24.6 | 31.3 | 7.81 | 155 |
| 1990-1995 | 471 000 | 192 000 | 279 000 | 55.5 | 22.7 | 32.8 | 7.78 | 146 |
| 1995-2000 | 538 000 | 194 000 | 344 000 | 53.5 | 19.3 | 34.2 | 7.60 | 131 |
| 2000-2005 | 614 000 | 194 000 | 420 000 | 51.3 | 16.2 | 35.1 | 7.40 | 113 |
| 2005-2010 | 705 000 | 196 000 | 509 000 | 49.5 | 13.8 | 35.7 | 7.19 | 96 |
| * CBR = crude birth rate (per 1000); CDR = crude death rate (per 1000); NC = natural change (per 1000); IMR = infant mortality rate per 1000 births; TFR = total fertility rate (number of children per woman) | ||||||||
Fertility and births
Total fertility rate (TFR; Wanted Fertility Rate) and crude birth rate (CBR):[8]
| Year | CBR total | TFR total | CBR urban | TFR urban | CBR rural | TFR rural |
|---|---|---|---|---|---|---|
| 1988 | 7.51 | |||||
| 1992 | 7.37 (7,1) | 6.71 (6,3) | 7.52 (7,3) | |||
| 1998 | 52.8 | 7.5 (7,2) | 44.0 | 5.9 (5,6) | 55.0 | 7.9 (7,7) |
| 2006 | 46.1 | 7.1 (6,9) | 40.7 | 6.0 (5,6) | 47.1 | 7.4 (7,2) |
| 2012 | 46.6 | 7.6 (6,8) | 39.0 | 5.6 (4,7) | 48.1 | 8.1 (7,3) |
Fertility data as of 2012 (DHS Program):[9]
| Region | Total fertility rate | Percentage of women age 15-49 currently pregnant | Mean number of children ever born to women age 40-49 |
|---|---|---|---|
| Agadez | 5.7 | 9.2 | 7.1 |
| Diffa | 6.4 | 11.0 | 6.3 |
| Dosso | 7.5 | 11.7 | 7.7 |
| Maradi | 8.4 | 16.4 | 9.0 |
| Tahoua | 7.3 | 13.0 | 7.5 |
| Tillabéri | 7.9 | 15.6 | 7.8 |
| Zinder | 8.5 | 17.3 | 8.6 |
| Niamey | 5.3 | 9.6 | 5.9 |
Ethnic groups
| Ethnic group |
census 1988[10] | census 2001[10] | ||
|---|---|---|---|---|
| Number | % | Number | % | |
| Hausa | 3,770,927 | 53.0 | 6,069,731 | 55.4 |
| Djerma | 1,511,341 | 21.2 | 2,300,874 | 21.0 |
| Tuareg | 739,202 | 10.4 | 1,016,883 | 9.3 |
| Fulani | 694,428 | 9.8 | 935,517 | 8.5 |
| Kanuri | 316,471 | 4.4 | 513,116 | 4.7 |
| Toubou | 31,403 | 0.4 | 42,172 | 0.4 |
| Arab | 24,178 | 0.3 | 40,085 | 0.4 |
| Gurma | 19,714 | 0.3 | 39,797 | 0.4 |
| Other | 12,265 | 0.2 | 5,951 | 0.1 |
| Total | 7,119,929 | 10,964,126 | ||
Core health indicators
| World Health Organization 2007 statistics: Core Health Indicators for Niger[11] | ||
|---|---|---|
| Indicator | Value | (year) |
| Life expectancy at birth (years) males | 61.05 | (2015) |
| Life expectancy at birth (years) females | 62.9 | (2015) |
| Healthy life expectancy (HALE) at birth (years) males | 36.0 | (2002) |
| Healthy life expectancy (HALE) at birth (years) females | 35.0 | (2002) |
| Probability of dying (per 1 000 population) between 15 and 60 years (adult mortality rate) males | 502 | (2005) |
| Probability of dying (per 1 000 population) between 15 and 60 years (adult mortality rate) females | 478 | (2005) |
| Total expenditure on health as percentage of gross domestic product | 4.2 | (2004) |
| Per capita total expenditure on health at international dollar rate | 25.9 | (2004) |
| Population (in thousands) total | 13957 | (2005) |
Other demographic statistics
Demographic statistics according to the World Population Review in 2019.[12]
- One birth every 29 seconds
- One death every 3 minutes
- One net migrant every 90 minutes
- Net gain of one person every 36 seconds
The following demographic are from the CIA World Factbook[13] unless otherwise indicated.
Population
- 19,866,231 (July 2018 est.)
Age structure
- 0-14 years: 48.68% (male 4,878,031 /female 4,793,021)
- 15-24 years: 19.36% (male 1,899,879 /female 1,945,806)
- 25-54 years: 26.02% (male 2,581,597 /female 2,587,913)
- 55-64 years: 3.3% (male 340,032 /female 315,142)
- 65 years and over: 2.64% (male 268,072 /female 256,738) (2018 est.)
Birth rate
- 43.6 births/1,000 population (2018 est.) Country comparison to the world: 2nd
Death rate
- 11.5 deaths/1,000 population (2018 est.)
Total fertility rate
- 6.35 children born/woman (2018 est.) Country comparison to the world: 1st
Median age
- total: 15.5 years. Country comparison to the world: 228th
- male: 15.4 years
- female: 15.7 years (2018 est.)
Population growth rate
- 3.16% (2018 est.) Country comparison to the world: 7th
Mother's mean age at first birth
- 18.1 years (2012 est.)
- note: median age at first birth among women 25-29
Contraceptive prevalence rate
- 18.9% (2017)
Net migration rate
- -0.5 migrant(s)/1,000 population (2017 est.) Country comparison to the world: 125th
Dependency ratios
- total dependency ratio: 111.6 (2015 est.)
- youth dependency ratio: 106.2 (2015 est.)
- elderly dependency ratio: 5.4 (2015 est.)
- potential support ratio: 18.6 (2015 est.)
Urbanization
- urban population: 16.4% of total population (2018)
- rate of urbanization: 4.27% annual rate of change (2015-20 est.)
Sex ratio
at birth:
1.03 male(s)/female
younger than 15 years:
1.02 male(s)/female
15–64 years:
0.99 male(s)/female
65 years and over:
0.8 male(s)/female
total population:
1 male(s)/female (2010 est.)
Life expectancy at birth
- total population: 56.3 years (2018 est.)
- male: 55 years (2018 est.)
- female: 57.7 years (2018 est.)
- total population: 52.6 years
- male: 51.39 years
- female: 53.85 years (2010 est.)
Nationality
noun:
Nigerien(s)
adjective:
Nigerien
Ethnic Groups[14]
Religions
Muslim 99.3%, Christian 0.3%, animist 0.2%, none 0.1% (2012 est.)
Literacy
definition: age 15 and over can read and write (2015 est.)
- total population: 19.1% (2015 est.)
- male: 27.3% (2015 est.)
- female: 11% (2015 est.)
- Total population: 28.7% (2004 est.; source: UNDP 2006; NB- this figure is given without reference to which languages are considered)
- Male: 42.9%
- Female: 15.1%
School life expectancy (primary to tertiary education)
- total: 6 years (2017)
- male: 7 years (2017)
- female: 6 years (2017)
Unemployment, youth ages 15-24
- total: 80% (2011 est.)
- male: 55% (2019 est.)
- female: 25% (2019 est.)
See also
References
| Wikimedia Commons has media related to Demographics of Niger. |
- In Fula: Fulɓe; in French: Peul.
- https://www.cia.gov/library/publications/the-world-factbook/rankorder/2127rank.html
- "Annuaire Statistique - Démographie". Archived from the original on 2016-03-04. Retrieved 2012-01-22.
- ""World Population prospects – Population division"". population.un.org. United Nations Department of Economic and Social Affairs, Population Division. Retrieved November 9, 2019.
- ""Overall total population" – World Population Prospects: The 2019 Revision" (xslx). population.un.org (custom data acquired via website). United Nations Department of Economic and Social Affairs, Population Division. Retrieved November 9, 2019.
- Population Division of the Department of Economic and Social Affairs of the United Nations Secretariat, World Population Prospects: The 2010 Revision Archived May 6, 2011, at the Wayback Machine
- "World Population Prospects - Population Division - United Nations". esa.un.org. Retrieved 2018-08-26.
- http://microdata.worldbank.org/index.php/catalog/dhs#_r=&collection=&country=&dtype=&from=1890&page=11&ps=&sk=&sort_by=nation&sort_order=&to=2014&topic=&view=s&vk=
- http://dhsprogram.com/pubs/pdf/FR277/FR277.pdf
- UN Demographic Yearbooks
- World Health Organization 2007 statistics: Core Health Indicators for Niger.
- "Niger Population 2019", World Population Review
- "The World FactBook - Niger", The World Factbook, July 12, 2018
 This article incorporates text from this source, which is in the public domain.
 - "Africa :: NIGER". CIA The World Factbook.
- UNDP. 2006. Beyond scarcity: Power, poverty and the global water crisis. Human Development Report 2006. New York: United Nations Development Programme (UNDP).
- UNDP The Human Development Index reports: Niger.
- Health Organization Niger overview. Includes links to statistics, programs and news on health and demography in Niger.
- WHO "Country Logbook" for Niger. Providing Surveys, Censuses, Monitoring of vital events, Health services & surveillance, Health situation & trend analysis, and Planning & strategic documents .
- ethnologue.com: Ethnic and linguistic breakdown for Niger.
- OECD/ AEO 2007 Niger country study.
- The AGRHYMET Regional Centre (ARC), Niamey Office. Institute of the Permanent Interstate Committee for Drought Control in the Sahel (CILSS) composed of nine member States, including Niger.
- The World Bank, Niger overview and resources.