Demographics of Guinea
Demographics of Guinea describes the condition and overview of Guinea's peoples. Demographic topics include basic education, health, and population statistics as well as identified racial and religious affiliations.
Population

According to the 2019 revision of the World Population Prospects[1][2] the total population was 12,414,293 in 2018, compared to only 3 094 000 in 1950. The proportion of children below the age of 15 in 2010 was 42.9%, 53.8% was between 15 and 65 years of age, while 3.3% was 65 years or older .[3]
| Total population | Population aged 0–14 (%) | Population aged 15–64 (%) | Population aged 65+ (%) | |
|---|---|---|---|---|
| 1950 | 3 094 000 | 37.1 | 57.6 | 5.3 |
| 1955 | 3 300 000 | 38.6 | 57.0 | 4.4 |
| 1960 | 3 541 000 | 40.0 | 56.2 | 3.8 |
| 1965 | 3 823 000 | 41.8 | 54.9 | 3.4 |
| 1970 | 4 154 000 | 42.2 | 54.6 | 3.2 |
| 1975 | 4 287 000 | 42.6 | 54.3 | 3.1 |
| 1980 | 4 407 000 | 43.3 | 53.5 | 3.2 |
| 1985 | 4 924 000 | 43.9 | 52.8 | 3.3 |
| 1990 | 5 759 000 | 44.4 | 52.3 | 3.3 |
| 1995 | 7 565 000 | 44.6 | 52.1 | 3.3 |
| 2000 | 8 344 000 | 44.2 | 52.4 | 3.3 |
| 2005 | 9 041 000 | 43.6 | 53.0 | 3.3 |
| 2010 | 9 982 000 | 42.9 | 53.8 | 3.3 |
Vital statistics
Registration of vital events is in Guinea not complete. The Population Departement of the United Nations prepared the following estimates. [3]
| Period | Live births per year | Deaths per year | Natural change per year | CBR* | CDR* | NC* | TFR* | IMR* |
|---|---|---|---|---|---|---|---|---|
| 1950-1955 | 151 000 | 110 000 | 41 000 | 47.2 | 34.3 | 12.9 | 6.00 | 218 |
| 1955-1960 | 165 000 | 115 000 | 50 000 | 48.1 | 33.5 | 14.6 | 6.24 | 214 |
| 1960-1965 | 179 000 | 119 000 | 59 000 | 48.5 | 32.4 | 16.1 | 6.51 | 210 |
| 1965-1970 | 196 000 | 126 000 | 70 000 | 49.0 | 31.5 | 17.5 | 6.80 | 206 |
| 1970-1975 | 204 000 | 123 000 | 82 000 | 48.5 | 29.1 | 19.3 | 6.85 | 191 |
| 1975-1980 | 210 000 | 115 000 | 95 000 | 48.2 | 26.5 | 21.8 | 6.91 | 174 |
| 1980-1985 | 224 000 | 113 000 | 111 000 | 48.0 | 24.2 | 23.8 | 6.95 | 159 |
| 1985-1990 | 252 000 | 117 000 | 135 000 | 47.2 | 22.0 | 25.2 | 6.86 | 145 |
| 1990-1995 | 303 000 | 132 000 | 171 000 | 45.5 | 19.8 | 25.7 | 6.58 | 131 |
| 1995-2000 | 345 000 | 144 000 | 201 000 | 43.4 | 18.1 | 25.3 | 6.19 | 119 |
| 2000-2005 | 361 000 | 136 000 | 224 000 | 41.5 | 15.7 | 25.8 | 5.80 | 104 |
| 2005-2010 | 380 000 | 132 000 | 248 000 | 39.9 | 13.9 | 26.1 | 5.45 | 93 |
| * CBR = crude birth rate (per 1000); CDR = crude death rate (per 1000); NC = natural change (per 1000); IMR = infant mortality rate per 1000 births; TFR = total fertility rate (number of children per woman) | ||||||||
Fertility and Births
Total Fertility Rate (TFR) (Wanted Fertility Rate) and Crude Birth Rate (CBR):[4]
| Year | CBR (Total) | TFR (Total) | CBR (Urban) | TFR (Urban) | CBR (Rural) | TFR (Rural) |
|---|---|---|---|---|---|---|
| 1992 | 41 | 5.67 (5.1) | 37 | 5.18 (4.5) | 42 | 5.89 (5.3) |
| 1999 | 36.9 | 5.5 (5.0) | 32.9 | 4.4 (3.8) | 38.4 | 6.1 (5.6) |
| 2005 | 38.4 | 5.7 (5.1) | 31.8 | 4.4 (3.9) | 40.8 | 6.3 (5.7) |
| 2012 | 34 | 5.1 (4.6) | 29.4 | 3.8 | 36.1 | 5.8 |
| 2018 | 33.6 | 4.8 (4.3) | 29.4 | 3.8 (3.4) | 35.8 | 5.5 (4.9) |
Fertility data as of 2012 and 2018 (DHS Program):[5]
| Administrative region | Total fertility rate (2012) | Total fertility rate (2018) | Percentage of women age 15-49 currently pregnant (2012) | Percentage of women age 15-49 currently pregnant (2018) | Mean number of children ever born to women age 40-49 (2012) | Mean number of children ever born to women age 40-49 (2018) |
|---|---|---|---|---|---|---|
| Boké | 4.7 | 4.8 | 14.4 | 9.7 | 5.6 | 5.2 |
| Conakry | 3.6 | 3.2 | 6.2 | 5.8 | 4.8 | 4.1 |
| Faranah | 5.8 | 5.8 | 11.6 | 10.5 | 6.7 | 5.8 |
| Kankan | 6.9 | 6.5 | 14.4 | 13.6 | 6.9 | 6.9 |
| Kindia | 5.2 | 5.0 | 12.4 | 10.2 | 6.2 | 5.5 |
| Labé | 5.3 | 5.6 | 8.9 | 7.6 | 6.5 | 5.0 |
| Mamou | 5.4 | 4.1 | 8.4 | 7.9 | 6.1 | 4.8 |
| N'Zérékoré | 5.1 | 4.5 | 11.0 | 6.3 | 5.6 | 4.2 |
Life expectancy
| Period | Life expectancy in Years[6] |
|---|---|
| 1950–1955 | 33.07 |
| 1955–1960 | |
| 1960–1965 | |
| 1965–1970 | |
| 1970–1975 | |
| 1975–1980 | |
| 1980–1985 | |
| 1985–1990 | |
| 1990–1995 | |
| 1995–2000 | |
| 2000–2005 | |
| 2005–2010 | |
| 2010–2015 |
Ethnic groups
- Fulɓe (singular Pullo). Called Peuhl or Peul in French, Fula or Fulani in English, who are chiefly found in the mountainous region of Fouta Djallon;
- Maninka. Malinke in French, Mandingo in English, mostly inhabiting the savanna of Upper Guinea and the Forest region;
- Susus or Soussous. Susu is not a lingua franca in Guinea. Although it is commonly spoken in the coastal areas, including the capital, Conakry, it is not largely understood in the interior of the country.
- Several small groups (Gerzé or Kpelle, Toma, Kissis, etc.) in the forest region and Bagas (including Landoumas), Koniaguis etc.), In the coastal area.
West Africans make up the largest non-Guinean population. Non-Africans total about 30,000 (mostly French, other Europeans, and Lebanese). Seven national languages are used extensively; the major written languages are French, Pular (English: Fula; French: Peul or Peuhl), and Arabic.
Other languages have established Latin orthographies that are used somewhat, notably for Susu and Maninka. The N'Ko script is increasingly used on a grassroots level for the Maninka language.
Other demographic statistics
Demographic statistics according to the World Population Review in 2019.[7]
- One birth every 1 minutes
- One death every 5 minutes
- One net migrant every 60 minutes
- Net gain of one person every 2 minutes
The following demographic statistics are from the CIA World Factbook.[8]
Population
- 11,855,411 (July 2018 est.)
Age structure
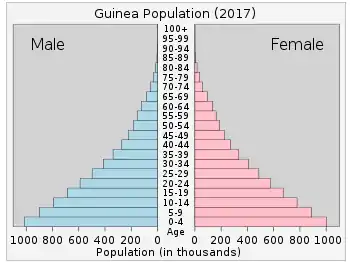
- 0-14 years: 41.4% (male 2,473,486 /female 2,435,139)
- 15-24 years: 19.23% (male 1,145,488 /female 1,134,103)
- 25-54 years: 30.8% (male 1,827,246 /female 1,824,162)
- 55-64 years: 4.72% (male 269,995 /female 289,164)
- 65 years and over: 3.85% (male 203,754 /female 252,874) (2018 est.)
Median age
- total: 19 years. Country comparison to the world: 204th
- male: 18.8 years
- female: 19.3 years (2018 est.)
- Total: 18.9 years
- Male: 18.7 years
- Female: 19.1 years (2017 est.)
Population growth rate
- 2.75% (2018 est.) Country comparison to the world: 13th
- 2.61% (2017 est.)
Birth rate
- 36.4 births/1,000 population (2018 est.) Country comparison to the world: 16th
Death rate
- 8.9 deaths/1,000 population (2018 est.) Country comparison to the world: 64th
Total fertility rate
- 4.98 children born/woman (2018 est.) Country comparison to the world: 14th
Mother's mean age at first birth
- 18.9 years (2012 est.)
- note: median age at first birth among women 25-29
Contraceptive prevalence rate
- 8.7% (2016)
Net migration rate
- 0 migrant(s)/1,000 population (2017 est.) Country comparison to the world: 84th
Dependency ratios
- total dependency ratio: 84.2 (2015 est.)
- youth dependency ratio: 78.6 (2015 est.)
- elderly dependency ratio: 5.6 (2015 est.)
- potential support ratio: 17.8 (2015 est.)
Life expectancy at birth
- total population: 62.1 years (2018 est.)
- male: 60.4 years (2018 est.)
- female: 64 years (2018 est.)
- total population: 61 years
- male: 59.5 years
- female: 62.6 years (2017 est.)
Urbanization
- urban population: 36.1% of total population (2018)
- rate of urbanization: 3.54% annual rate of change (2015-20 est.)
Sex ratio
at birth
1.03 male(s)/female
under 15 years
1.02 male(s)/female
15-64 years
1 male(s)/female
65 years and over
0.78 male(s)/female
total population
1 male(s)/female (2011 est.)
HIV/AIDS
Adult prevalence rate: 1.5% (2017 est.) People living with HIV/AIDS: 120,000 (2017 est.) Deaths: 5,100 (2017 est.)
Nationality
noun
Guinean(s)
adjective
Guinean
Ethnic groups
Languages [10]
French (official), each ethnic group has its own language
Literacy
definition: age 15 and over can read and write (2015 est.)
- total population: 30.4% (2015 est.)
- male: 38.1% (2015 est.)
- female: 22.8% (2015 est.)
School life expectancy (primary to tertiary education)
- total: 9 years (2014)
- male: 10 years (2014)
- female: 8 years (2014)
Unemployment, youth ages 15-24
- total: 1% (2012 est.)
- male: 1.5% (2012 est.)
- female: 0.6% (2012 est.)
References
- ""World Population prospects – Population division"". population.un.org. United Nations Department of Economic and Social Affairs, Population Division. Retrieved November 9, 2019.
- ""Overall total population" – World Population Prospects: The 2019 Revision" (xslx). population.un.org (custom data acquired via website). United Nations Department of Economic and Social Affairs, Population Division. Retrieved November 9, 2019.
- "Population Division of the Department of Economic and Social Affairs of the United Nations Secretariat, World Population Prospects: The 2010 Revision".
- "MEASURE DHS: Demographic and Health Surveys". microdata.worldbank.org.
- "Enquête Démographique et de Santé et à Indicateurs Multiples (EDS-MICS) 2012" (PDF). Enquête Démographique et de Santé et à Indicateurs Multiples.
- "World Population Prospects - Population Division - United Nations". esa.un.org. Retrieved 2018-08-26.
- "Guinea Population 2019", World Population Review
- "The World FactBook - Gambia, The", The World Factbook, July 12, 2018
 This article incorporates text from this source, which is in the public domain.
 - "The World Factbook – Central Intelligence Agency". Cia.gov. Retrieved 26 December 2020.
- "Africa :::GUINEA". CIA The World Factbook.
| Wikimedia Commons has media related to Demographics of Guinea. |
![]() This article incorporates public domain material from the CIA World Factbook document: "2007 edition".
This article incorporates public domain material from the CIA World Factbook document: "2007 edition".