Demographics of Botswana
This article is about the demographic features of the population of Botswana, including population density, ethnicity, education level, health of the populace, economic status, religious affiliations and other aspects of the population.

Botswana, like many nations in southern Africa, suffers from a high HIV infection rate, estimated among adults ages 15 to 49 to be 20.7%.[1]
Population
Census results
| Year | Pop. | ±% p.a. |
|---|---|---|
| 1904 | 120,776 | — |
| 1911 | 124,350 | +0.42% |
| 1921 | 152,983 | +2.09% |
| 1936 | 265,756 | +3.75% |
| 1946 | 296,310 | +1.09% |
| 1956 | 309,175 | +0.43% |
| 1964 | 549,510 | +7.45% |
| 1971 | 596,994 | +1.19% |
| 1981 | 941,027 | +4.66% |
| 1991 | 1,326,796 | +3.50% |
| 2001 | 1,680,863 | +2.39% |
| 2011 | 2,024,787 | +1.88% |
| [2][3][4] | ||
Bechuanaland Protectorate
The seven censuses of Botswana before its independence happened irregularly. Due to the Anglo-Boer War, the first census of Bechuanaland Protectorate, originally set to occur in 1901, took place on 17 April 1904.[2] The 1931 census was postponed to 1936 because of the Great Depression.[2] The early censuses were unreliable and took several years to tabulate; the results were outdated by the time they were calculated.
Post-independence
There have been five censuses after the independence of Botswana, each occurring every ten years in the year ending in 1 (i.e. 1971, 1981, 1991, 2001, and 2011). The 1971 census was the first census in Botswana to use de facto enumeration; this method counts people based on how many people spent census night at a specific location. Previously, the citizens were counted based on their usual place of residence. The 2001 census was the first census in Botswana to comply with the SADC 2000 Census Project, the guidelines of which unify the demographic statistics in southern Africa. The most recent census was the 2011 Botswana Population and Housing Census, which occurred in August 2011.
UN estimates
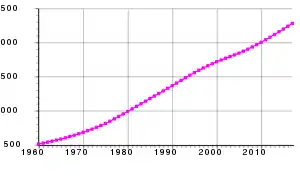
According to the 2019 revision of the World Population Prospects[5][6] the total population was 2,254,068 in 2018, compared to only 413,000 in 1950. The proportion of children below the age of 15 in 2020 was about 33.4%, 62.1% were between 15 and 65 years of age, while 4.5% of the population were 65 years or older.[7]
| Total population | Population aged 0–14 (%) | Population aged 15–64 (%) | Population aged 65+ (%) | |
|---|---|---|---|---|
| 1950 | 413 000 | 40.9 | 54.8 | 4.4 |
| 1955 | 463 000 | 41.7 | 53.9 | 4.3 |
| 1960 | 503 000 | 43.6 | 52.1 | 4.3 |
| 1965 | 560 000 | 46.8 | 49.3 | 4.0 |
| 1970 | 628 000 | 47.8 | 48.3 | 3.9 |
| 1975 | 741 000 | 48.0 | 48.5 | 3.5 |
| 1980 | 898 000 | 48.5 | 48.1 | 3.4 |
| 1985 | 1 070 000 | 47.9 | 49.0 | 3.1 |
| 1990 | 1 287 000 | 45.0 | 51.7 | 3.3 |
| 1995 | 1 469 000 | 42.2 | 54.6 | 3.3 |
| 2000 | 1 643 000 | 38.7 | 58.1 | 3.3 |
| 2005 | 1 799 000 | 36.5 | 60.3 | 3.1 |
| 2010 | 1 987 000 | 35.0 | 61.7 | 3.3 |
| 2015 | 2 121 000 | 34.9 | 61.2 | 3.8 |
| 2020 | 2 352 000 | 33.4 | 62.1 | 4.5 |
Vital statistics
Registration of vital events is in Botswana not complete. The Population Departement of the United Nations prepared the following estimates. [7]
| Period | Live births per year | Deaths per year | Natural change per year | CBR* | CDR* | NC* | TFR* | IMR* |
|---|---|---|---|---|---|---|---|---|
| 1950–1955 | 20 800 | 9 000 | 11 800 | 47.4 | 20.7 | 26.7 | 6.50 | 128 |
| 1955–1960 | 23 000 | 9 000 | 14 000 | 47.7 | 18.7 | 29.0 | 6.58 | 112 |
| 1960–1965 | 24 800 | 8 800 | 16 000 | 46.6 | 16.6 | 30.0 | 6.65 | 99 |
| 1965–1970 | 27 200 | 8 800 | 18 400 | 45.7 | 14.7 | 31.0 | 6.70 | 85 |
| 1970–1975 | 30 600 | 8 600 | 22 000 | 44.7 | 12.7 | 32.0 | 6.55 | 71 |
| 1975–1980 | 36 400 | 8 800 | 27 600 | 44.5 | 10.6 | 33.9 | 6.35 | 56 |
| 1980–1985 | 42 200 | 9 000 | 33 200 | 42.9 | 9.1 | 33.9 | 5.95 | 44 |
| 1985–1990 | 43 800 | 9 600 | 34 200 | 37.1 | 8.2 | 28.9 | 4.90 | 36 |
| 1990–1995 | 45 600 | 14 000 | 31 600 | 33.1 | 10.2 | 23.0 | 4.13 | 42 |
| 1995–2000 | 46 400 | 19 000 | 27 400 | 29.8 | 12.2 | 17.7 | 3.49 | 56 |
| 2000–2005 | 50 200 | 24 400 | 25 800 | 29.1 | 14.2 | 15.0 | 3.19 | 57 |
| 2005–2010 | 53 400 | 21 200 | 32 200 | 28.2 | 11.2 | 17.0 | 3.03 | 44 |
| 2010–2015 | 56 400 | 15 000 | 41 400 | 27.5 | 7.3 | 20.1 | 3.01 | 35 |
| 2015–2020 | 56 200 | 13 000 | 43 200 | 25.1 | 5.8 | 19.3 | 2.89 | 30 |
| * CBR = crude birth rate (per 1000); CDR = crude death rate (per 1000); NC = natural change (per 1000; CBR-CDR); TFR = total fertility rate (number of children per woman); IMR = infant mortality rate per 1000 births (deaths under 1 year of age) | ||||||||
| Year | Population | Live births | Deaths | Natural increase | Crude birth rate | Crude death rate | Rate of natural increase | TFR |
|---|---|---|---|---|---|---|---|---|
| 1964 | 514 876 | |||||||
| 1971 | 574 094 | 45.3 | 13.7 | 31.6 | 6.5 | |||
| 1981 | 941 027 | 45 026 | 12 835 | 32 191 | 48.7 | 13.9 | 34.8 | 6.6 |
| 1991 | 1 326 796 | 52 351 | 15 221 | 37 130 | 39.3 | 11.5 | 27.8 | 4.2 |
| 1992 | 1 358 639 | 52 416 | 15 344 | 37 072 | 38.6 | 11.3 | 27.3 | 4.2 |
| 1993 | 1 391 245 | 52 437 | 15 578 | 36 859 | 37.7 | 11.2 | 26.5 | 4.1 |
| 1994 | 1 424 636 | 52 598 | 15 822 | 36 776 | 36.9 | 11.1 | 25.8 | 4.1 |
| 1995 | 1 458 828 | 52 759 | 15 926 | 36 833 | 33.7 | 11.0 | 22.7 | 4.1 |
| 1996 | 1 495 993 | 52 921 | 16 031 | 36 890 | 32.4 | 10.9 | 21.5 | 4.0 |
| 1997 | 1 533 393 | 53 083 | 16 137 | 36 946 | 32.3 | 10.8 | 21.5 | 4.0 |
| 1998 | 1 571 728 | 53 245 | 16 244 | 37 001 | 32.2 | 10.7 | 21.5 | 4.0 |
| 1999 | 1 611 021 | 53 407 | 16 352 | 37 055 | 32.1 | 10.6 | 21.5 | 3.9 |
| 2001 | 1 680 862 | 32 690 | 20 823 | 11 867 | 28.9 | 12.4 | 16.5 | 3.3 |
| 2002 | 1 667 487 | |||||||
| 2003 | 1 691 390 | |||||||
| 2004 | 1 711 334 | |||||||
| 2005 | 1 727 372 | |||||||
| 2006 | 1 739 556 | 19 088 | 29.8 | 11.2 | 18.6 | 3.2 | ||
| 2007 | 1 756 651 | |||||||
| 2008 | 1 776 283 | |||||||
| 2009 | 1 798 372 | |||||||
| 2010 | 1 822 858 | |||||||
| 2011 | 2 024 904 | 39 368 | 13 301 | 26 067 | 25.7 | 6.3 | 19.4 | 2.89 |
| 2012 | 2 068 529 | 40 856 | 12 270 | 28 586 | 19.7 | 5.9 | 13.8 | |
| 2013 | 2 110 050 | 44 794 | 11 967 | 32 827 | 21.2 | 5.6 | 15.6 | |
| 2014 | 2 149 255 | 41 741 | 12 177 | 29 564 | 19.4 | 5.6 | 13.8 | |
| 2015 | 2 185 903 | 46 765 | 13 030 | 33 735 | 21.4 | 6.0 | 15.4 | |
| 2016 | 2 219 732 | 49 984 | 12 825 | 37 159 | 22.5 | 5.8 | 16.7 | |
| 2017 | 2 254 021 | 43 290 | 12 386 | 30 904 | 19.2 | 5.5 | 13.7 | 3.1 |
| 2018 | 2 288 651 | 54 023 | 12 609 | 41 414 | 23.6 | 5.5 | 18.1 | |
| 2019 | 2 323 493 | |||||||
| 2020 | 2 374 697 | |||||||
Source: Vital Statistics Report 2012.
Life expectancy at birth
Life expectancy from 1950 to 2020 (UN World Population Prospects):[10]
| Period | Life expectancy in
Years |
|---|---|
| 1950–1955 | 44.89 |
| 1955–1960 | |
| 1960–1965 | |
| 1965–1970 | |
| 1970–1975 | |
| 1975–1980 | |
| 1980–1985 | |
| 1985–1990 | |
| 1990–1995 | |
| 1995–2000 | |
| 2000–2005 | |
| 2005–2010 | |
| 2010–2015 | |
| 2015–2020 |
Ethnic groups
Languages
Religions
- Christian 79.1%, Badimo 4.1%, Other 1.4% (includes the Baháʼí Faith, Hindu, Islam, Rastafarian), None 15.2%, Unspecified 0.3% (2011 est.)[11]
Other demographic statistics
Demographic statistics according to the World Population Review in 2019.[12]
- One birth every 10 minutes
- One death every 36 minutes
- One net migrant every 180 minutes
- Net gain of one person every 13 minutes
The following demographic statistics are from the CIA World Factbook.
Population
- 2,350,667 (July 2021 est.)
- 2,214,858 (July 2017 est.)
Age structure

- 0-14 years: 30.54% (male 357,065/female 350,550)
- 15-24 years: 18.31% (male 208,824/female 215,462)
- 25-54 years: 39.67% (male 434,258/female 484,922)
- 55-64 years: 5.92% (male 59,399/female 77,886)
- 65 years and over: 5.56% (male 53,708/female 75,159) (2020 est.)
Total fertility rate
- 2.42 children born/woman (2021 est.) Country comparison to the world: 74th
Population growth rate
- 1.43% (2021 est.) Country comparison to the world: 67th
- 1.55% (2017 est.)
Birth rate
- 20.6 births/1,000 population (2021 est.) Country comparison to the world: 71st
- 22.1 births/1,000 population (2017 est.)
Death rate
- 9.12 deaths/1,000 population (2021 est.) Country comparison to the world: 61st
- 9.6 deaths/1,000 population (2017 est.)
Median age
- Total: 25.7 years. Country comparison to the world: 157th
- Male: 24.5 years
- Female: 26.7 years (2020 est.)
- Total: 24.5 years
- Male: 23.5 years
- Female: 25.6 years (2017 est.)
Net migration rate
- 2.85 migrants/1,000 population (2021 est.) Country comparison to the world: 38th
- note: there is an increasing flow of Zimbabweans into Botswana and South Africa in search of better economic opportunities. Refer to below section on Migration.
Urbanization
- Urban population: 70.9% of total population (2020)
- Rate of urbanization: 2.87% annual rate of change (2015–20 est.)
Sex ratio
- At birth: 1.03 male(s)/female
- 0-14 years: 1.02 male(s)/female
- 15-24 years: 0.97 male(s)/female
- 25-54 years: 0.9 male(s)/female
- 55-64 years: 0.76 male(s)/female
- 65 years and over: 0.71 male(s)/female
- Total population: 0.93 male(s)/female (2020 est.)
Life expectancy at birth
- Total population: 65.2 years
- Male: 63.2 years
- Female: 67.3 years (2021 est.)
Maternal mortality rate
- 144 deaths/100,000 live births (2017 est.) Country comparison to the world: 59th
HIV/AIDS
- Adult prevalence rate: 22.2% (2019 est.)
- People living with HIV/AIDS: 380,000 (2019 est.)
- Deaths due to AIDS: 5,000 (2019 est.) Country comparison to the world: 25th
Physicians density
- 0.53 physicians/1,000 population (2016)
Hospital bed density
- 1.8 beds/1,000 population (2010)
Obesity - adult prevalence rate
- 18.9% (2016)
Major infectious diseases
- Degree of risk: high (2020)
- Food or waterborne diseases: bacterial diarrhea, hepatitis A, and typhoid fever
- Vectorborne disease: malaria
Nationality
- Noun: Motswana (singular), Batswana (plural)
- Adjective: Motswana (singular), Batswana (plural)
Literacy
- Definition: age 15 and over can read and write
- Total population: 88.5%
- Male: 88%
- Female: 88.9% (2015 est.)
Education expenditure
- 8.7% of total GDP (2007)
Sanitation facility access
- Improved:
- Urban: 92.9% of population
- Rural: 60.8% of population
- Total: 82.8% of population
- Unimproved:
- Urban: 7.1% of population
- Rural: 39.2% of population
- Total: 17.2% of population (2017 est.)
Migrants
According to the United Nations, there were 110,596 international migrants in Botswana in 2019. Their most common countries of origin were as follows:
| International migrants in Botswana in 2019 | |
|---|---|
References
| Wikimedia Commons has media related to Demographics of Botswana. |
- "HIV & Aids in Botswana". AVERT International HIV & Aids Charity. Retrieved 27 January 2021.
- "History". Central Statistics Office. Archived from the original on 13 November 2012. Retrieved 20 July 2012.
- "TABLE 1: 1971, 1981, 1991 and 2001 CENSUS DEMOGRAPHIC INDICATORS; BOTSWANA" (PDF). Gaborone: Central Statistics Office. p. 1. Archived from the original (PDF) on 20 July 2012. Retrieved 20 July 2012.
- "The Population of Towns, Villages and Associated Localities" (PDF). 2011 Population and Housing Census. Gaborone: Statistics Botswana. June 2012. p. 1. Archived from the original (PDF) on 4 September 2015. Retrieved 20 July 2012.
- ""World Population prospects – Population division"". population.un.org. United Nations Department of Economic and Social Affairs, Population Division. Retrieved November 9, 2019.
- ""Overall total population" – World Population Prospects: The 2019 Revision" (xslx). population.un.org (custom data acquired via website). United Nations Department of Economic and Social Affairs, Population Division. Retrieved November 9, 2019.
- "Population Division of the Department of Economic and Social Affairs of the United Nations Secretariat, World Population Prospects: Data Query Tool". un.org. Retrieved 27 January 2021.
- "Demographic and Social Statistics". unstats.un.org. Retrieved 2020-01-27.
- "Demographic Statistics Statsbots". statsbots.org.bw. Retrieved 2020-01-27.
- "World Population Prospects – Population Division – United Nations". Retrieved 2021-01-27.
- "Africa :: BOTSWANA". CIA The World Factbook.
- "Botswana Population 2019", World Population Review
![]() This article incorporates public domain material from the CIA World Factbook document: "2009 edition".
This article incorporates public domain material from the CIA World Factbook document: "2009 edition".
- Botswana Demographics 2001 Central Statistics Office (Botswana), Census and Demographic Statistics for the year 2001.