Demographics of Kenya
The demography of Kenya is monitored by the Kenyan National Bureau of Statistics. Kenya is a multi-ethnic state in the Great Lakes region of East Africa. It is inhabited primarily by Bantu and Nilotic populations, with some Cushitic-speaking ethnic minorities in the north. Its total population was at 47,564,296 as of the 2019 census.[1]
| Part of a series on the |
| Culture of Kenya |
|---|
 |
| Cuisine |
|
A national census was conducted in 1999, although the results were never released. A new census was undertaken in 2009, but turned out to be controversial, as the questions about ethnic affiliation seemed inappropriate after the ethnic violence of the previous year.[2] Preliminary results of the census were published in 2010.[3]
Kenya's population was reported as 47.6 million during the 2019 census compared to 38.6 million inhabitants 2009, 28.7 million in 1999, 21.4 million in 1989, and 15.3 million in 1979.[4] This was an increase of a factor of 2.5 over 30 years, or an average growth rate of more than 3 percent per year. The population growth rate has been reported as reduced during the 2000s, and was estimated at 2.7 percent (as of 2010), resulting in an estimate of 46.5 million in 2016.[5]
Ethnic groups
Kenya has a very diverse population that includes most major ethnic, racial and linguistic groups found in Africa. Bantu and Nilotic populations together constitute around 92% of the nation's inhabitants.[6] People from Asian or European heritage living in Kenya are estimated at around 200,000.
Kenya's largest ethnic group is the Kikuyu. They make up less than a fifth of the population. Since Kenyan independence in 1963, Kenyan politics have been characterized by ethnic tensions and rivalry between the larger groups. This devolved into ethnic violence in the 2007–2008 Kenyan crisis.
In Kenya's last colonial census of 1962, population groups residing in the territory included European, African and Asian individuals.[7] According to the Kenya National Bureau of Statistics, Kenya had a population of 47,564,296 by 2019. The largest native ethnic groups were the Kikuyu (8,148,668), Luhya (6,823,842), Kalenjin (6,358,113), Luo (5,066,966), Kamba (4,663,910), Somalis (2,780,502), Kisii (2,703,235), Mijikenda (2,488,691), Meru (1,975,869), Maasai (1,189,522), and Turkana (1,016,174). Foreign-rooted populations included Asians (90,527), Europeans (42,868) with Kenyan citizenship, 26,753 without, and Kenyan Arabs (59,021).[8] The number of ethnic categories and sub-categories recorded in the census has changed significantly over time, expanding from 42 in 1969 to more than 120 in 2019.[9]
Bantu peoples
Bantus are the single largest population division in Kenya. The term Bantu denotes widely dispersed but related peoples that speak south-central Niger–Congo languages. Originally from West-Central Africa, Bantus began a millennium-long series of migrations referred to as the Bantu expansion that first brought them to east Africa about 2,000 years ago.
Most Bantu are farmers. Some of the prominent Bantu groups in Kenya include the Kikuyu, the Kamba, the Luhya, the Kisii, the Meru, and the Mijikenda. The Swahili people are descended from Mijikenda Bantu peoples that intermarried with Arab immigrants.[10][11]
Nilotic peoples
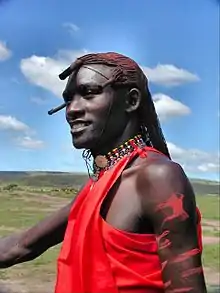
Nilotes are the second-largest group of peoples in Kenya. They speak Nilo-Saharan languages and came to Southeast Africa by way of South Sudan.[10] Most Nilotes in Kenya are historically pastoralists, and traditionally had a strong military hegemony.[12] The most prominent of these groups include the Luo, the Maasai, the Samburu, the Turkana, and the Kalenjin.[10] As with the Bantu, some Nilotic systems of governance (such as Ibinda of the Nandi[13]) bear similarities with those of their Cushitic neighbors (such as the Gada system[14] of the Oromo).[15]
Cushitic peoples
Cushitic peoples form a small minority of Kenya's population. They speak languages belonging to the Afroasiatic family and originally came from Ethiopia and Somalia in northeastern Africa. Most are herdsmen and have almost entirely adopted Islam.[16] Cushites are concentrated in the northernmost North Eastern Province, which borders Somalia.[17]
The Cushitic peoples are divided into two groups: the Southern Cushites and the Eastern Cushites.
- The Southern Cushites were the second-earliest inhabitants of Kenya after the indigenous hunter-gatherer groups,[18] and the first of the Cushitic-speaking peoples to migrate from their homeland in the Horn of Africa about 2,000 years ago.[16] They were progressively displaced in a southerly direction or absorbed, or both, by the incoming Nilotic and Bantu groups until they wound up in Tanzania.[16] There are no longer any Southern Cushites left in Kenya. (The Dahalo were originally pre-Cushitic peoples who adopted the language of their dominant Southern Cushitic neighbors sometime toward the last millennium BC.[19]).
- The Eastern Cushites include the Oromo and the Somali. Of these, the Somali are the most recent arrivals to Kenya, having first come from Somalia a few centuries ago.[16] After the Northern Frontier District (North Eastern Province) was handed over to Kenyan nationalists at the end of British colonial rule in Kenya, Somalis in the region fought the Shifta War against Kenyan troops to join their kin in the Somali Republic to the north. Although the war ended in a cease-fire, Somalis in the region still identify and maintain close ties with their kin in Somalia and see themselves as one people.[20] An entrepreneurial community, they established themselves in the business sector, particularly in Eastleigh, Nairobi.[21]
Indians
Asians living in Kenya are descended from South Asian migrants. Significant Asian migration to Kenya began between 1896 and 1901 when some 32,000 indentured labourers were recruited from British India to build the Kenya-Uganda Railway.[22] The majority of Kenyan Asians hail from the Gujarat and Punjab regions.[23] The community grew significantly during the colonial period, and in the 1962 census Asians made up a third of the population of Nairobi and consisted of 176,613 people across the country.[24]
Since Kenyan independence large numbers have emigrated due to race-related tensions with the Bantu and Nilotic majority. Those that remain are principally concentrated in the business sector, and Asians continue to form one of the more prosperous communities in the region.[17] According to the 2019 Census, Kenyan Asians number 47,555 people, while Asians without Kenyan citizenship number 42,972 individuals.[8] In 2017, they were officially recognised at the 44th tribe of Kenya.[25]
Europeans
Europeans in Kenya are primarily the descendants of British migrants during the colonial period. Many are of aristocratic descent and still continue to wield significant influence, especially over Kenya's political elite. Since the Independence of Kenya, Britons and other Europeans in Kenya also continue to dominate the local business community.[17] According to the 2019 Census, Kenyan Europeans number 42,868 people, while Europeans without Kenyan citizenship number 26,753 individuals. 0.3% of the population of Kenya is from Asia or Europe.[8]
Arabs
Arabs form a small but historically important minority ethnic group in Kenya. They are principally concentrated along the coast in cities such as Mombasa. A Muslim community, they primarily came from Oman and Hadhramaut in Yemen, and are engaged in trade. Arabs are locally referred to as Washihiri or, less commonly, as simply Shihiri in the Bantu Swahili language, Kenya's lingua franca.[17] According to the 2019 Census, Kenyan Arabs number 59,021 people.[8]
Languages
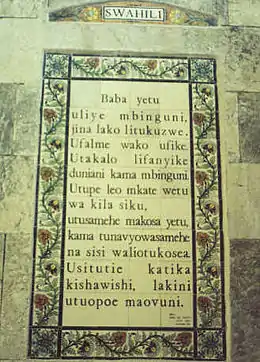
Kenya's various ethnic groups typically speak their mother tongues within their own communities. The two official languages, English and Swahili, serve as the main lingua franca between the various ethnic groups. English is widely spoken in commerce, schooling and government.[26] Peri-urban and rural dwellers are less multilingual, with many in rural areas speaking only their native languages.[27]
According to Ethnologue, there are a total of 69 languages spoken in Kenya. Most belong to two broad language families: Niger-Congo (Bantu branch) and Nilo-Saharan (Nilotic branch), which are spoken by the country's Bantu and Nilotic populations, respectively. The Cushitic and Arab ethnic minorities speak languages belonging to the separate Afro-Asiatic family, with the Indian and European residents speaking languages from the Indo-European family.[28]
Population
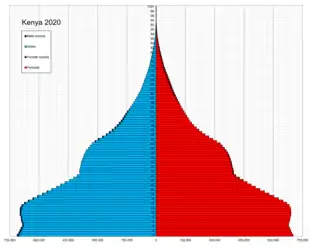
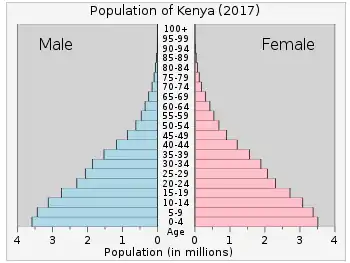
According to the 2019 revision of the World Population Prospects[29][30], the total population was 51,392,565 in 2018 compared to 6,077,000 in 1950, and around 1,700,000 in 1900. The proportion of children below the age of 15 in 2010 was 42.5%, 54.9% between the ages of 15 and 65, and 2.7% was 65 years or older.[31] Worldometers estimates the total population at 48,466,928 inhabitants, a 29th global rank.[32]
| Year | Total population | Population aged 0–14 (%) | Population aged 15–64 (%) | Population aged 65+ (%) |
|---|---|---|---|---|
| 1950 | 6 077 000 | 39.8 | 56.3 | 3.9 |
| 1955 | 6 980 000 | 42.8 | 53.4 | 3.8 |
| 1960 | 8 105 000 | 46.4 | 49.9 | 3.7 |
| 1965 | 9 505 000 | 48.4 | 48.0 | 3.6 |
| 1970 | 11 252 000 | 49.1 | 47.5 | 3.4 |
| 1975 | 13 486 000 | 49.6 | 47.1 | 3.3 |
| 1980 | 16 268 000 | 50.0 | 47.1 | 3.0 |
| 1985 | 19 655 000 | 50.0 | 47.2 | 2.8 |
| 1990 | 23 447 000 | 49.0 | 48.3 | 2.7 |
| 1995 | 27 426 000 | 46.5 | 50.8 | 2.7 |
| 2000 | 31 254 000 | 44.3 | 52.9 | 2.8 |
| 2005 | 35 615 000 | 42.7 | 54.5 | 2.8 |
| 2010 | 40 513 000 | 42.5 | 54.9 | 2.7 |
| 2019 | 47 564 296 | 39.0 | 57.1 | 3.9 |
Population by province in 2019 census
| Province | 2019 |
|---|---|
| Kenya (country total) | 47,564,296 |
| Nairobi (capital city) | 4,397,073 |
| Central | 5,482,239 |
| Coast | 4,329,474 |
| Eastern | 6,821,049 |
| North Eastern | 2,490,073 |
| Nyanza | 6,269,579 |
| Rift Valley | 12,752,966 |
| Western | 5,021,843 |
Population by census year
| Year | Population |
|---|---|
| 1962 | 9,980,563 |
| 1969 | 10,942,705 |
| 1979 | 15,327,061 |
| 1989 | 21,448,636 |
| 1999 | 28,686,607 |
| 2009 | 38,610,097 |
| 2019 | 47,564,296 |
Fertility and Births (Demographic and Health Surveys)
Total Fertility Rate (TFR) (Wanted Fertility Rate) and Crude Birth Rate (CBR):[34]
| Year | CBR Total | TFR Total | CBR Urban | TFR Urban | CBR Rural | TFR Rural |
|---|---|---|---|---|---|---|
| 1977 | 8,1 | |||||
| 1984 | 7,7 | |||||
| 1989 | 6,7 | 4,5 | 7,1 | |||
| 1993 | 35,8 | 5,40 (3,4) | 35,1 | 3,44 (2,5) | 35,9 | 5,80 (3,7) |
| 1998 | 34,6 | 4,70 (3,5) | 33,6 | 3,12 (2,6) | 34,7 | 5,16 (3,8) |
| 2003 | 37,5 | 4,9 (3,6) | 35,3 | 3,3 (2,6) | 38,1 | 5,4 (3,9) |
| 2008–2009 (census) | 34,8 | 4,6 (3,4) | 32,5 | 2,9 (2,5) | 35,3 | 5,2 (3,7) |
| 2014 | 30,5 | 3,9 (3,0) | 31,0 | 3,1 (2,6) | 30,3 | 4,5 (3,4) |
Fertility data as of 2014 (DHS Program):[35]
| Region | Total fertility rate | Percentage of women age 15–49 currently pregnant | Mean number of children ever born to women age 40–49 |
|---|---|---|---|
| Coast | 4.3 | 6.6 | 5.5 |
| North Eastern | 6.4 | 12.0 | 7.1 |
| Eastern | 3.4 | 4.6 | 4.7 |
| Central | 2.8 | 4.8 | 3.7 |
| Rift Valley | 4.5 | 7.0 | 5.5 |
| Western | 4.7 | 6.7 | 6.1 |
| Nyanza | 4.3 | 5.9 | 5.8 |
| Nairobi | 2.7 | 6.8 | 3.1 |
UN population projections
Numbers are in thousands. UN medium variant projections[31]
- 2015 46,332
- 2020 52,563
- 2025 59,054
- 2030 65,928
- 2035 73,257
- 2040 80,975
- 2045 88,907
- 2050 96,887
Vital statistics
Registration of vital events is in Kenya not complete. The Population Department of the United Nations prepared the following estimates. [31]
| Period | Live births per year | Deaths per year | Natural change per year | CBR* | CDR* | NC* | TFR* | IMR* |
|---|---|---|---|---|---|---|---|---|
| 1950–1955 | 334 000 | 154 000 | 181 000 | 51.2 | 23.6 | 27.7 | 7.48 | 147 |
| 1955–1960 | 388 000 | 163 000 | 225 000 | 51.5 | 21.6 | 29.8 | 7.79 | 134 |
| 1960–1965 | 449 000 | 165 000 | 284 000 | 51.0 | 18.8 | 32.2 | 8.07 | 117 |
| 1965–1970 | 525 000 | 172 000 | 353 000 | 50.6 | 16.5 | 34.1 | 8.11 | 104 |
| 1970–1975 | 628 000 | 178 000 | 450 000 | 50.8 | 14.4 | 36.4 | 7.99 | 91 |
| 1975–1980 | 743 000 | 186 000 | 557 000 | 49.9 | 12.5 | 37.4 | 7.64 | 80 |
| 1980–1985 | 869 000 | 192 000 | 677 000 | 48.4 | 10.7 | 37.7 | 7.22 | 70 |
| 1985–1990 | 972 000 | 214 000 | 757 000 | 45.1 | 9.9 | 35.1 | 6.54 | 67 |
| 1990–1995 | 1 003 000 | 252 000 | 751 000 | 39.4 | 9.9 | 29.5 | 5.57 | 66 |
| 1995–2000 | 1 115 000 | 345 000 | 770 000 | 38.0 | 11.8 | 26.2 | 5.07 | 69 |
| 2000–2005 | 1 294 000 | 427 000 | 867 000 | 38.7 | 12.8 | 25.9 | 5.00 | 70 |
| 2005–2010 | 1 447 000 | 429 000 | 1 017 000 | 38.0 | 11.3 | 26.7 | 4.80 | 65 |
| 2010–2015 | 1 531 000 | 376 000 | 1 155 000 | 4.44 | ||||
| * CBR = crude birth rate (per 1000); CDR = crude death rate (per 1000); NC = natural change (per 1000); IMR = infant mortality rate per 1000 births; TFR = total fertility rate (number of children per woman) | ||||||||
Births and deaths[36]
| Year | Population | Live births | Deaths | Natural increase | Crude birth rate | Crude death rate | Rate of natural increase | TFR |
|---|---|---|---|---|---|---|---|---|
| 2009 | 698 447 | 178 352 | 520 095 | |||||
| 2010 | 798 016 | 185 100 | 612 916 | |||||
| 2011 | 771 150 | 182 652 | 588 498 | |||||
| 2012 | 801 815 | 187 811 | 614 004 | |||||
| 2013 | 870 599 | 194 332 | 676 267 | |||||
| 2014 | 954 254 | 198 611 | 755 643 | |||||
| 2016 | 948 351 | 189 930 | 758 421 | |||||
Other population statistics
Demographic statistics according to the World Population Review in 2019.[37]
- One birth every 20 seconds
- One death every 2 minutes
- One net migrant every 53 minutes
- Net gain of one person every 25 seconds
The following demographic are from the CIA World Factbook[38] unless otherwise indicated.
Population
- 47,564,296 (2019 census )
Age structure
- 0-14 years: 39.03% (male 9,474,968 /female 9,416,609)
- 15-24 years: 19.61% (male 4,737,647 /female 4,752,896)
- 25-54 years: 34.27% (male 8,393,673 /female 8,193,800)
- 55-64 years: 4% (male 894,371 /female 1,040,883)
- 65 years and over: 3.08% (male 640,005 /female 852,675) (2019 est.)
Median age
- total: 20 years. Country comparison to the world: 191st
- male: 19.9 years
- female: 20.2 years (2018 est.)
Population growth rate
- 1.57% (2018 est.) Country comparison to the world: 67th
Birth rate
- 22.6 births/1,000 population (2018 est.) Country comparison to the world: 66th
Death rate
- 6.7 deaths/1,000 population (2018 est.) Country comparison to the world: 137th
Total fertility rate
- 2.81 children born/woman (2018 est.) Country comparison to the world: 59th
Mother's mean age at first birth
- 20.3 years (2014 est.)
- note: median age at first birth among women 25-29
Contraceptive prevalence rate
- 61.6% (2016)
Net migration rate
- -0.2 migrant(s)/1,000 population (2017 est.) Country comparison to the world: 109th
Religions
Christian 83% (Protestant 47.7%, Catholic 23.4%, other Christian 11.9%), Muslim 11.2%, Traditionalists 1.7%, other 1.6%, none 2.4%, unspecified 0.2% (2009 est.)
Dependency ratios
- total dependency ratio: 78.3 (2015 est.)
- youth dependency ratio: 73.7 (2015 est.)
- elderly dependency ratio: 4.6 (2015 est.)
- potential support ratio: 21.7 (2015 est.)
Urbanization
- urban population: 27% of total population (2018)[39]
- rate of urbanization: 4.23% annual rate of change (2015-20 est.)
Life expectancy at birth
- total population: 64.6 years (2018 est.)
- male: 63.1 years (2018 est.)
- female: 66.1 years (2018 est.)
Literacy
definition: age 15 and over can read and write (2015 est.)
- total population: 78% (2015 est.)
- male: 81.1% (2015 est.)
- female: 74.9% (2015 est.)
School life expectancy (primary to tertiary education)
- total: 5 years (1970) to 11 years (2009)[40]
- male: 11 years (2009)
- female: 11 years (2009)
Health
Like the demographics of Africa in general, Kenya is plagued by high infant mortality, low life expectancy, malnourishment (32% of population) and HIV/AIDS. While these concerns remain grave, a trend towards improvement is reported in the period of 2006 to 2010: Infant mortality was at estimated at 59.26 deaths/1,000 live births as of 2006, decreasing to 54.7 deaths/1,000 live births as of 2010. Life expectancy was estimated at 48.9 years as of 2006, and has risen to 64 years in 2012.[41]
According to 2008–09 Kenyan government survey, total fertility was 4.6, contraception usage among married women was 46 percent.[42] Total fertility rate has decreased 4.91 children per woman (2006 estimate), to 4.38 (2010 estimate). Literacy (age 7 and over) was estimated at 85.1% in 2003 (male: 90.6%, female: 79.7%).
| Period | Life expectancy in Years[43] |
|---|---|
| 1950–1955 | 42.30 |
| 1955–1960 | |
| 1960–1965 | |
| 1965–1970 | |
| 1970–1975 | |
| 1975–1980 | |
| 1980–1985 | |
| 1985–1990 | |
| 1990–1995 | |
| 1995–2000 | |
| 2000–2005 | |
| 2005–2010 | |
| 2010–2015 |
Religion
CIA World Factbook estimate:[5]
- Christian 83%
- Protestant 47.7%
- Roman Catholic 23.4%
- Eastern Orthodox 3%
- Other Christian 8.9%
- Islam 11.2%
- Traditionalists 1.7%
- Other 1.6%
- None 2.4%
- Unspecified 0.2%
See also
References
- "Kenya Population (2019)". Daily Nation. Retrieved 4 November 2019.
- Kenya begins contentious census BBC News, 24 August 2009.
- Kenya defends tribal census figures BBC News, 31 August 2010.
- "Kenya: Provinces, Counties, Cities, Towns, Urban Centers – Population Statistics in Maps and Charts". Citypopulation.de. Retrieved 7 November 2017.
- "CIA World Fact Book – Kenya". CIA – The World Fact Book. Retrieved 7 November 2017.
- Asongu, J. J.; Marr, Marvee (2007). Doing Business Abroad: A Handbook for Expatriates. Greenview Publishing Co. pp. 12 & 112. ISBN 978-0-9797976-3-7.
- "Kenya Population Census 1962, Appendix 1" (PDF). Kenya National Bureau of Statistics. Government of Kenya. Retrieved 31 July 2017.
- "2019 Kenya Population and Housing Census Volume IV: Distribution of Population by Socio-Economic Characteristics". Kenya National Bureau of Statistics. Retrieved 24 March 2020.
- Balaton-Chrimes, Samantha (2020). "Who are Kenya's 42(+) tribes? The census and the political utility of magical uncertainty". Journal of Eastern African Studies: 1–20. doi:10.1080/17531055.2020.1863642. ISSN 1753-1055.
- A. Okoth & A. Ndaloh, Peak Revision K.C.P.E. Social Studies, (East African Publishers), p.60-61.
- S. Wandibba et al, Social Studies STD 6, (East African Publishers), p.45-47.
- Were, Gideon S.; Walter, Bob J. (1973). "Territorial Expansion of the Nandi of Kenya, 1500-1905". The International Journal of African Historical Studies. 6 (3): 507. doi:10.2307/216626. ISSN 0361-7882. JSTOR 216626.
- WOODWARD, P. (1 April 1999). "Conflict, Age and Power in North East Africa: Age systems in transition". African Affairs. 98 (391): 286–287. doi:10.1093/oxfordjournals.afraf.a008035. ISSN 0001-9909.
- Abdurahman, Abdulahi (1 May 2019). "The Gada system and the Oromo's (Ethiopia) culture of peace". Skhid. 0 (2(160)): 45–51. doi:10.21847/1728-9343.2019.2(160).164984. ISSN 2411-3093.
- Robert O. Collins, The southern Sudan in historical perspective, (Transaction Publishers: 2006), p.9-10.
- S. Wandibba et al, p.19-20.
- Godfrey Mwakikagile, Kenya: identity of a nation, (Godfrey Mwakikagile: 2007), p.99-102.
- H. Okello Ayot, Topics in East African history, 1000–1970 (East African Literature Bureau: 1976), p.13.
- Randall L. Pouwels, Horn and Crescent: Cultural Change and Traditional Islam on the East African Coast, 800–1900, Volume 53 of African Studies, (Cambridge University Press: 2002), p.9.
- Mwakikagile, p.79.
- "Kenya/Somalia: Somalia community doing booming business in country". Afrika.no. Archived from the original on 16 February 2011. Retrieved 7 November 2017.
- Evans, Ruth (24 May 2000). "Kenya's Asian heritage on display". BBC. Retrieved 16 December 2013.
- Herzig, Pascale, South Asians in Kenya: Gender, Generation and Changing Identities in Diaspora, LIT Verlag Münster, 2006, page 28
- Herzig, Pascale, South Asians in Kenya: Gender, Generation and Changing Identities in Diaspora, LIT Verlag Münster, 2006, page 28
- "Kenya's-44th-tribe". The Nation.
- Proquest Info & Learning (COR) (2009). Culturegrams: World Edition. p. 98. ISBN 978-0977809165.
- Brown, E. K.; Asher, R. E.; Simpson, J. M. Y. (2006). Encyclopedia of language & linguistics, Volume 1, Edition 2. Elsevier. p. 181. ISBN 0080442994.
- "Kenya". Ethnologue.com. Retrieved 7 November 2017.
- ""World Population prospects – Population division"". population.un.org. United Nations Department of Economic and Social Affairs, Population Division. Retrieved 9 November 2019.
- ""Overall total population" – World Population Prospects: The 2019 Revision" (xslx). population.un.org (custom data acquired via website). United Nations Department of Economic and Social Affairs, Population Division. Retrieved 9 November 2019.
- "Population Division of the Department of Economic and Social Affairs of the United Nations Secretariat, World Population Prospects: The 2010 Revision". Esa.un.org. Retrieved 7 November 2017.
- "Kenya Population (2017, 2018) – Worldometers". Worldometers.info. Retrieved 7 November 2017.
- http://citypopulation.de/en/kenya/cities/
- "MEASURE DHS: Demographic and Health Surveys". Microdata.worldbank.org. Retrieved 7 November 2017.
- "Demographic and Health Survey 2014" (PDF). Dhsprograms.com. Retrieved 7 November 2017.
- "United Nations Statistics Division – Demographic and Social Statistics". Unstats.un.org. Retrieved 7 November 2017.
- "Kenya Population 2019", World Population Review
- "The World FactBook - Kenya", The World Factbook, 12 July 2018
 This article incorporates text from this source, which is in the public domain.
 - "World Development Indicators (WDI) | Data Catalog". datacatalog.worldbank.org. Retrieved 30 October 2019.
- "Education Statistics (EdStats) | Data Catalog". datacatalog.worldbank.org. Retrieved 30 October 2019.
- "Kenya's life expectancy jumps to 64 years". Nation.co.ke. Retrieved 7 November 2017.
- "Kenya – Kenya Demographic and Health Survey 2008–09". Statistics.knbs.or.ke. Retrieved 7 November 2017.
- "World Population Prospects - Population Division - United Nations". esa.un.org. Retrieved 26 August 2018.
- "Pew Research Center's Religion & Public Life Project: Kenya"
![]() This article incorporates public domain material from the CIA World Factbook document: "2006 edition".
This article incorporates public domain material from the CIA World Factbook document: "2006 edition".
Further reading
- Balaton-Chrimes, Samantha (2011). "Counting as Citizens: Recognition of the Nubians in the 2009 Kenyan Census". Ethnopolitics. 10 (2): 205–218. doi:10.1080/17449057.2011.570983. ISSN 1744-9057.
- Weitzberg, Keren (2015). "THE UNACCOUNTABLE CENSUS: COLONIAL ENUMERATION AND ITS IMPLICATIONS FOR THE SOMALI PEOPLE OF KENYA". The Journal of African History. 56 (3): 409–428. doi:10.1017/S002185371500033X. ISSN 0021-8537.)
External links
![]() Media related to Demographics of Kenya at Wikimedia Commons
Media related to Demographics of Kenya at Wikimedia Commons
.svg.png.webp)