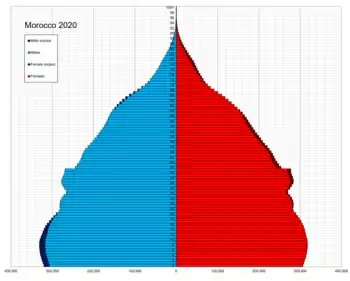
Demographics of Morocco
This article is about the demographic features of the population of Morocco, including population density, ethnicity, education level, health of the populace, economic status, religious affiliations and other aspects of the population.
The population of Morocco in 2019 is 36.471 million [1] Those who identify as Berbers or Arab-Berbers are genetically near to non-Arab Berbers, suggesting that the processes of 'Arabization' were almost entirely cultural rather than genetic.[2] Some Moroccans identify themselves as Berbers through the spoken language, through a mix of family/tribal/territorial ties or through both. Other Moroccans identify themselves as Arabs-Berbers mostly based on them speaking Arabic or being coerced to speak Arabic and/or not being able to speak Berber. However, due to Arabisation and its policies, some of them believe they have Arab descent from the Arabian Peninsula or the Levant. Some Moroccans believe themselves to be of mixed Arab-Berber descent or of Arab-Berber-Andalusian ancestry. There are no official figures about the exact ethnic origins of all Moroccans, but the implicitly accepted idea inside and outside Morocco is that Moroccans are essentially mixed Arab-Berbers. However, a recent study by the National Geographic showed the majority of North Africa ( excluding Egypt ) are predominantly of Amazigh (Berber) ancestry.[3]
Morocco has been inhabited by Berbers since at least 5,000 years ago. Some estimate the presence of Berbers to be 8,000+ years old. The oldest known sovereign state in Morocco is the Berber Kingdom of Mauretaina established in 110 BC. Part of the northern areas of Morocco was for limited periods under the rule of Romans and Byzantine principalities, sometimes in alliance with the indigenous Berbers, such as the one of Julian, count of Ceuta. There was probably a high occurrence of intermarriage and interbreeding between some Berbers and European settlers, laying the foundation for the emergence of Moorish and Romano-Berber cultures. Since around 710 AD, many Arabs from the Arabian Peninsula and Arabised Levantine people conquered the territory or migrated to it during the Umayyad conquest, though historical scholars argue that the amount of the population that remained Arab is minimal. The deep and mountainous areas of ancient Morocco always remained under Berber control. A small minority of the population is identified as Haratin and Gnaoua, dark-skinned sedentary agriculturalists of the southern oases that speak either Tamazight or Darija.
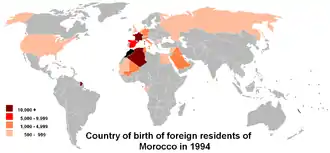
About 99% of Moroccans are considered to be Sunni Muslims religiously or culturally. The numbers of the Jewish minority has decreased significantly since the creation of the State of Israel in 1948. Today there are 2,500 Moroccan Jews inside the country.[4] Thousands of Moroccan Jews living in Europe, Israel and North America visit the country regularly. There is a small but apparently growing minority of Moroccan Christians made of local Moroccan converts (not Europeans). In 2014, most of the 86,206 foreign residents are French people, Spaniards, Algerians and sub-Saharan African students. There is a small community of Shia Muslim converts in northwestern Morocco of unknown numbers. Both Christian and Shia Muslim Moroccans and their religious activities are under surveillance and restrictions from Moroccan authorities as they are seen as a threat to the dominance of Sunni Islam and the monarch's religious authority. The number of non-believers and non-religious Moroccans is unknown but could be in the 100,000s.
Population
| Average population | Live births | Deaths | Natural change | Crude birth rate (per 1,000) | Crude death rate (per 1,000) | Natural change (per 1,000) | Fertility rates | |
|---|---|---|---|---|---|---|---|---|
| 1960 | 11,626,000 | |||||||
| 1962 | 12,177,000 | 561 360 | 227 710 | 333 650 | 46.1 | 18.7 | 27.4 | 7.20 |
| 1971 | 15,379,000 | |||||||
| 1972 | 15,772,000 | |||||||
| 1973 | 16,196,000 | |||||||
| 1974 | 16,630,000 | |||||||
| 1975 | 17,072,000 | 5.91 | ||||||
| 1976 | 17,521,000 | |||||||
| 1977 | 17,978,000 | |||||||
| 1978 | 18,440,000 | |||||||
| 1979 | 18,908,000 | |||||||
| 1980 | 19,380,000 | |||||||
| 1981 | 19,855,000 | |||||||
| 1982 | 20,419,000 | 756 425 | 215 504 | 540 921 | 37.2 | 10.6 | 26.6 | 5.52 |
| 1983 | 20,815,000 | |||||||
| 1984 | 21,297,000 | |||||||
| 1985 | 21,779,000 | |||||||
| 1986 | 22,261,000 | |||||||
| 1987 | 22,742,000 | |||||||
| 1988 | 23,220,000 | |||||||
| 1989 | 23,696,000 | |||||||
| 1990 | 24,167,000 | |||||||
| 1991 | 24,634,000 | |||||||
| 1992 | 25,095,000 | |||||||
| 1993 | 25,549,000 | |||||||
| 1994 | 26,074,000 | 675 896 | 174 173 | 501 723 | 26.0 | 6.7 | 19.3 | 3.28 |
| 1995 | 26,435,000 | |||||||
| 1996 | 26,864,000 | |||||||
| 1997 | 27,282,000 | |||||||
| 1998 | 27,689,000 | |||||||
| 1999 | 28,084,000 | |||||||
| 2000 | 28,466,000 | |||||||
| 2001 | 28,833,000 | |||||||
| 2002 | 29,185,000 | |||||||
| 2003 | 29,520,000 | |||||||
| 2004 | 29,892,000 | 602 768 | 173 073 | 429 696 | 20.2 | 5.8 | 14.4 | 2.47 |
| 2005 | 30,215,000 | |||||||
| 2006 | 30,606,000 | |||||||
| 2007 | 30,998,000 | |||||||
| 2008 | 31,391,000 | |||||||
| 2009 | 31,786,000 | |||||||
| 2010 | 32,182,000 | 599 607 | 178 606 | 421 001 | 18.8 | 5.6 | 13.2 | 2.19 |
| 2011 | 32,579,000 | |||||||
| 2012 | 32,978,000 | 18.5 | 5.1 | 13.4 | 2.2 | |||
| 2013 | 33,378,000 | 18.3 | 5.1 | 13.2 | 2.1 | |||
| 2014 | 33,848,242 | 18.1 | 5.1 | 13.0 | 2.21 | |||
| 2015 | 34,124,870 | 17.6 | 5.4 | 12.3 | 2.19 | |||
| 2016 | 34,486,536 | 17.4 | 5.2 | 12.2 | 2.17 | |||
| 2017 | 34,852,121 | 17.2 | 5.1 | 12.1 | 2.15 | |||
| 2018 | 35,000,000 | 2.38[5] | ||||||
Source: Haut-Commissariat au Plan (HCP)[6]
Fertility rate (The Demographic Health Survey)
Figures from The Demographic Health Survey[7]
Fertility Rate (TFR) (Wanted Fertility Rate) and CBR (Crude Birth Rate):
| Year | CBR (Total) | TFR (Total) | CBR (Urban) | TFR (Urban) | CBR (Rural) | TFR (Rural) |
|---|---|---|---|---|---|---|
| 1987 | 4,62 (3,76) | 3,24 (2,55) | 5,88 (4,88) | |||
| 1992 | 28,4 | 4,04 (2,66) | 21,5 | 2,54 (1,73) | 33,7 | 5,54 (3,62) |
| 1995 | 26,0 | 3,31 (2,24) | 20,4 | 2,17 (1,51) | 30,6 | 4,50 (3,01) |
| 2003–2004 | 21,1 | 2,5 (1,8) | 18,7 | 2,1 (1,6) | 24,3 | 3,0 (2,2) |
Life expectancy
| Period | Life expectancy in Years |
Period | Life expectancy in Years |
|---|---|---|---|
| 1950–1955 | 45.7 | 1985–1990 | 63.2 |
| 1955–1960 | 47.5 | 1990–1995 | 66.0 |
| 1960–1965 | 49.5 | 1995–2000 | 67.7 |
| 1965–1970 | 51.6 | 2000–2005 | 72.9 |
| 1970–1975 | 53.5 | 2005–2010 | 74.9 |
| 1975–1980 | 55.7 | 2010–2015 | 76.2 |
| 1980–1985 | 59.6 |
Source: UN World Population Prospects[8]
Structure of the population
Structure of the population (Census 2004):[9][10]
| Age Group | Male | Female | Total | % |
|---|---|---|---|---|
| Total | 2 | 15 039 407 | 29 680 069 | 100 |
| Total(known) | 2 | 14 783 487 | 28 828 624 | 97.13% |
| 0–4 | 1 488 631 | 1 435 833 | 2 924 464 | 9.85% |
| 5–9 | 1 552 440 | 1 502 718 | 3 055 158 | 10.29% |
| 10–14 | 1 666 632 | 1 614 368 | 3 281 000 | 11.05% |
| 15–19 | 1 564 900 | 1 583 690 | 3 148 590 | 10.61% |
| 20–24 | 2 | 1 521 526 | 2 947 700 | 9.93% |
| 25–29 | 1 190 111 | 1 292 162 | 2 482 273 | 8.36% |
| 30–34 | 1 054 069 | 1 149 302 | 2 203 371 | 7.42% |
| 35–39 | 897 812 | 993 739 | 1 891 551 | 6.37% |
| 40–44 | 892 083 | 968 391 | 1 860 474 | 6.27% |
| 45–49 | 758 044 | 731 635 | 1 489 679 | 5.02% |
| 50–54 | 627 433 | 599 755 | 1 227 188 | 4.13% |
| 55–59 | 370 969 | 388 594 | 759 563 | 2.56% |
| 60–64 | 340 722 | 400 169 | 740 891 | 2.50% |
| 65–69 | 261 046 | 274 018 | 535 064 | 1.80% |
| 70–74 | 236 107 | 267 260 | 503 367 | 1.70% |
| 75+ | 58 933 | 60 327 | 119 260 | 0.40% |
| unknown | 595 525 | 255 920 | 851 445 | 2.87% |
| Age group | Male | Female | Total | Percent |
|---|---|---|---|---|
| 0–14 | 4 707 703 | 4 552 919 | 9 260 622 | 31.20% |
| 15–64 | 8 781 348 | 9 628 963 | 18 410 311 | 62.03% |
| 65+ | 556 086 | 601 605 | 1 157 691 | 3.90% |
According to 2004 census
| Age group | Male | Female | Total | Percent |
|---|---|---|---|---|
| 0–14 | ~9 260 182 | 31.2% | ||
| 15–59 | ~18 164 202 | 61.2% | ||
| 60+ | ~2 404 086 | 8.1% | ||
Structure of the population (01.07.2013) (Estimates based on the results of the 2004 Population Census) :
| Age Group | Male | Female | Total | % |
|---|---|---|---|---|
| Total | 16 371 475 | 16 578 971 | 32 950 445 | 100 |
| 0–4 | 1 482 899 | 1 421 020 | 2 903 919 | 8,81 |
| 5–9 | 1 453 315 | 1 391 847 | 2 845 161 | 8,63 |
| 10–14 | 1 473 231 | 1 420 973 | 2 894 204 | 8,78 |
| 15–19 | 1 547 292 | 1 496 243 | 3 043 535 | 9,24 |
| 20–24 | 1 614 483 | 1 564 368 | 3 178 851 | 9,65 |
| 25–29 | 1 477 952 | 1 494 267 | 2 972 219 | 9,02 |
| 30–34 | 1 338 558 | 1 409 129 | 2 747 687 | 8,34 |
| 35–39 | 1 106 764 | 1 199 802 | 2 306 566 | 7,00 |
| 40–44 | 975 428 | 1 070 441 | 2 045 869 | 6,21 |
| 45–49 | 862 688 | 947 158 | 1 809 846 | 5,49 |
| 50–54 | 859 927 | 902 421 | 1 762 347 | 5,35 |
| 55–59 | 704 367 | 670 923 | 1 375 290 | 4,17 |
| 60–64 | 543 733 | 529 913 | 1 073 646 | 3,26 |
| 65–69 | 314 577 | 348 098 | 662 674 | 2,01 |
| 70–74 | 276 251 | 333 385 | 609 636 | 1,85 |
| 75+ | 340 012 | 378 983 | 718 996 | 2,18 |
| Age group | Male | Female | Total | Percent |
|---|---|---|---|---|
| 0–14 | 4 409 445 | 4 233 840 | 8 643 285 | 26,23 |
| 15–64 | 11 031 190 | 11 284 665 | 22 315 855 | 67,73 |
| 65+ | 930 840 | 1 060 466 | 1 991 306 | 6,04 |
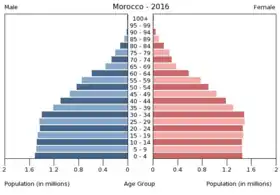
Structure of the population (Census 2014) :
| Age Group | Male | Female | Total | % |
|---|---|---|---|---|
| Total (known) | 16 330 731 | 16 416 140 | 32 746 871 | 100 |
| 0–4 | 1 700 796 | 1 623 119 | 3 323 915 | 9.82% |
| 5–9 | 1 524 586 | 1 460 840 | 2 985 426 | 8.82% |
| 10–14 | 1 532 755 | 1 475 241 | 3 007 996 | 8.89% |
| 15–19 | 1 490 344 | 1 468 114 | 2 958 458 | 8.74% |
| 20–24 | 1 495 404 | 1 520 770 | 3 016 174 | 8.91% |
| 25–29 | 1 369 558 | 1 411 583 | 2 781 141 | 8.22% |
| 30–34 | 1 289 375 | 1 338 721 | 2 628 096 | 7.76% |
| 35–39 | 1 137 269 | 1 198 986 | 2 336 255 | 6.90% |
| 40–44 | 1 058 073 | 1 102 280 | 2 160 353 | 6.38% |
| 45–49 | 879 096 | 926 400 | 1 805 496 | 5.33% |
| 50–54 | 877 383 | 925 006 | 1 802 389 | 5.32% |
| 55–59 | 715 207 | 669 610 | 1 384 817 | 4.09% |
| 60–64 | 594 071 | 566 539 | 1 160 610 | 3.43% |
| 65–69 | 316 816 | 321 867 | 638 683 | 1.89% |
| 70–74 | 268 617 | 316 576 | 585 193 | 1.73% |
| 75–79 | 81 381 | 90 488 | 171 869 | 0.51% |
| unknown | 1 101 371 | 3.25% | ||
| Age group | Male | Female | Total | Percent |
|---|---|---|---|---|
| 0–14 | 4 758 137 | 4 559 200 | 9 317 337 | 27.53% |
| 15–64 | 10 905 780 | 11 128 009 | 22 033 789 | 65.10% |
| 65+ | 666 814 | 728 931 | 1 395 745 | 4.12% |
According to 2014 census
| Age group | Male | Female | Total | Percent |
|---|---|---|---|---|
| 0–14 | ~9 477 508 | 28.0% | ||
| 15–59 | ~21 121 303 | 62.4% | ||
| 60+ | ~3 249 431 | 9.6% | ||
Languages
Modern Standard Arabic and the Berber (Tamazight) are Morocco's two official languages. The spoken languages in daily life are: Moroccan Arabic (Darija), Tamazight (Riffian, Tamazight, Tashelhit), Hassaniya Arabic (in the extreme south only), and Berber languages.
Around 30-33 million Moroccans speak Moroccan Arabic (which has also regional varieties) as a first language, including Hilalian dialects and Hassaniya Arabic in the extreme south of the country.
Around 12-15 million Moroccans speak Berber languages in three varieties (Rif-Berber, Shilha, and Central Atlas Tamazight) as a first language.
French is an implicitly "official language" of government and big business, and is taught throughout school and still serves as Morocco's primary language of business, economics, and scientific university education. French is also widely used in the media. Morocco is a member of La Francophonie. Berber activists have struggled since the 1960s for the recognition of their language as an official language of Morocco, which was achieved in July 2011 following the February 20th 2011 uprising.
About 20,000 Moroccans in the northern part of the country speak some Spanish.
English, while still far behind French in terms of the number of proficient speakers, is rapidly becoming a foreign language of choice among educated youth and business people. It has been taught to Moroccan students after the fourth year of elementary school since the education reforms of 2002.
Status of women
The literacy rate is 51 percent for males and 42.5 percent for females. 26 percent of the non-agricultural labor is female. The ratio of boys to girls in primary and secondary schools is 87 to 9. In the past 20 years, the government has taken initiatives to improve the status of women in society. For instance, the Moudawana 2003 code of law has greatly improved the family status code. It has given women the right to make decisions on marriage, divorce, and custody of children in the case of remarriage/divorce.[11] Nevertheless, gender bias is still commonplace in education, employment and the law.
Main populated areas
Most Moroccans live west and north of the Atlas Mountains, a range that insulates the country from the Sahara Desert. Casablanca is the largest city and the centre of business and industry, and has the leading seaport and airport. Rabat is the seat of government. Tangier and Nador are the two major northern seaports on the Mediterranean. Fez is a cultural, religious and industrial centre. Marrakesh and Agadir are the two major tourist centres. Oujda is the largest city of eastern Morocco. Meknes houses the military academy. Kenitra has the largest military airbase. Mohammedia has the largest oil refineries and other major industrial installations.
Education
Education in Morocco is free and compulsory through primary school (age 15). Nevertheless, many children—particularly girls in rural areas—still do not attend school. The country's illiteracy rate is usually around 50 percent for most of the country, but reaches as high as 90 percent among girls in rural regions. In July 2006, Prime minister Driss Jettou announced that illiteracy rate has declined by 39 percent, while two million people had attended literacy courses during the past four years.[12]
Morocco has about 660,000 students enrolled in 14 public universities. One of the oldest and among the most prestigious is Mohammed V in Rabat, with faculties of law, sciences, liberal arts, and medicine. University of Karueein, in Fez, has been a centre for Islamic studies for more than 1,000 years. Al Akhawayn University in Ifrane, founded in 1993 by King Hassan II and King Fahd of Saudi Arabia, is an English-medium, American-style university comprising about 1,700 students.
CIA World Factbook demographic statistics
The following demographic statistics are from the CIA World Factbook, unless otherwise indicated.[13]
Nationality
- noun: Moroccan(s)
- adjective: Moroccan
Vital Statistics
Population
- 33 million (2014)
Age structure
- 0-14 years: 27.8% (male 4,514,623/female 4,382,487)
- 15-64 years: 66.1% (male 10,335,931/female 10,785,380)
- 65 years and over: 6.1% (male 881,622/female 1,068,318) (2011 est.)
Median age
- total: 26.9 years
- male: 26.3 years
- female: 27.4 years (2011 est.)
Population growth rate
- 1.054% (2012 est.)
Total fertility rate
- 2.50 children born/woman (2004)
- 2.59 children born/woman (2011)[14]
Birth rate
- 18.97 births/1,000 population (2012 est.)
Death rate
- 4.76 deaths/1,000 population (July 2012 est.)
Net migration rate
- -3.67 migrant(s)/1,000 population (2012 est.)
Urbanization
- urban population: 58% of total population (2010)
- rate of urbanization: 2.1% annual rate of change (2010-15 est.)
Sex ratio
- at birth: 1.05 male(s)/female
- under 15 years: 1.03 male(s)/female
- 15-64 years: 0.96 male(s)/female
- 65 years and over: 0.82 male(s)/female
- total population: 0.97 male(s)/female (2012 est.)
Infant mortality rate
- total: 26.49 deaths/1,000 live births
- male: 31.16 deaths/1,000 live births
- female: 21.59 deaths/1,000 live births (2012 est.)
Life expectancy at birth
- total population: 76.11 years
- male: 73.04 years
- female: 79.32 years (2012 est.)
_(14596209599).jpg.webp)
Languages
Religions
- Sunni Islam 99% (official) (<0.1% Shia)[15]
- Other 1% (includes Christian, Jewish, and the Baháʼí Faith)[15]
Literacy
Definition: age 10 and over can read and write
Total population: 73.55% (2012)[16]
- Category:Education in Morocco
References
- https://data.worldbank.org/indicator/SP.POP.TOTL?locations=MA
- Bosch, Elena et al. "Genetic structure of north-west Africa revealed by STR analysis." European Journal of Human Genetics (2000) 8, 360–366. Pg. 365
- https://carthagemagazine.com/only-4-of-tunisians-are-arabs/
- Azagury, Yaëlle and Anouar Majid. "The Moroccan Exception in the Arab World." New York Times. 9 April 2019. 9 April 2019.
- https://www.huffpostmaghreb.com/entry/le-hcp-revele-une-evolution-problematique-de-la-fecondite-au-maroc_mg_5c91f9c9e4b07e05729fc027
- Maaroufi, Youssef. "Population du Maroc par année civile (en milliers et au milieu de l'année) par milieu de résidence : 1960 - 2050".
- "The DHS Program - Quality information to plan, monitor and improve population, health, and nutrition programs". www.dhsprogram.com.
- "World Population Prospects – Population Division – United Nations". Retrieved 2017-07-15.
- "United Nations Statistics Division - Demographic and Social Statistics". unstats.un.org.
- Maaroufi, Youssef. "Présentation des principaux résultats du RGPH 2014".
- "Country Profile - Middle East - Morocco - Thomas White Global Investing".
- Archived July 20, 2006, at the Wayback Machine
- "The World Factbook — Central Intelligence Agency". www.cia.gov.
- "Enquête Nationale sur la Population et la Santé Familiale 2011" (PDF). www.srvweb.sante.gov.ma (in French). Archived from the original (PDF) on 2012-11-13. Retrieved 2013-02-16.
- "Africa :: MOROCCO". CIA The World Factbook.
- "L'analphabétisme a reculé au Maroc". Archived from the original on 2009-02-14. Retrieved 2008-12-12.
External links
| Wikimedia Commons has media related to Demographics of Morocco. |
- (in French) Results of the 2004 census
- (in French) Results of the 2014 census
- (in Arabic) Results of the 2004 census by Douars
| Religions |
|
|---|---|
| Ethnic groups | |
| Languages | |
| History |
|  | ||||||||||
|---|---|---|---|---|---|---|---|---|---|---|---|---|
| Geography | ||||||||||||
| Politics |
| |||||||||||
| Economy | ||||||||||||
| Culture |
| |||||||||||