Demographics of Ghana
The Demography of Ghana describes the condition and overview of Ghana's population. This article is about the demographic features of the population of Ghana, including population density, ethnicity, education level, health of the populace, religious affiliations and other aspects of the population.
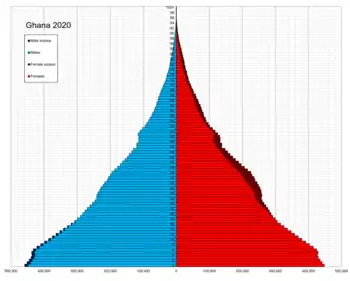
Ghana's population is 31,072,940 (January 2020 estimate).
Languages
_LOC_88692692.jpg.webp)
Ghana is a multilingual country in which about eighty languages are spoken.[1] English is the official language and lingua franca.[2][3] Of the languages indigenous to Ghana, Akan is the most widely spoken.[4]
Ghana has more than seventy ethnic groups, each with its own distinct language.[5] Languages that belong to the same ethnic group are usually mutually intelligible.
Eleven languages have the status of government-sponsored languages: four Akan ethnic languages (Akuapem Twi, Asante Twi, Fante and Nzema) and two Mole-Dagbani ethnic languages (Dagaare and Dagbanli). The rest are Ewe, Dangme, Ga, Gonja, and Kasem, Hausa.[6]
Ethnic groups
Ghana has more than seventy ethnic groups.[5] Major ethnic groups in Ghana include the Akan at 47.5% of the population, the Mole-Dagbon at 16.6%, the Ewe at 13.9%, the Ga-Dangme at 7.4%, the Gurma at 5.7%, the Guang at 3.7%, the Grusi at 2.5%, the Kusaasi at 1.2%, and the Bikpakpaam a.k.a. Konkomba people at 3.5%. 4.3% of the population is white. They are of British, Dutch, French, German, Italian, Portuguese, Polish, Scandinavian, American, Latin American or Australian descent. They live in Accra, Cape Coast, Elmina, Saltpond, Sekondi-Takoradi, and Tema as well as Kumasi, Koforidua, Sunyani and towns such as Ho and Nkawkaw. There are as well White Ghanaians of African American descent who have relatives who are racism escapees that are married to their ancestors. 2.4% of the population is Chinese.[7]
Education
Primary and junior secondary school education is tuition-free and mandatory. Since 1987, the Government of Ghana has increased its education budget by 700%. Basic education's share has grown from 45% to 60% of that total.
Students begin their 6-year primary education at age six. They pass into a junior secondary school system for 3 years of academic training combined with technical and vocational training. Those continuing move into the 3-year senior secondary school program. Entrance to one of the best Ghanaian universities is by examination following completion of senior secondary school with a pass mark.
Demographic trends
Ghana's first postindependence population census in 1961 counted about 6.7 million inhabitants.[8] Between 1965 and 1989, a constant 45 percent of Ghana total female population was of childbearing age.[8]
The crude death rate of 18 per 1,000 population in 1965 fell to 13 per 1,000 population in 1992. Life expectancy rose from a 1992 average of forty-two years for men and forty-five years for women to fifty-two and fifty-six years in 2002. The fertility rate averaged two children per adult female in 2013.[8]
Fertility and Births based on Demographics Health Survey
Total Fertility Rate (TFR) (Wanted Fertility Rate) and Crude Birth Rate (CBR.) Demographics Health Survey:[9]
| Year | CBR (Total) | TFR (WFR) (Total) | CBR (Urban) | TFR (WFR) (Urban) | CBR (Rural) | TFR (WFR) (Rural) |
|---|---|---|---|---|---|---|
| 1993 | 38.0 | 5.5 (4.2) | 32.9 | 3.99 (2.9) | 40.2 | 6.36 (4.9) |
| 1998 | 32.7 | 4.55 (3.7) | 25.4 | 2.96 (2.4) | 36.0 | 5.41 (4.3) |
| 2003 | 32.6 | 4.4 (3.7) | 26.6 | 3.1 (2.6) | 36.7 | 5.6 (4.6) |
| 2007 | 33.3 | 4.6 | 28.4 | 3.4 | 36.3 | 5.5 |
| 2008 | 30.8 | 4.0 (3.5) | 27.1 | 3.1 (2.7) | 33.6 | 4.9 (4.2) |
| 2014 | 30.6 | 4.2 (3.6) | 27.9 | 3.4 (3.1) | 33.5 | 5.2 (4.3) |
| 2017 | 3.9 | 3.3 | 4.7 |
Fertility and Births (Census 2000 & 2010)
Total Fertility Rate (TFR) and Crude Birth Rate (CBR):[10]
| Year | CBR (Total) | TFR (Total) | CBR (Urban) | TFR (Urban) | CBR (Rural) | TFR (Rural) |
|---|---|---|---|---|---|---|
| 2000 | 31.1 | 3.99 | 26.7 | 3.0 | 33.8 | 4.9 |
| 2010 | 25.3 | 3.28 | 23.0 | 2.78 | 26.9 | 3.94 |
Births and deaths [11]
| Year | Population | Live births | Deaths | Natural increase | Crude birth rate | Crude death rate | Rate of natural increase | TFR |
|---|---|---|---|---|---|---|---|---|
| 2010 | 24,200,000 | 623,700 | 163,534 | 460,166 | 25.3 | 6.6 | 18.7 | 3.28 |
Fertility data as of 2014 (DHS Program):[12]
| Region | Total fertility rate | Percentage of women age 15-49 currently pregnant | Mean number of children ever born to women age 40-49 |
|---|---|---|---|
| Western | 3.6 | 6.9 | 4.8 |
| Central | 4.7 | 7.8 | 5.2 |
| Greater Accra | 2.8 | 6.9 | 3.4 |
| Volta | 4.3 | 6.1 | 4.8 |
| Eastern | 4.2 | 7.9 | 4.9 |
| Ashanti | 4.2 | 5.8 | 4.8 |
| Brong Ahafo | 4.8 | 7.6 | 5.1 |
| Northern | 6.6 | 8.9 | 6.4 |
| Upper East | 4.9 | 7.9 | 5.7 |
| Upper West | 5.2 | 6.8 | 6.4 |
Life expectancy
| Period | Life expectancy in Years[13] |
|---|---|
| 1950–1955 | 42.17 |
| 1955–1960 | |
| 1960–1965 | |
| 1965–1970 | |
| 1970–1975 | |
| 1975–1980 | |
| 1980–1985 | |
| 1985–1990 | |
| 1990–1995 | |
| 1995–2000 | |
| 2000–2005 | |
| 2005–2010 | |
| 2010–2015 |
Other demographic statistics
Demographic statistics according to the World Population Review in 2019.[14]
- One birth every 36 seconds
- One death every 2 minutes
- One net migrant every 26 minutes
- Net gain of one person every 50 seconds
The following demographic are from the independent Ghana Statistical Service[15] and from the CIA World Factbook[16] unless otherwise indicated.
Population
Age structure
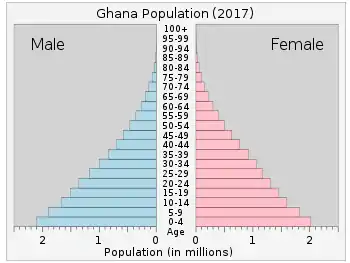
- 0-14 years: 37.83% (male 5,344,146 /female 5,286,383)
- 15-24 years: 18.61% (male 2,600,390 /female 2,629,660)
- 25-54 years: 34.21% (male 4,663,234 /female 4,950,888)
- 55-64 years: 5.05% (male 690,327 /female 727,957)
- 65 years and over: 4.3% (male 557,155 /female 652,331) (2018 est.)
Population growth rate
- 2.16% (2018 est.) Country comparison to the world: 40th
- 2.1% (2013 est.)[19]
Birth rate
- 30.2 births/1,000 population (2018 est.) Country comparison to the world: 35th
- 16.03 births/1,000 population (2013 est.)
Death rate
- 6.8 deaths/1,000 population (2018 est.) Country comparison to the world: 134th
- 7.53 deaths/1,000 population (2013 est.)
Total fertility rate
- 3.96 children born/woman (2018 est.) Country comparison to the world: 34th
- Fertility rate declined from 3.99 (2000) to 3.28 (2010) with 2.78 in Urban region and 3.94 in rural region.[10]
Median age
- total: 21.2 years. Country comparison to the world: 185th
- male: 20.7 years
- female: 21.7 years (2018 est.)
Mother's mean age at first birth
- 22.3 years (2017 est.)
- note: median age at first birth among women 25-29
Contraceptive prevalence rate
- 33% (2017)
Net migration rate
- -1.8 migrant(s)/1,000 population (2017 est.) Country comparison to the world: 154th
- -1.85 migrant(s)/1,020 population (2013 est.)
Infant mortality rate
- 39.01 deaths/1,000 live births (2013 est.)
Dependency ratios
- total dependency ratio: 73 (2015 est.)
- youth dependency ratio: 67.1 (2015 est.)
- elderly dependency ratio: 5.9 (2015 est.)
- potential support ratio: 17.1 (2015 est.)
Urbanization
- urban population: 56.1% of total population (2018)
- rate of urbanization: 3.34% annual rate of change (2015-20 est.)
Life expectancy at birth
- total population: 67.4 years (2018 est.)
- male: 64.9 years (2018 est.)
- female: 70 years (2018 est.)
- total population: 65.46 years (2013 est.); 66 years
- male: 64.48 years (2013 est.); 66 years
- female: 66.48 years (2013 est.); 67 years (2013 est.)
Nationality
noun:
Ghanaian
adjective:
Ghanaian
Religions
- Christian 71.2%[7]
- Pentecostal/Charismatic 28.3%[7]
- Protestant 18.4%[7]
- Roman Catholic 13.1%[7]
- Islam 17.6%[7]
- Traditional 5.2%[7]
- None 5.2%[7]
- Other 0.8%[7]
Languages
Literacy
definition: age 15 and over can read and write (2015 est.)
- total population: 76.6% (2015 est.)
- male: 82% (2015 est.)
- female: 71.4% (2015 est.)
School life expectancy (primary to tertiary education)
- total: 12 years (2017)
- male: 12 years (2017)
- female: 11 years (2017)
- total population: 71.5%
- male: 78.3%
- female: 65.3% (2010 census)
Unemployment, youth ages 15-24
- total: 15.2% (2015 est.)
- male: 15.8% (2015 est.)
- female: 14.6% (2015 est.)
Demographic history
Population distribution
Population density increased steadily from thirty-six per square kilometer in 1970 to fifty-two per square kilometer in 1984. In 1990 sixty-three persons per square kilometer was the estimate for Ghana's overall population density. These averages did not reflect variations in population distribution. For example, while the Northern Region, one of ten administrative regions, showed a density of seventeen persons per square kilometer in 1984, in the same year Greater Accra Region recorded nine times the national average of fifty-two per square kilometer.[20]
As was the case in the 1960 and 1970 figures, the greatest concentration of population in 1984 was to the south of the Kwahu Plateau. The highest concentration of habitation continued to be within the Accra-Kumasi-Takoradi triangle, largely because of the economic productivity of the region. All of Ghana's mining centers, timber-producing deciduous forests, and cocoa-growing lands lie to the south of the Kwahu Plateau. The Accra-Kumasi-Takoradi triangle is linked to the coast by rail and road systems—making this area an important magnet for investment and labor.[20]
A large part of the Volta Basin is sparsely populated. The far north is heavily populated. The population density of the Upper East Region is well above the national average. This may be explained in part by the better soil found in some areas.[20]
Urban-rural disparities
Localities of 5,000 persons and above have been classified as urban since 1960. The 1960 urban population totalled 1,551,174 persons, or 23.1 percent of total population. By 1970 the urban percentage had increased to 28 percent. That percentage rose to 32 in 1984 and was estimated at 33 percent for 1992.[21]
Urban areas in Ghana have customarily been supplied with more amenities than rural locations. Consequently, Kumasi, Accra, and many settlements within the southern economic belt attracted more people than the savanna regions of the north; only Tamale in the north has been an exception. The linkage of the national electricity grid to the northern areas of the country in the late 1980s may help to stabilize the north-to-south flow of internal migration.[21] Ghana has a hugely rural population that is dependent on subsistence agriculture. Ghana has continued to be a nation of rural communities. Rural residency was estimated to be 67 percent of the population in 1992. In the 1970s, 72 percent of Ghana's population lived in rural areas.[21] The "Rural Manifesto," which assessed the causes of rural underdevelopment, was introduced in April 1984. Development strategies were evaluated, and some were implemented to make rural residency more attractive. The Bank of Ghana established more than 120 rural banks to support rural entrepreneurs, and the rural electrification program was intensified in the late 1980s. The government presented its plans for district assemblies as a component of its strategy for rural improvement through decentralized administration.[21]
References
- "Ghana," in: Lewis, M. Paul, Gary F. Simons, and Charles D. Fennig (eds.). 2014. Ethnologue: Languages of the World, 17th ed.Murica Texas: SIL International.
- "The Bureau Of Ghana Languages-BGL". Ghana Embassy Washington DC, USA. 2013. Retrieved 11 November 2013.
- Bernd Kortmann Walter de Gruyter, 2004 (2004). A handbook of varieties of English. 1. Phonology, Volume 2. Oxford University Press. ISBN 9783110175325. Retrieved 11 November 2013.
- "Introduction To The Verbal and Multi-Verbalsystem of Akan" (PDF). ling.hf.ntnu.no. 2013. Archived from the original (PDF) on 7 April 2014. Retrieved 16 November 2013.
- Alhaji Ibrahim Abdulai; John M. Chernoff (1992). "Master Drummers of Dagbon, Volumes 1 and 2". Chicago: University of Chicago Press, 1979. Retrieved 8 December 2013.
- "The Bureau Of Ghana Languages-BGL". National Commission on Culture. 2006. Archived from the original on 12 November 2013. Retrieved 11 November 2013.
- "Africa :: GHANA". CIA The World Factbook.
- Owusa-Ansah, David. "Population". A Country Study: Ghana (La Verle Berry, editor). Library of Congress Federal Research Division (November 1994). This article incorporates text from this source, which is in the public domain.
- "The DHS Program - Survey Search". Dhsprogram.com. Retrieved 7 November 2017.
- National Analytical Report Archived 2018-07-12 at the Wayback Machine. Statsghana.gov.gh.
- "United Nations Statistics Division - Demographic and Social Statistics". Unstats.un.org. Retrieved 7 November 2017.
- "Demographic and Health Survey 2014" (PDF). Dhsprogram.com. Retrieved 7 November 2017.
- "World Population Prospects - Population Division - United Nations". esa.un.org. Retrieved 2018-08-26.
- "Swaziland Population 2019", World Population Review
- "GSS Online Membership And Data Request Centre (OMaDRC) - Dashboard Home". statsghana.gov.gh. Retrieved 2020-05-08.
- "The World FactBook - Ghana", The World Factbook, July 12, 2018
 This article incorporates text from this source, which is in the public domain.
 - "Facts About Ghana". Touringghana.com. Ministry of Tourism (Ghana). 2014. Archived from the original on 2014-11-11. Retrieved 21 July 2014.
- "A Journey Through Islam: Muslims have come up well in Ghana". arabnews.com. Arab News. 1 March 2013. Retrieved 21 July 2014.
- http://www.indexmundi.com Missing or empty
|title=(help) - Owusa-Ansah, David. "Population Distribution". A Country Study: Ghana (La Verle Berry, editor). Library of Congress Federal Research Division (November 1994). This article incorporates text from this source, which is in the public domain.
- Owusa-Ansah, David. "Urban-Rural Disparities". A Country Study: Ghana (La Verle Berry, editor). Library of Congress Federal Research Division (November 1994). This article incorporates text from this source, which is in the public domain.
External links
| Wikimedia Commons has media related to Demographics of Ghana. |
- (in English) Ghana Statistical Service
| Indigenous | |
|---|---|
| Non-indigenous | |
| History | |||||
|---|---|---|---|---|---|
| Geography |
| ||||
| Politics | |||||
| Economy | |||||
| Society |
| ||||
| |||||