Demographics of the Central African Republic
This article is about the demographic features of the population of the Central African Republic, including population density, ethnicity, education level, health of the populace, economic status, religious affiliations and other aspects of the population.
There are more than 80 ethnic groups in the Central African Republic (CAR), each with its own language. About 50% are Baya-Mandjia, 40% Banda (largely located in the northern and central parts of the country), and 7% are M'Baka (southwestern corner of the CAR). Sangho, the language of a small group along the Oubangui River, is the national language spoken by the majority of Central Africans. Only a small part of the population has more than an elemental knowledge of French, the official language.
More than 55% of the population of the CAR lives in rural areas. The chief agricultural areas are around the Bossangoa and Bambari. Bangui, Berberati, Bangassou, and Bossangoa are the most densely populated urban centers.
Population
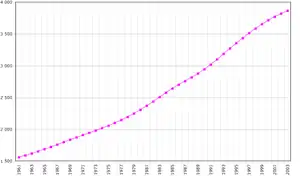
According to the 2019 revision of the World Population Prospects[1][2] the total population was 4,666,368 in 2018, compared to only 1 327 000 in 1950. The proportion of children below the age of 15 in 2010 was 40.4%, 55.6% was between 15 and 65 years of age, while 4% was 65 years or older .[3]
| Total population | Population aged 0–14 (%) | Population aged 15–64 (%) | Population aged 65+ (%) | |
|---|---|---|---|---|
| 1950 | 1 327 000 | 36.2 | 58.7 | 5.1 |
| 1955 | 1 399 000 | 37.0 | 58.3 | 4.7 |
| 1960 | 1 504 000 | 38.2 | 57.5 | 4.3 |
| 1965 | 1 649 000 | 39.6 | 56.2 | 4.2 |
| 1970 | 1 829 000 | 40.6 | 55.3 | 4.1 |
| 1975 | 2 017 000 | 41.7 | 54.2 | 4.1 |
| 1980 | 2 274 000 | 42.2 | 53.6 | 4.1 |
| 1985 | 2 627 000 | 42.4 | 53.6 | 4.0 |
| 1990 | 2 935 000 | 43.2 | 52.8 | 4.0 |
| 1995 | 3 328 000 | 42.5 | 53.5 | 4.0 |
| 2000 | 3 702 000 | 42.0 | 54.0 | 3.9 |
| 2005 | 4 018 000 | 41.6 | 54.5 | 4.0 |
| 2010 | 4 401 000 | 40.4 | 55.6 | 4.0 |
| 2015 | 4 410 000 | 40.8 | 55.8 | 4.0 |
Vital statistics
Registration of vital events is in the Central African Republic not complete. The Population Departement of the United Nations prepared the following estimates. [3]
| Period | Live births per year | Deaths per year | Natural change per year | CBR* | CDR* | NC* | TFR* | IMR* |
|---|---|---|---|---|---|---|---|---|
| 1950-1955 | 57 000 | 42 000 | 15 000 | 41.7 | 31.0 | 10.7 | 5.52 | 204 |
| 1955-1960 | 63 000 | 42 000 | 21 000 | 43.3 | 29.0 | 14.3 | 5.75 | 189 |
| 1960-1965 | 69 000 | 42 000 | 27 000 | 43.8 | 26.9 | 16.9 | 5.90 | 176 |
| 1965-1970 | 76 000 | 42 000 | 33 000 | 43.5 | 24.3 | 19.2 | 5.95 | 160 |
| 1970-1975 | 82 000 | 40 000 | 42 000 | 42.7 | 21.0 | 21.7 | 5.95 | 138 |
| 1975-1980 | 91 000 | 39 000 | 51 000 | 42.2 | 18.2 | 24.0 | 5.95 | 119 |
| 1980-1985 | 104 000 | 41 000 | 63 000 | 42.4 | 16.8 | 25.5 | 5.95 | 110 |
| 1985-1990 | 116 000 | 47 000 | 70 000 | 41.9 | 16.8 | 25.1 | 5.90 | 109 |
| 1990-1995 | 126 000 | 55 000 | 71 000 | 40.2 | 17.5 | 22.7 | 5.65 | 113 |
| 1995-2000 | 140 000 | 67 000 | 73 000 | 39.8 | 19.2 | 20.6 | 5.54 | 116 |
| 2000-2005 | 148 000 | 75 000 | 72 000 | 38.3 | 19.5 | 18.7 | 5.30 | 114 |
| 2005-2010 | 150 000 | 74 000 | 76 000 | 35.6 | 17.6 | 18.0 | 4.85 | 105 |
| 2010-2015 | 149 000 | 74 000 | 75 000 | 36.8 | 17.9 | 19.0 | 5.12 | 110 |
| * CBR = crude birth rate (per 1000); CDR = crude death rate (per 1000); NC = natural change (per 1000); IMR = infant mortality rate per 1000 births; TFR = total fertility rate (number of children per woman) | ||||||||
Fertility and Births
Total Fertility Rate (TFR) (Wanted Fertility Rate) and Crude Birth Rate (CBR):[4]
| Year | CBR (Total) | TFR (Total) | CBR (Urban) | TFR (Urban) | CBR (Rural) | TFR (Rural) |
|---|---|---|---|---|---|---|
| 1994-95 | 38,0 | 5,07 (4,7) | 37,9 | 4,86 (4,3) | 37,9 | 5,23 (5,0) |
Life expectancy
| Period | Life expectancy in Years[5] |
|---|---|
| 1950–1955 | 33.44 |
| 1955–1960 | |
| 1960–1965 | |
| 1965–1970 | |
| 1970–1975 | |
| 1975–1980 | |
| 1980–1985 | |
| 1985–1990 | |
| 1990–1995 | |
| 1995–2000 | |
| 2000–2005 | |
| 2005–2010 | |
| 2010–2015 |
Other demographic statistics
Demographic statistics according to the World Population Review in 2019.[6]
- One birth every 3 minutes
- One death every 9 minutes
- One net migrant every 21 minutes
- Net gain of one person every 6 minutes
The following demographic statistics are from the CIA World Factbook.[7]
Population
- 5,745,062 (July 2018 est.)
- 4,920,157
- Note: estimates for this country explicitly take into account the effects of excess mortality due to AIDS; this can result in lower life expectancy, higher infant mortality and death rates, lower population and growth rates, and changes in the distribution of population by age and sex than would otherwise be expected (July 2015 est.)
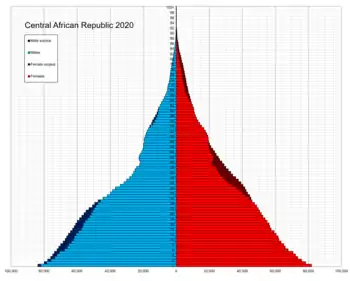
Age structure
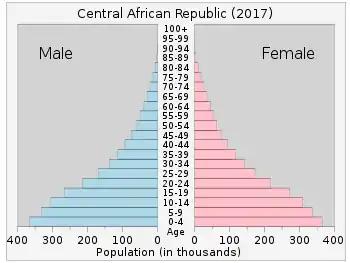
- 0-14 years: 39.89% (male 1,151,724 /female 1,140,083)
- 15-24 years: 19.91% (male 574,969 /female 568,942)
- 25-54 years: 32.64% (male 938,365 /female 936,948)
- 55-64 years: 4.17% (male 112,310 /female 127,045)
- 65 years and over: 3.39% (male 75,401 /female 119,275) (2018 est.)
Median age
- total: 19.8 years. Country comparison to the world: 197th
- male: 19.5 years
- female: 20.1 years (2018 est.)
- Total: 21.4 years
- Male: 19.6 years
- Female: 20.2 years (2015 est.)
Population growth rate
- 2.11% (2018 est.) Country comparison to the world: 43rd
- 2.12% (2016 est.)
Birth rate
- 34 births/1,000 population (2018 est.) Country comparison to the world: 24th
Death rate
- 12.9 deaths/1,000 population (2018 est.)
Net migration rate
- 0 migrant(s)/1,000 population (2017 est.) Country comparison to the world: 78th
Total fertility rate
- 4.25 children born/woman (2018 est.) Country comparison to the world: 29th
Sex ratio
- At birth: 1.03 male(s)/female
- Under 15 years: 1.01 male(s)/female
- 15-64 years: 0.98 male(s)/female
- 65 years and over: 0.67 male(s)/female
- Total population: 0.98 male(s)/female (2015 est.)
Life expectancy at birth
- male: 51.9 years (2018 est.)
- female: 54.7 years (2018 est.)
Dependency ratios
- total dependency ratio: 90 (2015 est.)
- youth dependency ratio: 83.1 (2015 est.)
- elderly dependency ratio: 7 (2015 est.)
- potential support ratio: 14.4 (2015 est)
Contraceptive prevalence rate
- 15.2% (2010/11)
School life expectancy
- total: 7 years (2012)
- male: 8 years (2012)
- female: 6 years (2012)
HIV/AIDS
- Adult prevalence rate: 4.7% (2009 est.)
- People living with HIV/AIDS: 130,000 (2009 est.)
- Deaths: 11,000 (2010 est.)
Major infectious diseases
- Degree of risk: very high
- Food or waterborne diseases: bacterial and protozoal diarrhea, hepatitis A, and typhoid fever
- Vectorborne disease: malaria
- Respiratory disease: meningococcal meningitis
- Water contact disease: schistosomiasis
- Animal contact disease: rabies (2010)
Nationality
- Noun: Central African(s)
- Adjective: Central African
Ethnic groups
An approximate distribution of the ethnic groups is shown in the chart below:
| Ethnic group | Percentage | Population |
|---|---|---|
| Baggara Arabs | 2.4% | 107,000 |
| Baka | 0.5% | 20,000 |
| Banda | 27% | 1,190,700 |
| Bayaka | ? | ? |
| Fula | ? | ? |
| Gbaya | 33% | 1,300,000 |
| Kara | 2.3% | 100,000 |
| Kresh | ? | ? |
| Mbaka | 4% | 176,400 |
| Mandja | 13% | 573,300 |
| Ngbandi | ? | ? |
| Sara | 10% | 441,000 |
| Vidiri | ? | ? |
| Wodaabe | 2.3% | 100,000 |
| Yakoma | 4% | 176,400 |
| Yulu | ? | ? |
| Zande | 1.4% | 62,000 |
| Others | ? | ? |
Religions
- Indigenous beliefs 35%, Protestant 25%, Roman Catholic 25%, Islam 15%[8]
Literacy
- Definition: age 15 and over can read and write
- Total population: 51%
- Male: 63.3%
- Female: 39.9% (2010 est.)
Urbanization
- urban population: 41.4% of total population (2018)
- rate of urbanization: 2.52% annual rate of change (2015-20 est.)
References
| Wikimedia Commons has media related to Demographics of the Central African Republic. |
- ""World Population prospects – Population division"". population.un.org. United Nations Department of Economic and Social Affairs, Population Division. Retrieved November 9, 2019.
- ""Overall total population" – World Population Prospects: The 2019 Revision" (xslx). population.un.org (custom data acquired via website). United Nations Department of Economic and Social Affairs, Population Division. Retrieved November 9, 2019.
- Population Division of the Department of Economic and Social Affairs of the United Nations Secretariat, World Population Prospects: The 2010 Revision Archived May 6, 2011, at the Wayback Machine
- "MEASURE DHS: Demographic and Health Surveys". microdata.worldbank.org.
- "World Population Prospects - Population Division - United Nations". esa.un.org. Retrieved 2018-08-26.
- "Central African Republic Population 2019", World Population Review
- "The World FactBook - Central African Republic", The World Factbook, July 12, 2018
 This article incorporates text from this source, which is in the public domain.
 - "Africa: CENTRAL AFRICAN REPUBLIC". CIA The World Factbook.
![]() This article incorporates public domain material from the CIA World Factbook document: "2006 edition".
This article incorporates public domain material from the CIA World Factbook document: "2006 edition".