Demographics of Burundi
This article is about the demographic features of the population of Burundi, including population density, ethnicity, education level, health of the populace, economic status, religious affiliations and other aspects of the population.

At 206.1 persons per km²., Burundi has the second-largest population density in Sub-Saharan Africa. Most people live on farms near areas of fertile volcanic soil. The population is made up of three major ethnic groups – Hutu (Bahutu), Tutsi (Batutsi or Watusi), and Twa (Batwa). Kirundi is the common language. Intermarriage takes place frequently between the Hutus and Tutsis. The terms "pastoralist" and "agriculturist", often used as ethnic designations for Watusi and Bahutu, respectively, are only occupational titles which vary among individuals and groups. Although Hutus encompass the majority of the population, historically Tutsis have been politically and economically dominant.
Population
According to the 2019 revision of the World Population Prospects[1][2], the total population was 11,891,000 in 2020, compared to only 2 309 000 in 1950. The proportion of children below the age of 15 in 2020 was 45.3%, 52.4% were between 15 and 65 years of age, while 2.4% of the population was 65 years or older. .[3]
| Total population | Population aged 0–14 (%) | Population aged 15–64 (%) | Population aged 65+ (%) | |
|---|---|---|---|---|
| 1950 | 2 309 000 | 40.9 | 55.9 | 3.2 |
| 1955 | 2 537 000 | 42.4 | 54.5 | 3.1 |
| 1960 | 2 798 000 | 43.8 | 53.2 | 2.9 |
| 1965 | 3 094 000 | 45.3 | 51.8 | 3.0 |
| 1970 | 3 479 000 | 45.5 | 51.5 | 3.0 |
| 1975 | 3 701 000 | 45.4 | 51.3 | 3.3 |
| 1980 | 4 157 000 | 44.7 | 52.2 | 3.1 |
| 1985 | 4 751 000 | 46.2 | 50.9 | 3.0 |
| 1990 | 5 439 000 | 47.9 | 49.3 | 2.8 |
| 1995 | 5 987 000 | 50.3 | 47.1 | 2.5 |
| 2000 | 6 379 000 | 50.1 | 47.4 | 2.5 |
| 2005 | 7 365 000 | 47.0 | 50.7 | 2.3 |
| 2010 | 8 676 000 | 45.1 | 52.7 | 2.2 |
| 2015 | 10 160 000 | 45.5 | 52.4 | 2.1 |
| 2020 | 11 891 000 | 45.3 | 52.4 | 2.4 |
UN population projections
Numbers are in thousands. UN medium variant projections[3]
- 2020 11,891
- 2025 13,764
- 2030 15,773
- 2035 17,932
- 2040 20,253
- 2045 22,728
- 2050 25,325
Vital statistics
Registration of vital events is in Burundi not complete. The Population Departement of the United Nations prepared the following estimates. [3]
| Period | Live births per year | Deaths per year | Natural change per year | CBR* | CDR* | NC* | TFR* | IMR* |
|---|---|---|---|---|---|---|---|---|
| 1950-1955 | 121 000 | 61 400 | 59 600 | 50.0 | 25.4 | 24.6 | 6.80 | 166 |
| 1955-1960 | 130 000 | 63 800 | 66 200 | 48.8 | 24.0 | 24.8 | 6.86 | 157 |
| 1960-1965 | 142 600 | 66 400 | 76 200 | 48.4 | 22.5 | 25.9 | 7.05 | 149 |
| 1965-1970 | 158 000 | 69 400 | 88 600 | 48.0 | 21.1 | 26.9 | 7.23 | 140 |
| 1970-1975 | 171 400 | 73 800 | 97 600 | 47.7 | 20.5 | 27.2 | 7.26 | 136 |
| 1975-1980 | 197 400 | 76 000 | 121 400 | 50.2 | 19.4 | 30.9 | 7.40 | 132 |
| 1980-1985 | 229 000 | 82 400 | 146 600 | 51.4 | 18.5 | 32.9 | 7.38 | 117 |
| 1985-1990 | 261 000 | 87 400 | 173 600 | 51.2 | 17.1 | 34.1 | 7.46 | 104 |
| 1990-1995 | 273 800 | 100 200 | 173 600 | 47.9 | 17.5 | 30.4 | 7.30 | 111 |
| 1995-2000 | 271 000 | 101 600 | 169 400 | 43.8 | 16.4 | 27.4 | 7.05 | 103 |
| 2000-2005 | 294 400 | 92 200 | 202 200 | 42.8 | 13.4 | 29.4 | 6.77 | 88 |
| 2005-2010 | 346 000 | 90 000 | 256 000 | 43.1 | 11.2 | 31.9 | 6.39 | 70 |
| 2010-2015 | 397 400 | 86 600 | 310 800 | 42.2 | 9.2 | 33.0 | 5.95 | 52 |
| 2015-2020 | 432 800 | 88 600 | 344 200 | 39.3 | 8.0 | 31.2 | 5.45 | 42 |
| * CBR = crude birth rate (per 1000); CDR = crude death rate (per 1000); NC = natural change (per 1000; CBR-CDR); TFR = total fertility rate (number of children per woman); IMR = infant mortality rate per 1000 births | ||||||||
Fertility and births
Total Fertility Rate (TFR) (Wanted Fertility Rate) and Crude Birth Rate (CBR):[4][5] [6]
| Year | CBR (Total) | TFR (Total) | CBR (Urban) | TFR (Urban) | CBR (Rural) | TFR (Rural) |
|---|---|---|---|---|---|---|
| 1987 | 6.6 (5.3) | 5.2 (4.2) | 6.6 (5.4) | |||
| 2010 | 44.5 | 6.4 (4.2) | 37.3 | 4.8 (3.4) | 45.3 | 6.6 (4.3) |
| 2016-17 | 37.9 | 5.5 (3.6) | 33.0 | 4.1 (3.0) | 38.5 | 5.7 (3.7) |
Fertility data as of 2010 (DHS Program):[5] The fertility rate in the Bujumbura Mairie Province fell to 3.7 by 2016-2017; the other regions were not aggregated in the report, for easy reference and comparison to the below chart.[6] Per the 2016-2017 report, the average number of desired children in Burundi, nationwide, by both men and women of 15 to 49 years of age who are either paired up or married, is 4 children or less, and slightly less for men than for women. Per the report, this suggests an excess fecundity (more children than desired) of 1.8 children per couple nationwide; 1.1 in urban areas (where 3.0 children are desired, and the fertility rate is 4.1) and 2.0 in rural areas (where 3.7 children are desired and the fertility rate is 5.7). However, the number of desired children appears to be based on the lowest-desired rate - that of paired but unmarried men (3.7 children) rather than the highest (4.0, desired by married women) or even an overall average.[6]
| Region | Total fertility rate | Percentage of women age 15-49 currently pregnant | Mean number of children ever born to women age 40-49 |
|---|---|---|---|
| Bujumbura Mairie | 4.2 | 7.9% | 5.3 |
| Nord | 6.7 | 10.1% | 6.4 |
| Centre-Est | 6.3 | 10.5% | 6.6 |
| Ouest | 7.1 | 11.7% | 7.2 |
| Sud | 6.2 | 10.8% | 6.8 |
Life expectancy at Birth
| Period | Life expectancy in Years[7] |
|---|---|
| 1950–1955 | 39.03 |
| 1955–1960 | |
| 1960–1965 | |
| 1965–1970 | |
| 1970–1975 | |
| 1975–1980 | |
| 1980–1985 | |
| 1985–1990 | |
| 1990–1995 | |
| 1995–2000 | |
| 2000–2005 | |
| 2005–2010 | |
| 2010–2015 | |
| 2015–2020 |
Other demographic statistics
Demographic statistics according to the World Population Review in 2019.[8]
- One birth every 1 minutes
- One death every 5 minutes
- One net migrant every 144 minutes
- Net gain of one person every 1 minutes
The following demographic statistics are from the CIA World Factbook, unless otherwise indicated.[9]
Population
- 12,241,065 (July 2021 est.)
- 10,742,276 (July 2015 est.)
- Note: estimates for this country explicitly take into account the effects of excess mortality due to AIDS; this can result in lower life expectancy, higher infant mortality and death rates, lower population and growth rates, and changes in the distribution of population by age and sex than would otherwise be expected (July 2015 est.)
Age structure
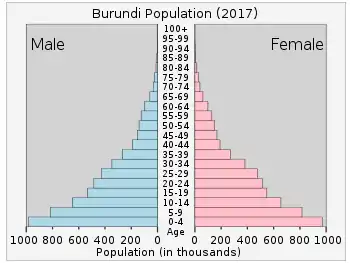
- 0-14 years: 43.83% (male 2,618,868/female 2,581,597)
- 15-24 years: 19.76% (male 1,172,858/female 1,171,966)
- 25-54 years: 29.18% (male 1,713,985/female 1,748,167)
- 55-64 years: 4.17% (male 231,088/female 264,131)
- 65 years and over: 3.06% (male 155,262/female 207,899) (2020 est.)
Median age
- Total: 17.7 years. Country comparison to the world: 217th
- Male: 17.4 years
- Female: 18.0 years (2020 est.)
- Total: 17.0 years
- Male: 16.8 years
- Female: 17.2 years (2015 est.)
Population growth rate
- 3.68% (2021 est.)
- 3.28% (2015 est.)
Total fertility rate
- 5.1 children born/woman (2021 est.)
Birth rate
- 35.48 births/1,000 population (2021 est.) Country comparison to the world: 16th
Death rate
- 6.07 deaths/1,000 population (2021 est.)
Net migration rate
- 7.35 migrant(s)/1,000 population (2021 est.)
- 4.04 migrant(s)/1,000 population (2009 est.)
Population distribution
One of Africa's most densely populated countries; concentrations tend to be in the north and along the northern shore of Lake Tanganyika in the west; most people live on farms near areas of fertile volcanic soil
Urbanization
- Urban population: 13.7% of total population (2020)
- Rate of urbanization: 5.68% annual rate of change (2015-20 est.)
Mother's mean age at first birth
- 21.3 years (2010 est.)
- note: median age at first birth among women 25-29
Sex ratio
- At birth: 1.03 male(s)/female
- Under 15 years: 1.01 male(s)/female
- 15-64 years: 0.98 male(s)/female
- 65 years and over: 0.87 male(s)/female
- Total population: 0.99 male(s)/female (2020 est.)
Life expectancy at birth
- Total population: 67.07 years Country comparison to the world: 150th
- male: 64.98 years
- female: 69.22 years (2021 est.)
- Total population: 60.9 years
- Male: 59.2 years
- Female: 62.7 years (2017 est.)
Dependency ratios
- Total dependency ratio: 91.0
- Youth dependency ratio: 86.4
- Elderly dependency ratio: 4.5
- Potential support ratio: 22.0 (2020 est.)
Contraceptive prevalence rate
- 28.5% (2016/17)
HIV/AIDS
- Adult prevalence rate: 1.2% (2019 est.) Country comparison to the world (37th)
- People living with HIV/AIDS: 85,000 (2019 est.)
- Deaths: 1,800 (2019 est.)
Children under the age of 5 years underweight
- 27.2% (2018/2019)
Major infectious diseases
- Degree of risk: very high
- Food or waterborne diseases: bacterial and protozoal diarrhea, hepatitis A, and typhoid fever
- Vectorborne disease: malaria and dengue fever
- Water contact disease: schistosomiasis
- Animal contact disease: rabies (2020)
Nationality
- Noun: Burundian(s)
- Adjective: Burundian
Religions
- Roman Catholic 62.1%, Protestant 23.9% (includes Adventist 2.3% and other Protestant 21.6%), Islam 2.5%, Other 3.6%, Unspecified 7.9% (2008 est.)
Languages
- Kirundi (official) only: 29.7%, French (official) only: 0.3%, Kirundi and French: 8.4%, Kurundi, French and English: 2.4%, Swahili only: 0.2%, other language combinations: 2%, unspecified: 56.9% (2008 est.)
- NOTE: Data represents only languages read and written by people 10 years of age or older; spoken Kirundi is nearly universal.
Literacy
- Definition: age 15 and over can read and write
- Total population: 68.4%
- Male: 76.3%
- Female: 61.2% (2017 est.)
Education expenditure
- 5.1% of GDP (2018)
References
| Wikimedia Commons has media related to Demographics of Burundi. |
- ""World Population prospects – Population division"". population.un.org. United Nations Department of Economic and Social Affairs, Population Division. Retrieved November 9, 2019.
- ""Overall total population" – World Population Prospects: The 2019 Revision" (xslx). population.un.org (custom data acquired via website). United Nations Department of Economic and Social Affairs, Population Division. Retrieved November 9, 2019.
- "Population Division of the Department of Economic and Social Affairs of the United Nations Secretariat, World Population Prospects: Data Query". Esa.un.org. Retrieved 2021-01-28.
- "Enquête Démographique et de Santé au Burundi 1987" (PDF). Dhsprogram.com. Retrieved 2017-08-27.
- "Enquête Démographique et de Santé au Burundi ABCD" (PDF). Dhsprogram.com. Retrieved 2017-08-27.
- "Troisième Enquête Démographique et de Santé du Burundi de 2016-2017". Dhsprogram.com. Retrieved 2017-08-27.
- "World Population Prospects - Population Division - United Nations". esa.un.org. Retrieved 2021-01-28.
- "Burundi Population 2019", World Population Review
- "The World FactBook - Burundi", The World Factbook, January 28, 2021
 This article incorporates text from this source, which is in the public domain.
 - "Africa :: BURUNDI". CIA The World Factbook. 2015 archived edition
![]() This article incorporates public domain material from the CIA World Factbook document: "2008 edition".
This article incorporates public domain material from the CIA World Factbook document: "2008 edition".