Demographics of Algeria
This article is about the demographic features of the population of Algeria, including population density, ethnicity, education level, health of the populace, economic status, religious affiliations and other aspects of the population.

.svg.png.webp)
Ninety-one percent of the Algerian population lives along the Mediterranean coast on 12% of the country's total land mass. Forty-five percent of the population is urban, and urbanization continues, despite government efforts to discourage migration to the cities. Currently, 24,182,736 Algerians live in urban areas, and about 1.5 millions nomads live in the Saharan area.
96% of the population follows Sunni Islam; the few non-Sunni Muslims are mainly Ibadis from the Mozabite valley at 1.3% and Shia Muslims (see Islam in Algeria).
Christianity in Algeria constitutes about 1% of the total population. While significantly greater during the French colonial years, a mostly foreign Roman Catholic community still exists, as do some Protestants. The Jewish community of Algeria, which once constituted 2% of the total population, has substantially decreased due to emigration, mostly to France and Israel.
Algeria's educational system has grown rapidly since 1962; in the last 12 years, attendance has doubled to more than 5 million students. Education is free and compulsory to age 16. Despite government allocation of substantial educational resources, population pressures and a serious shortage of teachers have severely strained the system, as have terrorist attacks against the educational infrastructure during the 1990s. Modest numbers of Algerian students study abroad, primarily in France and French-speaking Canada. In 2000, the government launched a major review of the country's educational system.
Housing and medicine continue to be pressing problems in Algeria. Failing infrastructure and the continued influx of people from rural to urban areas has overtaxed both systems. According to the UNDP, Algeria has one of the world's highest per housing unit occupancy rates for housing, and government officials have publicly stated that the country has an immediate shortfall of 1.5 million housing units.
Population
Vital statistics
| Year | Pop. | ±% p.a. |
|---|---|---|
| 1901 | 4,739,300 | — |
| 1906 | 5,231,700 | +2.00% |
| 1911 | 5,563,800 | +1.24% |
| 1921 | 5,804,200 | +0.42% |
| 1926 | 6,066,400 | +0.89% |
| 1931 | 6,553,500 | +1.56% |
| 1936 | 7,234,700 | +2.00% |
| 1948 | 8,681,800 | +1.53% |
| 2010 | 35,600,000 | +2.30% |
| 2011 | 36,300,000 | +1.97% |
| 2012 | 37,100,000 | +2.20% |
| 2013 | 37,900,000 | +2.16% |
| 2017 | 42,200,000 | +2.72% |
| Source: Office National des Statistiques (ONS)[1] | ||
Figures from National Office of Statistics Algeria,[2] United Nations Demographic Yearbook[3] and the CIA World Factbook:[4]
| Average population (1 January) | Live births | Deaths | Natural change | Crude birth rate (per 1000) | Crude death rate (per 1000) | Natural change (per 1000) | Total fertility rate | Male life expectancy | Female life expectancy | |
|---|---|---|---|---|---|---|---|---|---|---|
| 1966 | 13,123,000 | 667,000 | 50.8 | |||||||
| 1967 | 13,497,000 | 630,000 | 46.7 | |||||||
| 1968 | 13,887,000 | 618,000 | 44.5 | |||||||
| 1969 | 14,287,000 | 665,000 | 46.5 | |||||||
| 1970 | 14,691,000 | 689,000 | 46.9 | |||||||
| 1971 | 15,098,000 | 687,000 | 45.5 | |||||||
| 1972 | 15,512,000 | 697,000 | 44.9 | |||||||
| 1973 | 15,936,000 | 717,000 | 45.0 | |||||||
| 1974 | 16,375,000 | 722,000 | 44.1 | |||||||
| 1975 | 16,834,000 | 738,000 | 43.8 | |||||||
| 1976 | 17,311,000 | 751,000 | 43.4 | |||||||
| 1977 | 17,809,000 | 728,000 | 40.9 | |||||||
| 1978 | 18,331,000 | 767,000 | 41.9 | |||||||
| 1979 | 18,885,000 | 797,000 | 42.2 | |||||||
| 1980 | 19,475,000 | 819,000 | 42.0 | |||||||
| 1981 | 20,104,000 | 835,000 | 41.5 | |||||||
| 1982 | 20,767,000 | 852,000 | 41.0 | |||||||
| 1983 | 21,453,000 | 812,000 | 37.9 | |||||||
| 1984 | 22,150,000 | 850,000 | 38.4 | |||||||
| 1985 | 22,847,000 | 864,000 | 37.8 | |||||||
| 1986 | 23,539,000 | 781,000 | 33.2 | |||||||
| 1987 | 24,226,000 | 755,000 | 31.2 | |||||||
| 1988 | 24,905,000 | 806,000 | 32.4 | |||||||
| 1989 | 25,577,000 | 755,000 | 153,000 | 602,000 | 29.5 | |||||
| 1990 | 25,022,000 | 775,000 | 151,000 | 624,000 | 30.94 | 6.03 | 24.91 | 4.50 | ||
| 1991 | 25,643,000 | 773,000 | 155,000 | 618,000 | 30.1 | 6.0 | 24.1 | |||
| 1992 | 26,271,000 | 799,000 | 160,000 | 639,000 | 30.4 | 6.1 | 24.3 | |||
| 1993 | 26,894,000 | 775,000 | 168,000 | 607,000 | 28.8 | 6.2 | 22.6 | |||
| 1994 | 27,496,000 | 776,000 | 180,000 | 596,000 | 28.2 | 6.5 | 21.7 | |||
| 1995 | 28,060,000 | 711,000 | 180,000 | 531,000 | 25.3 | 6.4 | 18.9 | |||
| 1996 | 28,566,000 | 654,000 | 172,000 | 482,000 | 22.9 | 6.0 | 16.9 | |||
| 1997 | 29,045,000 | 654,000 | 178,000 | 476,000 | 22.5 | 6.1 | 16.4 | |||
| 1998 | 29,507,000 | 607,000 | 144,000 | 463,000 | 20.6 | 4.9 | 15.7 | |||
| 1999 | 29,965,000 | 593,643 | 141,000 | 452,643 | 19.8 | 4.7 | 15.1 | |||
| 2000 | 30,416,000 | 588,628 | 140,000 | 448,628 | 19.36 | 4.59 | 14.77 | 2.40 | ||
| 2001 | 30,879,000 | 618,380 | 141,000 | 477,380 | 20.0 | 4.6 | 15.5 | |||
| 2002 | 31,357,000 | 616,963 | 138,000 | 478,963 | 19.7 | 4.4 | 15.3 | |||
| 2003 | 31,848,000 | 649,000 | 145,000 | 504,000 | 20.4 | 4.6 | 15.8 | |||
| 2004 | 32,364,000 | 669,000 | 141,000 | 528,000 | 20.7 | 4.4 | 16.3 | |||
| 2005 | 32,906,000 | 703,000 | 147,000 | 556,000 | 21.4 | 4.5 | 16.9 | |||
| 2006 | 33,481,000 | 739,000 | 144,000 | 595,000 | 22.1 | 4.3 | 17.8 | |||
| 2007 | 34,096,000 | 783,000 | 149,000 | 634,000 | 23.0 | 4.4 | 18.6 | |||
| 2008 | 34,591,000 | 817,000 | 153,000 | 664,000 | 23.62 | 4.42 | 19.2 | 2.81 | ||
| 2009 | 35,268,000 | 849,000 | 159,000 | 690,000 | 24.07 | 4.51 | 19.56 | 2.84 | ||
| 2010 | 35,978,000 | 888,000 | 157,000 | 731,000 | 24.68 | 4.37 | 20.31 | 2.87 | ||
| 2011 | 36,717,000 | 910,000 | 162,000 | 748,000 | 24.78 | 4.41 | 20.37 | 2.87 | ||
| 2012 | 37,495,000 | 978,000 | 170,000 | 808,000 | 26.08 | 4.53 | 21.55 | 3.02 | 75.8 | 77.1 |
| 2013 | 38,297,000 | 963,000 | 168,000 | 795,000 | 25.14 | 4.39 | 20.75 | 2.93 | 76.5 | 77.6 |
| 2014[5] | 39,114,000 | 1,014,000 | 174,000 | 840,000 | 25.93 | 4.44 | 21.50 | 3.03 | 76.6 | 77.8 |
| 2015 | 39,963,000 | 1,040,285 | 182,570 | 857,715 | 26.03 | 4.57 | 21.50 | 3.10 | 76.4 | 77.8 |
| 2016 | 40,400,000 | 1,066,823 | 180,404 | 886,419 | 26.1 | 4.5 | 21.6 | 3.10 | 77.1 | 78.2 |
| 2017 | 41,300,000 | 1,060,000 | 190,000 | 870,000 | 25.4 | 4.6 | 20.8 | 3.06 | 76.9 | 78.2 |
| 2018 | 42,200,000 | 1,038,000 | 193,000 | 845,000 | 24.4 | 4.5 | 19.9 | 3.00 | 77.1 | 78.4 |
| 2019 | 43,000,000 | 1,034,000 | 198,000 | 837,000 | 23.8 | 4.6 | 19.2 | 3.0 | 77.2 | 78.6 |
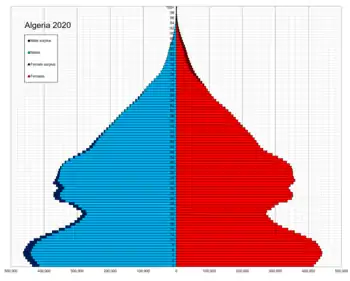
Age distribution
Population Estimates by Sex and Age Group (1.VII.2017):[6]
| Age Group | Male | Female | Total | % |
|---|---|---|---|---|
| Total | 21 118 894 | 20 576 732 | 41 695 626 | 100 |
| 0-4 | 2 537 210 | 2 400 525 | 4 937 735 | 11.84 |
| 5-9 | 2 155 222 | 2 034 306 | 4 189 528 | 10.05 |
| 10-14 | 1 672 925 | 1 583 253 | 3 256 178 | 7.81 |
| 15-19 | 1 513 910 | 1 449 966 | 2 963 876 | 7.11 |
| 20-24 | 1 728 672 | 1 662 960 | 3 391 633 | 8.13 |
| 25-29 | 1 887 412 | 1 837 618 | 3 725 030 | 8.93 |
| 30-34 | 1 891 310 | 1 868 670 | 3 759 980 | 9.02 |
| 35-39 | 1 672 000 | 1 638 996 | 3 310 996 | 7.94 |
| 40-44 | 1 322 807 | 1 314 955 | 2 637 762 | 6.33 |
| 45-49 | 1 128 564 | 1 141 789 | 2 270 354 | 5.45 |
| 50-54 | 957 002 | 964 127 | 1 921 129 | 4.61 |
| 55-59 | 764 232 | 765 395 | 1 529 628 | 3.67 |
| 60-64 | 623 980 | 613 837 | 1 237 817 | 2.97 |
| 65-69 | 464 950 | 452 674 | 917 624 | 2.20 |
| 70-74 | 288 205 | 304 720 | 592 925 | 1.42 |
| 75-79 | 237 094 | 252 360 | 489 454 | 1.17 |
| 80-84 | 156 185 | 171 174 | 327 360 | 0.79 |
| 85+ | 117 213 | 119 406 | 236 619 | 0.57 |
| Age group | Male | Female | Total | Percent |
|---|---|---|---|---|
| 0-14 | 6 365 357 | 6 018 084 | 12 383 441 | 29.70 |
| 15-64 | 13 489 890 | 13 258 314 | 26 748 204 | 64.15 |
| 65+ | 1 263 647 | 1 300 334 | 2 563 981 | 6.15 |
Life expectancy
| Period | Life expectancy in Years[7] |
|---|---|
| 1950–1955 | 42.89 |
| 1955–1960 | |
| 1960–1965 | |
| 1965–1970 | |
| 1970–1975 | |
| 1975–1980 | |
| 1980–1985 | |
| 1985–1990 | |
| 1990–1995 | |
| 1995–2000 | |
| 2000–2005 | |
| 2005–2010 | |
| 2010–2015 |
Cities
Below is a list of the most important Algerian cities:
Ethnic groups
Algerians are descendants from the Berbers, who are the indigenous ethnic group of Algeria and are believed to be the ancestral stock on which elements from the Phoenicians, Romans, Byzantines, Arabs, Turks as well as other ethnic groups have contributed to the ethnic makeup of Algeria.[9] Descendants of Andalusian refugees are also present in the population of Algiers and other cities.[10] Moreover, Spanish was spoken by these Aragonese and Castillian Morisco descendants deep into the 18th century, and even Catalan was spoken at the same time by Catalan Morisco descendants in the small town of Grish El-Oued.[11]

The majority of Algerians identify with an Arab-based identity due to the 20th century Arab nationalism.[12][13] The ethnic Berbers are divided into many groups with varying languages. The largest of these are the Kabyles, who live in the Kabylie region east of Algiers, the Chaoui of North-East Algeria, the Tuaregs in the southern desert and the Shenwa people of North Algeria.[14]
During the colonial period, there was a large (10% in 1960)[15] European population who became known as Pied-Noirs. They were primarily of French, Spanish and Italian origin. Almost all of this population left during the war of independence or immediately after its end.[16]
Religion
Islam is the predominant religion with 99% of the population.[4] There are about 150,000 Ibadis in the M'zab Valley in the region of Ghardaia.[17]
There were an estimated 10,000 Christians in Algeria in 2008.[18] In a 2009 study the UNO estimated there were 45,000 Catholics and 50,000–100,000 Protestants in Algeria.[19] A 2015 study estimates 380,000 Muslims converted to Christianity in Algeria.[20]
Following the Revolution and Algerian independence, all but 6,500 of the country's 140,000 Jews left the country, of whom about 90% moved to France with the Pied-Noirs and 10% moved to Israel.
Languages
.jpg.webp)
Arabic and Tamazight serve as both official languages and national languages in Algeria.[21][22]
Algerian Arabic (Algerian Dziriya or Darja) is the language used by the majority of the population. Colloquial Algerian Arabic is heavily infused with loanwords from Berber and French.
Although French has no official status, Algeria is the second-largest Francophone country in the world in terms of speakers,[23] and French is widely used in government, media (newspapers, radio, local television), and both the education system (from primary school onwards) and academia due to Algeria's colonial history. It can be regarded as the de facto co-official language of Algeria. In 2008, 11.2 million Algerians could read and write in French.[24] An Abassa Institute study in April 2000 found that 60% of households could speak and understand French. In recent decades the government has reinforced the study of French and TV programs have reinforced use of the language.
Algeria emerged as a bilingual state after 1962.[25] Colloquial Algerian Arabic is spoken by about 72% of the population and Berber by 27–30%.[26]
Spoken and popular languages
- Arabic language: 75% (dialectal Algerian Arabic including all dialects: Eastern, Western, Algiers dialect, Saharan)
- French: 70% (as a 2nd or 3rd language, spoken by both low and highly educated people)[27]
- Berber languages: 32.5% Chaouia, Kabyle, Tamahaq, Chenoua, Mozabite (Tumẓabt)
- English: 15% (as a 3rd language, spoken by highly educated people)
- Korandje language (Kwarandzyey): 0.01%
Official and recognized languages
- Modern Standard Arabic: official language of the state, as defined in the Algerian constitution. Classical Arabic can be read and written by about 69.9% of Algerians. The language is used in writing only, not in daily conversation.
- Berber language (Tamazight): official language of the state.[28]
Literacy
Definition: Age 15 and over can read and write
- Total population: 80.2%
- Male: 87.2%
- Female: 73.1% (2015 est.)
Education expenditures
- 14% of GDP (2015)
CIA World Factbook demographic statistics
The following demographic statistics are from the 2018 CIA World Factbook, unless otherwise indicated.[4]
Nationality
- Noun: Algerian(s)
- Adjective: Algerian
Population growth rate
- 1.63% (2018 est.) Country comparison to the world: 63rd
- 1.7% (2017 est.)
Median age
- total: 28.3 years. Country comparison to the world: 138th
- male: 28 years
- female: 28.7 years (2018 est.)
- total: 28.1 years
- male: 27.8 years
- female: 28.4 years (2017 est.)
- Total fertility rate
- 2.66 children born/woman (2018 est.) Country comparison to the world: 64th
- Birth rate
- 21.5 births/1,000 population (2018 est.) Country comparison to the world: 74th
- Death rate
- 4.3 deaths/1,000 population (2018 est.) Country comparison to the world: 205th
Net migration rate
- -0.9 migrant(s)/1,000 population (2017 est.) Country comparison to the world: 135th
- -0.28 migrant(s)/1,000 population (2010 est.)
- -0.27 migrant(s)/1,000 population (2012 est.)
Urbanization
- Urban population: 66% of total population (2010)
- Rate of urbanization: 2.5% annual rate of change (2005-10 est.)
- Rate of urbanization: 2.3% annual rate of change (2010-15 est.)
Sex ratio
- At birth: 1.05 male/female
- Under 15 years: 1.04 male/female
- 15–64 years: 1.02 male/female
- 65 years and over: 0.86 male/female
- Total population: 1.01 male/female (2012 est.)
Infant mortality rate
- Total: 27.73 deaths/1,000 live births
- Male: 30.86 deaths/1,000 live births
- Female: 24.45 deaths/1,000 live births (2009 est.)
- Total: 24.9 deaths/1,000 live births
- Male: 27.82 deaths/1,000 live births
- Female: 21.83 deaths/1,000 live births (2012 est.)
Life expectancy at birth
- Total population: 77 years
- Male: 75.6 years
- Female: 78.4 years (2017 est.)
HIV/AIDS
- Adult prevalence rate: 0.1% ; note - no country specific models provided (2001 est.)
- People living with HIV/AIDS: 21,000 (2007 est.)
- Deaths: less than 1000 (2007 est.)
Obesity rate
- Adult prevalence rate: 27.4% (2016 est.)
Major infectious diseases
- Degree of risk: intermediate
- Food or waterborne diseases: bacterial diarrhea, hepatitis A, and typhoid fever
- Vector borne disease: cutaneous leishmaniasis is a high risk in some locations (2005)
Genetics
Y-Dna haplogroup frequencies in coastal Algeria
| Population | Nb | E1a | E1b1a | E1b1b1a | E1b1b1b | E1b1b1c | F | K | J1 | J2 | R1a | R1b | Q | Study |
| 1 Oran | 102 | 0 | 7.85% | 5.90% | 45.10% | 0 | 0 | 0 | 22.50% | 4.90% | 1% | 11.80% | 1% | Robino et al. (2008)[29] |
| 2 Algiers | 35 | 2.85% | 0 | 11.40% | 42.85% | 0 | 11.80% | 2.85% | 22.85% | 5.70% | 0 | 0 | 0 | Arredi et al. (2004)[30] |
| 3 Tizi Ouzou | 19 | 0 | 0 | 0 | 47.35% | 10.50% | 10.50% | 0 | 15.80% | 0 | 0 | 15.80% | 0 | Arredi et al. (2004) |
| Total | 156 | 0.65% | 5.10% | 6.40% | 44.90% | 1.30% | 9.58% | 0.65% | 21.80% | 4.50% | 0.65% | 9.60% | 0.65% | |
In a recent genetic study by Semino et al. (2004), Algerian Arabs and Berbers were found to have more genetic similarities than was once believed.[31] This led scientists to conclude that the North African population was mainly Berber in origin and that the population had been 'Arabised', by the migration of Near-Eastener people.
The Haplogroup J, common marker in Middle-Eastern population is found at near 30% in Algeria, which is one of the most common haplogroup of the country along with E1b1b .
Recent studies on the common J1 Y chromosome suggest it arrived over ten thousand years ago in North Africa, and M81/E3b2 is a Y chromosome specific to North African ancestry, dating to the Neolithic. A thorough study by Arredi et al. (2004) which analyzed populations from Algeria concludes that the North African pattern of Y-chromosomal variation (including both E3b2 and J haplogroups is largely of Neolithic origin, which suggests that the Neolithic transition in this part of the world was accompanied by demic diffusion of Afro-Asiatic–speaking pastoralists from the Middle East. This Neolithic origin was later confirmed by Myles et al. (2005) which suggest that "contemporary Berber populations possess the genetic signature of a past migration of pastoralists from the Middle East",[32]
References
- Office National des Statistiques
- "National Office of Statistics". 9 June 2015. Archived from the original on 6 March 2012.
- "United Nations Statistics Division - Demographic and Social Statistics". unstats.un.org. Retrieved 9 June 2015.
- "The World Factbook – Africa – Algeria". CIA. Archived from the original on 3 January 2021. Retrieved 3 January 2021.
- "Archived copy". Archived from the original on 6 March 2012. Retrieved 19 January 2014.CS1 maint: archived copy as title (link)
- https://unstats.un.org/unsd/demographic-social/products/dyb/#statistics
- "World Population Prospects - Population Division - United Nations". esa.un.org. Archived from the original on 19 September 2016. Retrieved 26 August 2018.
- http://citypopulation.de/Algeria-Cities.html
- UNESCO (2009). "Diversité et interculturalité en Algérie" (PDF). UNESCO. p. 9. Archived from the original (PDF) on 25 July 2013.
- Ruedy, John Douglas (2005). Modern Algeria – The Origins and Development of a Nation. Indiana University Press. p. 22. ISBN 9780253217820.
- De Epalza, Mikel (2011). El español hablado en Túnez por los moriscos (siglos XVII-XVIII). Universitat de València. pp. 32–38–39–444. ISBN 9788437084152.
- Stokes, Jamie (2009). Encyclopedia of the Peoples of Africa and the Middle East: L to Z. Infobase Publishing. p. 21. ISBN 978-1-4381-2676-0.
- Oxford Business Group (2011). The Report: Algeria 2011. Oxford Business Group. p. 9. ISBN 978-1-907065-37-8.
- Marion Mill Preminger (1961). The sands of Tamanrasset: the story of Charles de Foucauld. Hawthorn Books.
- Cook, Bernard A. (2001). Europe since 1945: an encyclopedia. New York: Garland. p. 398. ISBN 978-0-8153-4057-7.
- De Azevedo, Raimond Cagiano (1994). Migration and Development Co-Operation. Council of Europe. p. 25. ISBN 9789287126115.
- "Ibadis and Kharijis". (via Angelfire). Retrieved 23 April 2010.
- "Algerian Christian converts fined". BBC News. 3 June 2008.
- Deeb, Mary Jane. "Religious minorities" Algeria (Country Study). Federal Research Division, Library of Congress; Helen Chapan Metz, ed. December 1993. This article incorporates text from this source, which is in the public domain.
- Believers in Christ from a Muslim Background: A Global Census
- "APS" (PDF). Algeria Press Service. Archived from the original (PDF) on 22 May 2016. Retrieved 1 January 2016.
- "Présentation de l'Algérie". French Ministry of Foreign and European Affairs. 23 October 2012. Retrieved 17 January 2013.
- "La mondialisation, une chance pour la francophonie". Senat.fr. Archived from the original on 13 May 2013. Retrieved 17 January 2013. () "L'Algérie, non-membre de l'Organisation internationale de la Francophonie, comptabilise la seconde communauté francophone au monde, avec environ 16 millions de locuteurs, suivie par la Côte d'Ivoire avec près de 12 millions de locuteurs francophones, le Québec avec 6 millions et la Belgique avec plus de 4 millions de francophones."
- "Le dénombrement des francophones" (PDF). Organisation internationale de la Francophonie. Archived from the original (PDF) on 12 October 2013. () p. 9 "Nous y agrégeons néanmoins quelques données disponibles pour des pays n’appartenant pas à l’OIF mais dont nous savons, comme pour l’Algérie (11,2 millions en 20081)," and "1. Nombre de personnes âgées de cinq ans et plus déclarant savoir lire et écrire le français, d’après les données du recensement de 2008 communiquées par l’Office national des statistiques d’Algérie."
- New, The (19 November 2008). "Algeria's liberation terrorism and Arabization". blogs.nytimes.com. Retrieved 17 January 2013.
- Leclerc, Jacques (5 April 2009). "Algérie: Situation géographique et démolinguistique". L'aménagement linguistique dans le monde (in French). Université Laval. Archived from the original on 24 January 2010. Retrieved 8 January 2010.
- fr:Langues en Algérie
- "APS" (PDF). Algeria Press Service. Archived from the original (PDF) on 22 May 2016. Retrieved 1 January 2016.
- Robino, C; Crobu, F; Di Gaetano, C; Bekada, A; Benhamamouch, S; Cerutti, N; Piazza, A; Inturri, S; Torre, C (2008). "Analysis of Y-chromosomal SNP haplogroups and STR haplotypes in an Algerian population sample". International Journal of Legal Medicine. 122 (3): 251–5. doi:10.1007/s00414-007-0203-5. PMID 17909833.
- Arredi et al. (2004),A Predominantly Neolithic Origin for Y-Chromosomal DNA Variation in North Africa
- Semino et al. (2004), Origin, Diffusion, and Differentiation of Y-Chromosome Haplogroups E and J Archived 2011-07-09 at the Wayback Machine
- although later papers have suggested that this date could have been as longas ten thousand years ago, with the transition from the Oranian to the Capsian culture in North Africa. SpringerLink - Journal Article
External links
| Wikimedia Commons has media related to Demographics of Algeria. |
- (ONS.dz) Official Demographics Statistics of Algeria
- Population cartogram of Algeria
- Unexpected developments in Maghrebian fertility
- and the As of 2003 U.S. Department of State website.
- Laouisset, Djamel (2009). A Retrospective Study of the Algerian Iron and Steel Industry. New York City: Nova Publishers. ISBN 978-1-61761-190-2.
![]() This article incorporates public domain material from the CIA World Factbook document: "2009 edition".
This article incorporates public domain material from the CIA World Factbook document: "2009 edition".
| Religions |
|
|---|---|
| Ethnic groups | |
| Languages | |