Demographics of Oklahoma
According to the U.S. Census Bureau, as of 2015, the state of Oklahoma has an estimated population of 3,911,338, which is an increase of 159,987 or 4.26% since the year 2010. Oklahoma is the 28th most populous state in the United States.
Population
| Historical population | |||
|---|---|---|---|
| Census | Pop. | %± | |
| 1890 | 258,657 | — | |
| 1900 | 790,391 | 205.6% | |
| 1910 | 1,657,155 | 109.7% | |
| 1920 | 2,028,283 | 22.4% | |
| 1930 | 2,396,040 | 18.1% | |
| 1940 | 2,336,434 | −2.5% | |
| 1950 | 2,233,351 | −4.4% | |
| 1960 | 2,328,284 | 4.3% | |
| 1970 | 2,559,229 | 9.9% | |
| 1980 | 3,025,290 | 18.2% | |
| 1990 | 3,145,585 | 4.0% | |
| 2000 | 3,450,654 | 9.7% | |
| 2010 | 3,751,351 | 8.7% | |
| 2019 (est.) | 3,956,971 | 5.5% | |
| Source: 1910-2010[1] | |||
The United States Census Bureau estimates that the population of Oklahoma was 3,911,338 on July 1, 2015, a 4.26% increase since the 2010 United States Census.[2]
According to the U.S. Census, as of 2010, Oklahoma has a historical estimated population of 3,751,351 which is an increase of 300,058 or 8.7 percent, since the year 2000.[3] Oklahoma ranks first in the Great Plains region in terms of population, followed by Kansas, Nebraska, South Dakota, and North Dakota. There has historically been a lot of German American, Irish American and English American immigration to what is now the state of Oklahoma.[4]
In the state, the population was spread out, with 24.8% under the age of 18, 10.2% from 18 to 24, 25.8% from 25 to 44, 25.8% from 45 to 64, and 13.5% who were 65 years of age or older. The median age was 36.2 years. For every 100 females there were 98.0 males. For every 100 females age 18 and over, there were 95.8 males.[5] There were 1,460,450 households, out of which 29.4% had children under the age of 18 living with them, 49.5% were married couples living together, 12.3% had a female householder with no husband present, and 33.2% were non-families. Of all households, 27.5% were made up of individuals, and 9.9% had someone living alone who was 65 years of age or older. The average household size was 2.49 and the average family size was 3.04.
It was estimated in 2010, that 5.5% of Oklahoma's residents, 206,382 were foreign born. Of them 31.9% were Naturalized US citizens and 68.1% were Not a US citizen.[6]
The median income for a household in the state was $42,072, and the median income for a family was $51,958 (these figures have risen to 44,287 and 55,296 respectively in 2011). The per capita income for the state was $22,254 (risen to 26,192). It was estimated that 16.9% (has decreased to 16.3%, in 2011)[7] of the population were below the poverty line. Out of the total population, 24.7% of those under the age of 18 and 15.4% of those 65 and older were living below the poverty line.[8]
As of 2010, about 81.1% of the state's civilian non-institutionalized population has health coverage with 61.8% with private insurance and 31.3% with public coverage. About 18.9% of the state's population has no health insurance coverage and 10.0% of all children 18 years and younger in Oklahoma have no health insurance.[8]
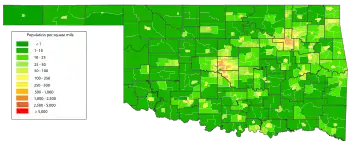
The center of population of Oklahoma is located at 35.598464 N, -96.836786 W, in Lincoln County near the town of Sparks.[9]
Ethnicity
According to the 2010 United States census, the racial and ethnic composition of Oklahoma was the following:[3][10][11]
- White: 65.3%
- Native American: 9.3%
- Black or African American: 7.8%
- Two or more races: 6.2%
- Asian: 2.3% (0.4% Vietnamese, 0.3% Indian, 0.2% Chinese, 0.2% Korean, 0.2% Filipino, 0.1% Hmong, 0.1% Japanese)
- Pacific Islander: 0.2%
Ethnically, the Hispanic or Latinos (of any race) make up 11% of the population. Major ancestry groups of the Hispanic population include: 7.1% Mexican, 0.3% Puerto Rican, 0.2% Spanish, 0.2% Guatemalan, 0.1% Salvadoran, 0.1% Cuban.
An estimated 7.4 percent of Oklahomans are African American. African Americans are a plurality in southeast Lawton, northeast Oklahoma City, northwest Tulsa, and portions of Muskogee. In Tulsa, prior to the Tulsa race massacre, the historic Black community of Greenwood was once prosperous enough to earn the nickname "the Black Wall Street" in the 1920s.[12][13]
In 2010, Oklahoma had the second-largest Native American population after California, with the highest concentration found in the Tulsa-Broken Arrow metropolitan area (8.3%). As a percentage of population, Oklahoma ranked fourth behind Alaska, New Mexico, and South Dakota with 8.57%.[14] This is largely the result of the Trail of Tears.
Asian Americans and Pacific Islanders are mostly concentrated in the Oklahoma City−Norman metropolitan area. Oklahoma City, Norman, and Edmond, which are located within Oklahoma and Cleveland counties have sizable Vietnamese and Indian communities, as well as a significant Korean community that is present there.[15] Oklahoma is also home to a large and growing Hmong (3369) and Burmese (1146) population, more than half of whom reside in the Tulsa-Broken Arrow metropolitan area.[16][17]
As of 2010, the largest ancestry groups in Oklahoma were:[18]
Cities and towns
Oklahoma had 598 incorporated places in 2010, including three cities over 100,000 in population and 40 over 10,000.[21] Two of the fifty largest cities in the United States are located in Oklahoma, Oklahoma City and Tulsa, and 58 percent of Oklahomans live within their metropolitan areas, or spheres of economic and social influence defined by the United States Census Bureau as a metropolitan statistical area. Oklahoma City, the state's capital and largest city, had the largest metropolitan area in the state in 2010, with 1,252,987 people, and the metropolitan area of Tulsa had 937,478 residents.[22]
Oklahoma's largest cities in 2010 were: Oklahoma City (579,999), Tulsa (391,906), Norman (110,925), Broken Arrow (98,850), Lawton (96,867), Edmond (81,405), Moore (55,081), Midwest City (54,371), Enid (49,379), and Stillwater (45,688). Between 2000 and 2010, the cities that led the state in population growth were Blanchard 172.4%, Elgin 78.2%, Piedmont 56.7%, Bixby 56.6%, and Owasso 56.3%.[21]
Age and finance
In 2000, 6.8% of Oklahoma's population was reported as under 5, 25.9% under 18, and 13.2% was 65 or older. Females made up approximately 50.9% of the population. The state has an above-average birth rate than most of the United States. Oklahoma has dealt with many socioeconomic issues, as the state's rank of annual household income is below national average and the state's poverty rate exceeds 15 percent, higher in rural areas. The state's 2000 per capita personal income was $23,517, 43rd in the nation. However, Oklahoma's cost of living index also among the lowest in the nation.[1] Oklahoma City suburb Nichols Hills is ranked first on Oklahoma locations by per capita income at $73,661.
Birth data
Note: Births in table don't add up, because Hispanics are counted both by their ethnicity and by their race, giving a higher overall number.
| Race | 2013[23] | 2014[24] | 2015[25] | 2016[26] | 2017[27] | 2018[28] |
|---|---|---|---|---|---|---|
| White | 40,619 (76.1%) | 40,258 (75.5%) | 40,143 (75.6%) | ... | ... | ... |
| > Non-Hispanic White | 33,978 (63.6%) | 33,577 (63.0%) | 33,293 (62.7%) | 30,499 (58.0%) | 28,976 (57.7%) | 28,444 (57.1%) |
| American Indian | 6,075 (11.4%) | 6,051 (11.3%) | 5,924 (11.1%) | 4,939 (9.4%) | 4,846 (9.7%) | 4,771 (9.6%) |
| Black | 5,092 (9.5%) | 5,296 (9.9%) | 5,293 (10.0%) | 4,394 (8.3%) | 4,085 (8.1%) | 4,136 (8.3%) |
| Asian | 1,583 (3.0%) | 1,734 (3.2%) | 1,762 (3.3%) | 1,377 (2.6%) | 1,328 (2.6%) | 1,306 (2.6%) |
| Hispanic (of any race) | 7,208 (13.5%) | 7,219 (13.5%) | 7,406 (13.9%) | 7,544 (14.3%) | 7,441 (14.8%) | 7,545 (15.2%) |
| Total Oklahoma | 53,369 (100%) | 53,339 (100%) | 53,122 (100%) | 52,592 (100%) | 50,214 (100%) | 49,800 (100%) |
- Since 2016, data for births of White Hispanic origin are not collected, but included in one Hispanic group; persons of Hispanic origin may be of any race.
References
- "Archived copy". Archived from the original on 2013-10-19. Retrieved 2012-12-24.CS1 maint: archived copy as title (link)
- "Annual Estimates of the Resident Population for the United States, Regions, States, and Puerto Rico: April 1, 2010 to July 1, 2015". 2015 Population Estimates. United States Census Bureau, Population Division. December 2015. Archived from the original (CSV) on December 23, 2015. Retrieved December 26, 2015.
- "Oklahoma". State & County QuickFacts. U.S. Census Bureau. Retrieved May 11, 2012.
- "DP-1 Profile of General Population and Housing Characteristics - Oklahoma". US Census Bureau. 2010. Archived from the original on 2020-02-12. Retrieved 2011-09-04.
- "QT-P1 Age Groups and Sex:2010 - Oklahoma". US Census Bureau. 2010. Archived from the original on 2020-02-12. Retrieved 2011-09-04.
- "Oklahoma - SELECTED SOCIAL CHARACTERISTICS IN THE UNITED STATES 2010 American Community Survey 1-Year Estimates". United States Census Bureau. 2010. Archived from the original on 2020-02-12. Retrieved 2011-10-06.
- "U.S. Census website". United States Census Bureau. Retrieved 2012-07-05.
- "Oklahoma SELECTED ECONOMIC CHARACTERISTICS 2010 American Community Survey 1-Year Estimates". US Census Bureau. 2010. Archived from the original on 2020-02-12. Retrieved 2011-10-07.
- "2010 Census Centers of Population by State". U.S. Census Bureau. 2010. Archived from the original on 2011-04-29. Retrieved 2011-09-17.
- Bureau, U.S. Census. "American FactFinder - Results". factfinder2.census.gov. Archived from the original on 2016-10-12.
- "Archived copy". Archived from the original on 2014-12-18. Retrieved 2016-05-07.CS1 maint: archived copy as title (link)
- "Race Alone or in Combination and Hispanic or Latino: 2010 All census tracks within Oklahoma". US Census Bureau. 2010. Archived from the original on 2020-02-10. Retrieved 2011-10-06.
- Encyclopedia of Oklahoma History and Culture. "Greenwood District". Retrieved 2011-10-06.
- "P1 Universal Total Population - All US States". US Census Bureau. 2010. Archived from the original on 2020-02-12. Retrieved 2011-10-06.
- "Race Alone or in Combination Oklahoma City". US Census Bureau. 2010. Archived from the original on 2020-02-12. Retrieved 2011-10-06.
- "Archived copy". Archived from the original on 2012-12-14. Retrieved 2012-12-04.CS1 maint: archived copy as title (link)
- "The spice of life". tulsapeople.com.
- Bureau, U.S. Census. "American FactFinder - Results". factfinder2.census.gov. Archived from the original on 2020-02-12.
- David Hackett Fischer, Albion's Seed: Four British Folkways in America, New York: Oxford University Press, 1989, pp.602–645
- Sharing the Dream: White Males in a Multicultural America By Dominic J. Pulera.
- Oklahoma Department of Commerce. "2000-2010 Oklahoma Incorporated Place Populations". Archived from the original (xls) on 2011-05-20. Retrieved 2011-10-09.
- "P1 Total Population All Metropolitan and Micropolitan Statistical Areas (or parts) within Oklahoma". US Census Bureau. 2010. Archived from the original on 2020-02-12. Retrieved 2011-10-09.
- https://www.cdc.gov/nchs/data/nvsr/nvsr64/nvsr64_01.pdf
- https://www.cdc.gov/nchs/data/nvsr/nvsr64/nvsr64_12.pdf
- https://www.cdc.gov/nchs/data/nvsr/nvsr66/nvsr66_01.pdf
- https://www.cdc.gov/nchs/data/nvsr/nvsr67/nvsr67_01.pdf
- https://www.cdc.gov/nchs/data/nvsr/nvsr67/nvsr67_08-508.pdf
- "Data" (PDF). www.cdc.gov. Retrieved 2019-12-21.
Oklahoma City (capital) | ||
| Topics |
|  |
| Society |
| |
| Regions | ||
| Largest cities | ||
| Counties |
| |