Stephens County, Oklahoma
Stephens County is a county located in the U.S. state of Oklahoma. As of the 2010 census, the population was 45,048.[1] Its county seat is Duncan.[2] The county was created at statehood, partly from the Chickasaw Nation in Indian Territory and partly from Comanche County in Oklahoma Territory. It was named for Texas politician John Hall Stephens.[3]
Stephens County | |
|---|---|
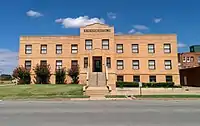
 Patterson Hospital in Duncan (2014) | |
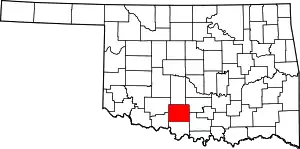
 Location within the U.S. state of Oklahoma | |
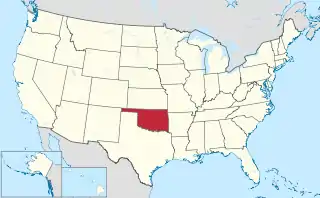
 Oklahoma's location within the U.S. | |
| Coordinates: 34°29′N 97°52′W | |
| Country | |
| State | |
| Founded | 1907 |
| Named for | John Hall Stephens |
| Seat | Duncan |
| Largest city | Duncan |
| Area | |
| • Total | 891 sq mi (2,310 km2) |
| • Land | 870 sq mi (2,300 km2) |
| • Water | 21 sq mi (50 km2) 2.4%% |
| Population (2010) | |
| • Total | 45,048 |
| • Estimate (2019) | 43,143 |
| • Density | 52/sq mi (20/km2) |
| Congressional district | 4th |
| Website | www |
Stephens County comprises the Duncan, OK Micropolitan Statistical Area.
History
Stephens County was created at statehood from portions of both Oklahoma Territory and Indian Territory. About two-thirds of the area came from Pickens County, Chickasaw Nation, in the Indian Territory,[4] and the western third came from Comanche County, Oklahoma Territory. The town of Duncan was designated as the county seat. County offices were located in rented facilities in Duncan until the first courthouse was built in 1921. That building was replaced by a new facility in 1967.[3]
Drilling for oil and gas began about 1910. The first production well did not come in until 1918. Production support activities soon followed. Erle P. Halliburton founded the Halliburton Oil Well Cementing Company in Duncan.[3] The company has since grown into a multinational corporation with headquarters in Dubai and Houston, Texas.
Geography
According to the U.S. Census Bureau, the county has a total area of 891 square miles (2,310 km2), of which 870 square miles (2,300 km2) is land and 21 square miles (54 km2) (2.4%) is water.[5] It lies within the Red Bed plains. Although there is no major river in the county, there are some creeks that provide drainage. Wildhorse Creek in the eastern part flows into the Washita River. Beaver Creek in the western part of the county flows into the Red River. Lakes in the county include Lake Humphreys, Clear Creek Lake, Duncan Lake, Comanche Lake, and Waurika Lake.[3]
Adjacent counties
- Grady County (north)
- Garvin County (northeast)
- Carter County (southeast)
- Jefferson County (south)
- Cotton County (southwest)
- Comanche County (northwest)
Demographics
| Historical population | |||
|---|---|---|---|
| Census | Pop. | %± | |
| 1910 | 22,252 | — | |
| 1920 | 24,692 | 11.0% | |
| 1930 | 33,069 | 33.9% | |
| 1940 | 31,090 | −6.0% | |
| 1950 | 34,071 | 9.6% | |
| 1960 | 37,990 | 11.5% | |
| 1970 | 35,902 | −5.5% | |
| 1980 | 43,419 | 20.9% | |
| 1990 | 42,299 | −2.6% | |
| 2000 | 43,182 | 2.1% | |
| 2010 | 45,048 | 4.3% | |
| 2019 (est.) | 43,143 | [6] | −4.2% |
| U.S. Decennial Census[7] 1790-1960[8] 1900-1990[9] 1990-2000[10] 2010-2019[1] | |||

As of the census[11] of 2000, there were 43,182 people, 17,463 households, and 12,590 families residing in the county. The population density was 19/km2 (49/mi2). There were 19,854 housing units at an average density of 9/km2 (23/mi2). The racial makeup of the county was 88.37% White, 2.20% Black or African American, 4.92% Native American, 0.30% Asian, 0.03% Pacific Islander, 1.44% from other races, and 2.74% from two or more races. 3.96% of the population were Hispanic or Latino of any race.
There were 17,463 households, out of which 30.40% had children under the age of 18 living with them, 59.50% were married couples living together, 9.20% had a female householder with no husband present, and 27.90% were non-families. 25.30% of all households were made up of individuals, and 12.80% had someone living alone who was 65 years of age or older. The average household size was 2.44 and the average family size was 2.91.
In the county, the population was spread out, with 24.60% under the age of 18, 7.80% from 18 to 24, 25.10% from 25 to 44, 24.00% from 45 to 64, and 18.50% who were 65 years of age or older. The median age was 40 years. For every 100 females there were 93.70 males. For every 100 females age 18 and over, there were 89.70 males.
The median income for a household in the county was $30,709, and the median income for a family was $36,371. Males had a median income of $30,428 versus $20,055 for females. The per capita income for the county was $16,357. About 11.60% of families and 14.60% of the population were below the poverty line, including 19.50% of those under age 18 and 11.90% of those age 65 or over.
Politics
| Voter Registration and Party Enrollment as of January 15, 2019[12] | |||||
|---|---|---|---|---|---|
| Party | Number of Voters | Percentage | |||
| Democratic | 8,981 | 33.81% | |||
| Republican | 13,991 | 52.67% | |||
| Others | 3,591 | 15.52% | |||
| Total | 26,563 | 100% | |||
| Year | Republican | Democratic | Third parties |
|---|---|---|---|
| 2016 | 79.2% 14,182 | 17.2% 3,086 | 3.6% 636 |
| 2012 | 76.6% 12,908 | 23.4% 3,939 | |
| 2008 | 76.0% 14,394 | 24.0% 4,538 | |
| 2004 | 71.2% 13,646 | 28.8% 5,515 | |
| 2000 | 62.1% 10,860 | 37.0% 6,467 | 0.9% 161 |
| 1996 | 45.8% 8,144 | 40.8% 7,248 | 13.4% 2,384 |
| 1992 | 34.6% 7,085 | 37.3% 7,644 | 28.1% 5,742 |
| 1988 | 55.3% 9,844 | 44.0% 7,833 | 0.7% 118 |
| 1984 | 66.6% 12,871 | 32.9% 6,359 | 0.5% 103 |
| 1980 | 57.1% 10,199 | 40.3% 7,191 | 2.6% 462 |
| 1976 | 41.7% 7,099 | 57.6% 9,795 | 0.7% 126 |
| 1972 | 71.6% 10,309 | 25.2% 3,623 | 3.2% 464 |
| 1968 | 38.5% 5,508 | 36.7% 5,249 | 24.9% 3,566 |
| 1964 | 36.5% 5,323 | 63.5% 9,272 | |
| 1960 | 54.0% 8,084 | 46.1% 6,899 | |
| 1956 | 45.7% 6,324 | 54.3% 7,524 | |
| 1952 | 44.6% 6,461 | 55.4% 8,029 | |
| 1948 | 22.2% 1,909 | 77.8% 6,702 | |
| 1944 | 30.8% 2,766 | 69.0% 6,189 | 0.2% 19 |
| 1940 | 32.6% 2,989 | 67.0% 6,149 | 0.4% 34 |
| 1936 | 20.3% 1,636 | 79.2% 6,390 | 0.6% 45 |
| 1932 | 11.6% 1,012 | 88.4% 7,706 | |
| 1928 | 62.7% 5,192 | 36.0% 2,982 | 1.3% 105 |
| 1924 | 31.6% 2,377 | 63.0% 4,745 | 5.5% 412 |
| 1920 | 39.2% 2,035 | 54.2% 2,816 | 6.7% 346 |
| 1916 | 15.0% 607 | 57.9% 2,343 | 27.1% 1,098 |
| 1912 | 18.4% 598 | 53.4% 1,735 | 28.2% 915 |
Communities
Towns
Village
Census-designated place
References
- "State & County QuickFacts". United States Census Bureau. Retrieved November 13, 2013.
- "Find a County". National Association of Counties. Retrieved June 7, 2011.
- Wilson, Linda D. Encyclopedia of Oklahoma History and Culture. "Stephens County." Retrieved September 21, 2013.
- Charles Goins, Historical Atlas of Oklahoma (Norman: University of Oklahoma Press, 2006), plate 105.
- "2010 Census Gazetteer Files". United States Census Bureau. August 22, 2012. Retrieved February 22, 2015.
- "County Population Totals: 2010-2019". Retrieved January 11, 2021.
- "U.S. Decennial Census". United States Census Bureau. Retrieved February 22, 2015.
- "Historical Census Browser". University of Virginia Library. Retrieved February 22, 2015.
- Forstall, Richard L., ed. (March 27, 1995). "Population of Counties by Decennial Census: 1900 to 1990". United States Census Bureau. Retrieved February 22, 2015.
- "Census 2000 PHC-T-4. Ranking Tables for Counties: 1990 and 2000" (PDF). United States Census Bureau. April 2, 2001. Retrieved February 22, 2015.
- "U.S. Census website". United States Census Bureau. Retrieved January 31, 2008.
- "Oklahoma Registration Statistics by County" (PDF). OK.gov. January 15, 2019. Retrieved February 27, 2019.
- Leip, David. "Dave Leip's Atlas of U.S. Presidential Elections". uselectionatlas.org. Retrieved March 30, 2018.
