Payne County, Oklahoma
Payne County is located in the U.S. state of Oklahoma. As of the 2010 census, the population was 77,350.[1] Its county seat is Stillwater.[2] The county was created in 1890 as part of Oklahoma Territory and is named for Capt. David L. Payne, a leader of the "Boomers".[3]
Payne County | |
|---|---|
.jpg.webp) | |
 Seal | |
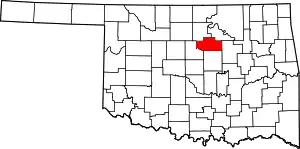 Location within the U.S. state of Oklahoma | |
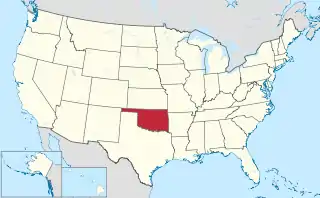 Oklahoma's location within the U.S. | |
| Coordinates: 36°05′N 96°58′W | |
| Country | |
| State | |
| Founded | May 2, 1890 |
| Named for | Capt. David L. Payne |
| Seat | Stillwater |
| Largest city | Stillwater |
| Area | |
| • Total | 697 sq mi (1,810 km2) |
| • Land | 685 sq mi (1,770 km2) |
| • Water | 12 sq mi (30 km2) |
| Population (2010) | |
| • Total | 77,350 |
| • Estimate (2019) | 81,784 |
| • Density | 113/sq mi (44/km2) |
| Time zone | UTC−6 (Central) |
| • Summer (DST) | UTC−5 (CDT) |
| Congressional district | 3rd |
| Website | www |
Payne County comprises the Stillwater, OK Micropolitan Statistical Area. The county lies northeast of the Oklahoma City metropolitan area although some consider it an extension of the Oklahoma City metro area due to commuter patterns and other indicators.
History
This county was established and named as the Sixth County by the Oklahoma Organic Act of 1890. It included land settled during the Land Run of 1889. The Organic Act settled a dispute between the towns of Stillwater and Perkins over which should be the county seat.[4]
Eastern Oklahoma Railway built two lines in Payne County between 1900 and 1902, then immediately leased them to the Atchison, Topeka and Santa Fe Railway. The historic civil townships of the county were abolished by 1930. One north–south line ran between Pawnee, Stillwater, Ripley and Cushing before joining another north–south line that from Newark to Shawnee. Another line was built from Guthrie along the Cimarron River to Ripley. These lines were important in getting crops from farm to market.[4]
In 2010, the Keystone-Cushing Pipeline (Phase II) was constructed into Payne County.
Geography
According to the U.S. Census Bureau, the county has a total area of 697 square miles (1,810 km2), of which 685 square miles (1,770 km2) is land and 12 square miles (31 km2) (1.8%) is water.[5]
Payne County is covered by rolling plains, mostly within the Sandstone Hills physiographic region, but with the western part of the county in the Red Bed plains. The county has two significant reservoirs: Lake McMurtry and Lake Carl Blackwell. The Cimarron River and Stillwater Creek drain most of the county.[4]
Major highways
.svg.png.webp) Interstate 35
Interstate 35 U.S. Highway 177
 U.S. Highway 412
 State Highway 18
 State Highway 33
 State Highway 51
 State Highway 86
 State Highway 99
 State Highway 108
Airports
- KSWO - Stillwater Regional Airport, Commercial service to Dallas via American Airlines
- KCUH - Cushing Municipal Airport
Adjacent counties
- Noble County (northwest)
- Pawnee County (northeast)
- Creek County (east)
- Lincoln County (south)
- Logan County (southwest)
Demographics
| Historical population | |||
|---|---|---|---|
| Census | Pop. | %± | |
| 1890 | 7,215 | — | |
| 1900 | 20,909 | 189.8% | |
| 1910 | 23,735 | 13.5% | |
| 1920 | 30,180 | 27.2% | |
| 1930 | 36,905 | 22.3% | |
| 1940 | 36,057 | −2.3% | |
| 1950 | 46,430 | 28.8% | |
| 1960 | 44,231 | −4.7% | |
| 1970 | 50,654 | 14.5% | |
| 1980 | 62,435 | 23.3% | |
| 1990 | 61,507 | −1.5% | |
| 2000 | 68,190 | 10.9% | |
| 2010 | 77,350 | 13.4% | |
| 2019 (est.) | 81,784 | [6] | 5.7% |
| U.S. Decennial Census[7] 1790-1960[8] 1900-1990[9] 1990-2000[10] 2010-2019[1] | |||

As of the census[11] of 2000, there were 68,190 people, 26,680 households, and 15,314 families residing in the county. The population density was 99 people per square mile (38/km2). There were 29,326 housing units at an average density of 43 per square mile (16/km2). The racial makeup of the county was 84.33% White, 3.63% Black or African American, 4.58% Native American, 3.00% Asian, 0.04% Pacific Islander, 0.77% from other races, and 3.64% from two or more races. 2.15% of the population were Hispanic or Latino of any race.
There were 26,680 households, out of which 25.90% had children under the age of 18 living with them, 45.60% were married couples living together, 8.30% had a female householder with no husband present, and 42.60% were non-families. 30.10% of all households were made up of individuals, and 8.10% had someone living alone who was 65 years of age or older. The average household size was 2.29 and the average family size was 2.90.
In the county, the population was spread out, with 19.60% under the age of 18, 25.90% from 18 to 24, 26.20% from 25 to 44, 17.60% from 45 to 64, and 10.80% who were 65 years of age or older. The median age was 28 years. For every 100 females, there were 103.30 males. For every 100 females age 18 and over, there were 102.60 males.
The median income for a household in the county was $28,733, and the median income for a family was $40,823. Males had a median income of $31,132 versus $21,113 for females. The per capita income for the county was $15,983. About 10.80% of families and 20.30% of the population were below the poverty line, including 16.00% of those under age 18 and 8.50% of those age 65 or over.
Politics
| Voter Registration and Party Enrollment as of January 15, 2019[12] | |||||
|---|---|---|---|---|---|
| Party | Number of Voters | Percentage | |||
| Democratic | 13,074 | 32.55% | |||
| Republican | 20,139 | 50.14% | |||
| Others | 6,952 | 16.65% | |||
| Total | 40,165 | 100% | |||
| Year | Republican | Democratic | Third parties |
|---|---|---|---|
| 2020 | 60.1% 17,813 | 36.8% 10,904 | 3.1% 926 |
| 2016 | 60.0% 16,651 | 31.7% 8,788 | 8.4% 2,321 |
| 2012 | 64.2% 16,481 | 35.8% 9,198 | |
| 2008 | 63.5% 18,435 | 36.5% 10,601 | |
| 2004 | 66.0% 19,560 | 34.1% 10,101 | |
| 2000 | 61.2% 15,256 | 37.4% 9,319 | 1.5% 372 |
| 1996 | 48.1% 11,686 | 41.1% 9,985 | 10.9% 2,637 |
| 1992 | 42.2% 13,032 | 32.0% 9,886 | 25.8% 7,962 |
| 1988 | 59.6% 16,027 | 39.3% 10,568 | 1.2% 310 |
| 1984 | 72.6% 20,811 | 26.7% 7,653 | 0.6% 184 |
| 1980 | 62.1% 15,955 | 29.1% 7,466 | 8.8% 2,270 |
| 1976 | 56.4% 13,481 | 41.8% 9,987 | 1.8% 420 |
| 1972 | 73.8% 17,019 | 24.5% 5,644 | 1.8% 407 |
| 1968 | 53.7% 9,577 | 32.4% 5,772 | 13.9% 2,475 |
| 1964 | 47.1% 7,936 | 52.9% 8,906 | |
| 1960 | 63.6% 9,943 | 36.4% 5,694 | |
| 1956 | 59.8% 9,381 | 40.3% 6,320 | |
| 1952 | 62.0% 10,605 | 38.0% 6,490 | |
| 1948 | 44.0% 5,799 | 56.0% 7,390 | |
| 1944 | 51.7% 6,048 | 48.1% 5,624 | 0.3% 30 |
| 1940 | 46.6% 6,772 | 53.0% 7,704 | 0.4% 63 |
| 1936 | 37.0% 4,783 | 62.5% 8,081 | 0.4% 57 |
| 1932 | 33.1% 3,874 | 66.9% 7,819 | |
| 1928 | 72.2% 7,864 | 26.7% 2,904 | 1.2% 125 |
| 1924 | 48.5% 4,817 | 43.7% 4,342 | 7.8% 774 |
| 1920 | 54.8% 4,583 | 38.7% 3,238 | 6.6% 549 |
| 1916 | 36.7% 1,767 | 44.5% 2,140 | 18.8% 902 |
| 1912 | 41.7% 1,669 | 38.3% 1,534 | 20.1% 804 |
Economy
Agriculture was the basis of the county economy for more than fifty years. The primary crops were cotton, corn and wheat.[4]
World War II caused hundreds of students at Oklahoma A & M to leave school for military service. To offset this loss to the local economy, civic and college leaders lobbied military officials and Oklahoma Senator Mike Monroney to have the school designated as a war training center. This resulted in the establishment of twelve training programs for the Navy, with nearly 40,000 people.[4] The wartime experience showed local political leaders that it would be essential to diversify the county's economic base. They formed an Industrial Foundation to attract manufacturing plants and industrial jobs. This effort succeeded and accelerated an increase in population.[4]
Education

Educational entities located in Payne County include:
Communities
Cities
- Cushing
- Perkins
- Stillwater (county seat)
- Yale
NRHP sites
The following sites in Payne County are listed on the National Register of Historic Places:
|
Other landmarks include:
- Allen Williamson Bridge - Memorial bridge near Ripley, named after the Oklahoma Representative Allen Williamson.
References
- "State & County QuickFacts". United States Census Bureau. Archived from the original on July 16, 2011. Retrieved November 12, 2013.
- "Find a County". National Association of Counties. Archived from the original on May 31, 2011. Retrieved June 7, 2011.
- Chronicles of Oklahoma. "Origin of County Names in Oklahoma." v. 2, N, 1. March 1924. Retrieved May 26, 2013. Archived January 23, 2014, at the Wayback Machine
- Newsom, D. Earl. "Payne County," Encyclopedia of Oklahoma History and Culture, Oklahoma Historical Society, 2009. Accessed April 4, 2015.
- "2010 Census Gazetteer Files". United States Census Bureau. August 22, 2012. Retrieved February 22, 2015.
- "County Population Totals: 2010-2019". Retrieved July 24, 2020.
- "U.S. Decennial Census". United States Census Bureau. Retrieved February 22, 2015.
- "Historical Census Browser". University of Virginia Library. Retrieved February 22, 2015.
- Forstall, Richard L., ed. (March 27, 1995). "Population of Counties by Decennial Census: 1900 to 1990". United States Census Bureau. Retrieved February 22, 2015.
- "Census 2000 PHC-T-4. Ranking Tables for Counties: 1990 and 2000" (PDF). United States Census Bureau. April 2, 2001. Retrieved February 22, 2015.
- "U.S. Census website". United States Census Bureau. Retrieved January 31, 2008.
- "Oklahoma Registration Statistics by County" (PDF). OK.gov. January 15, 2019. Retrieved February 27, 2019.
- Leip, David. "Dave Leip's Atlas of U.S. Presidential Elections". uselectionatlas.org. Retrieved March 29, 2018.
External links
- Payne County Government's website
- Oklahoma Digital Maps: Digital Collections of Oklahoma and Indian Territory
Places adjacent to Payne County, Oklahoma | ||||||||||
|---|---|---|---|---|---|---|---|---|---|---|
| ||||||||||
Municipalities and communities of Payne County, Oklahoma, United States | ||
|---|---|---|
| Cities | Map of Oklahoma highlighting Payne County | |
| Towns | ||
| Unincorporated communities | ||
| Ghost town | ||
| Footnotes | ‡This populated place also has portions in an adjacent county or counties | |
| ||
Oklahoma City (capital) | ||
| Topics |
|  |
| Society |
| |
| Regions | ||
| Largest cities | ||
| Counties |
| |
| Authority control |
|---|