Demographics of Minnesota
The United States Census Bureau counted Minnesota's population at 5,303,925 in the 2010 Census.[3]
| Historical population | |||
|---|---|---|---|
| Census | Pop. | %± | |
| 1850 | 6,077 | — | |
| 1860 | 172,023 | 2,730.7% | |
| 1870 | 439,706 | 155.6% | |
| 1880 | 780,773 | 77.6% | |
| 1890 | 1,310,283 | 67.8% | |
| 1900 | 1,751,394 | 33.7% | |
| 1910 | 2,075,708 | 18.5% | |
| 1920 | 2,387,125 | 15.0% | |
| 1930 | 2,563,953 | 7.4% | |
| 1940 | 2,792,300 | 8.9% | |
| 1950 | 2,982,483 | 6.8% | |
| 1960 | 3,413,864 | 14.5% | |
| 1970 | 3,804,971 | 11.5% | |
| 1980 | 4,075,970 | 7.1% | |
| 1990 | 4,375,099 | 7.3% | |
| 2000 | 4,919,479 | 12.4% | |
| 2010 | 5,303,925 | 7.8% | |
| 2019 (est.) | 5,639,632 | 6.3% | |
| Source: 1910–2010[1] 2018 estimate[2] | |||
Population
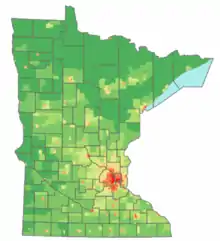
From fewer than 6,100 people in 1850, Minnesota's population grew to over 1.75 million by 1900. Each of the next six decades saw a 15.0% rise in population, reaching 3.41 million in 1960. Growth then slowed, rising 11.0% to 3.8 million in 1970, and an average of 9.0% over the next three decades to 4.91 million in the 2000 census.[4] The rate of population change, and age and gender distributions, approximate the national average. Minnesota's growing minority groups, however, still form a significantly smaller proportion of the population than in the nation as a whole.[5] The center of population of Minnesota is located in Hennepin County, in the city of Rogers.[6]
The population distribution by age in the 2005–2007 American Community Survey was:
- Under 5 years: 6.7%
- 5–9 years: 6.5%
- 10–14 years: 6.9%
- 15–19 years: 7.3%
- 20–24 years: 7.0%
- 25–34 years: 13.0%
- 35–44 years: 14.7%
- 45–54 years: 15.3%
- 55–59 years: 6.0%
- 60–64 years: 4.4%
- 65–74 years: 6.0%
- 75–84 years: 4.3%
- 85 years and over: 1.9%
The median age was 36.9 years. Approximately 60.0% of the state's population lives within the Minneapolis-St. Paul metropolitan area and 40.0% in the remainder of the state. This is a result of the migration of jobs from farming, mining, and logging, prevalent in the 19th century, to the current concentration in professional, office, and service jobs, concentrated in the metropolitan areas.
Most populous counties
The 20 most populous counties (2018)[7]
| 2018 Rank | County | Seat City | 2010 Census | 2018 Estimate | % Gain since 2010 |
|---|---|---|---|---|---|
| 1 | Hennepin | Minneapolis | 1,152,425 | 1,259,428 | +9.29% |
| 2 | Ramsey | Saint Paul | 508,640 | 550,210 | +8.17% |
| 3 | Dakota | Hastings | 398,552 | 425,423 | +6.74% |
| 4 | Anoka | Anoka | 330,844 | 353,813 | +6.94% |
| 5 | Washington | Stillwater | 238,136 | 259,201 | +8.85% |
| 6 | St. Louis | Duluth | 200,226 | 199,754 | −0.24% |
| 7 | Stearns | St. Cloud | 150,642 | 159,256 | +5.72% |
| 8 | Olmsted | Rochester | 144,248 | 156,277 | +8.34% |
| 9 | Scott | Shakopee | 129,928 | 147,381 | +13.43% |
| 10 | Wright | Buffalo | 124,700 | 136,349 | +9.34% |
| 11 | Carver | Chaska | 91,042 | 103,551 | +13.74% |
| 12 | Sherburne | Elk River | 88,499 | 96,036 | +8.52% |
| 13 | Blue Earth | Mankato | 64,013 | 67,427 | +5.33% |
| 14 | Rice | Faribault | 64,142 | 66,523 | +3.71% |
| 15 | Crow Wing | Brainerd | 62,500 | 64,889 | +3.82% |
| 16 | Clay | Moorhead | 58,999 | 63,955 | +8.40% |
| 17 | Otter Tail | Fergus Falls | 57,303 | 58,812 | +2.63% |
| 18 | Chisago | Center City | 53,887 | 55,922 | +3.78% |
| 19 | Winona | Winona | 51,461 | 50,825 | −1.24% |
| 20 | Beltrami | Bemidji | 44,442 | 46,847 | +5.41% |
Ancestry
Over 85.0% of Minnesota's residents are of European descent, with the largest reported ancestries being German (38.6%), Norwegian (17.0%), Irish (11.9%), and Swedish (9.8%). The Hispanic population of Minnesota is increasing, much like in other parts of the United States[8] and recent immigrants have come from all over the world, including Hmong,[9] Somalis, Vietnamese, and emigrants from the former Soviet bloc.
| Racial composition | 1990[10] | 2000[11] | 2010[12] |
|---|---|---|---|
| White | 94.4% | 89.4% | 85.3% |
| Black | 2.2% | 3.5% | 5.2% |
| Asian | 1.8% | 2.9% | 4.0% |
| Native | 1.1% | 1.1% | 1.2% |
| Native Hawaiian and other Pacific Islander | - | - | - |
| Other race | 0.5% | 1.3% | 1.9% |
| Two or more races | - | 1.7% | 2.4% |
Immigration
Immigration to Minnesota was fueled by the efforts of railroad companies and civic boosters who published books explaining Minnesota's virtues. New Minnesotans also sent letters back to the "old country" explaining the new hope and prosperity they had found in Minnesota. The first major wave of immigration, in the 1860s and 1870s, was primarily from Germany[13] and Ireland, and most settlers moved to farming areas in the central and southern regions of the state. Germans composed the largest immigrant group to Minnesota. When World War I started, 70% of the population was either foreign-born or had at least one parent born outside the United States. Of that number, more than one fourth were Germans. New Ulm, Saint Cloud, and Shakopee were particular centers of German immigration. Scandinavians from Norway, Sweden, and Denmark, as well as immigrants from the Nordic country of Finland soon followed, but they tended to settle in distinctive communities of Norwegian, Swedish, Danish, and Finnish groups instead of common Scandinavian or Nordic communities. Irish immigrants were the fourth largest group after the Germans, Swedes, and Norwegians, many of whom came as a result of the Great Famine. Others were encouraged to immigrate by Archbishop John Ireland. The Irish concentrated in Saint Paul. Later, southern and eastern Europeans from Italy, Slovenia, Poland, and Czecho-Slovakia became the dominant group immigrating to the United States, and they tended to settle in the Twin Cities, Duluth, and the Iron Range. The Mesabi Range was especially popular among southeastern Europeans, particularly Slovenians and other Slavic immigrants living under the Austrian Empire, who found employment in the iron mines. With extraordinary encouragement from Walter Mondale, Hmong and Vietnamese immigrants started to come to Minnesota around the mid-1970s as the pro-American governments in their home countries collapsed.[14][15] Many came through VOLAGS contracted with the State Department, who helped them settle in.[16] As of the 2015 American Community Survey, there are a number residents from Laos and Thailand in the state, which include individuals of Hmong ancestry.[17]
In the mid-1990s, Somali immigrants began to settle in the United States as political turmoil occurred in Somalia; Minnesota became one of the prime destinations. In 2002, official estimates put the population at around 15,000 residents.[18] Many came through VOLAGS, who helped them settle in.[16] As of the 2015 American Community Survey, there are 57,000 residents in the state who are of Somali ancestry.[17]
One of the fastest growing immigrant groups in Minnesota is the Karen people, an ethnic minority in conflict with the government in Myanmar. Most of the estimated 5,000 Karen in Minnesota came from refugee camps in Thailand.[19] Many arrived through VOLAGS, who helped them settle in.[16]
As of the 2015 American Community Survey, the largest foreign-born groups in Minnesota are from Mexico (67,300), Somalia (31,400), India (30,500), Laos including Hmong (23,300), Vietnam (20,200), China excluding Hong Kong and Taiwan (19,900), Ethiopia (19,300), and Thailand including Hmong (16,800).[17]
Birth data
Note: Births in table don't add up, because Hispanics are counted both by their ethnicity and by their race, giving a higher overall number.
| Race | 2013[20] | 2014[21] | 2015[22] | 2016[23] | 2017[24] | 2018[25] |
|---|---|---|---|---|---|---|
| White: | 54,670 (79.0%) | 54,774 (78.3%) | 54,407 (77.9%) | ... | ... | ... |
| > Non-Hispanic White | 50,238 (72.6%) | 50,332 (72.0%) | 49,673 (71.1%) | 48,534 (69.6%) | 47,088 (68.6%) | 46,014 (68.3%) |
| Black | 7,650 (11.1%) | 8,033 (11.5%) | 8,353 (12.0%) | 7,781 (11.1%) | 8,163 (11.9%) | 8,207 (12.2%) |
| Asian | 5,381 (7.8%) | 5,669 (8.1%) | 5,659 (8.1%) | 5,367 (7.7%) | 5,323 (7.8%) | 5,298 (7.9%) |
| American Indian | 1,458 (2.1%) | 1,428 (2.0%) | 1,415 (2.0%) | 1,059 (1.5%) | 1,098 (1.6%) | 1,040 (1.5%) |
| Hispanic (of any race) | 4,672 (6.8%) | 4,678 (6.7%) | 4,852 (6.9%) | 4,871 (7.0%) | 5,023 (7.3%) | 4,991 (7.4%) |
| Total Minnesota | 69,159 (100%) | 69,904 (100%) | 69,834 (100%) | 69,749 (100%) | 68,595 (100%) | 67,344 (100%) |
- Since 2016, data for births of White Hispanic origin are not collected, but included in one Hispanic group; persons of Hispanic origin may be of any race.
Language
In the year 2007, 90.4% of Minnesota's population 5 years and over spoke only English at home. The remaining 9.6% spoke a language other than English at home. About 3.4% of Minnesota's population spoke Spanish or Spanish Creole at home. In addition, 2.1% of the population spoke a different Indo-European language at home. About 2.6% of Minnesota's population spoke an Asian language or a Pacific Island language at home. The remaining 1.5% spoke a different language at home. Ojibwe and Dakota are the indigenous languages of Minnesota.
Religion

Although Christianity dominates the religious persuasion of residents, there is a long history of non-Christian faith. German-Jewish pioneers formed Saint Paul's first synagogue in 1856,[26] and there are now appreciable numbers of adherents to Islam, Buddhism, and other traditions. Protestantism (in particular, Lutheranism due to German and Scandinavian heritage) is adhered to by the majority of Minnesotans, while Roman Catholics form the largest single denomination of Christianity.
A 2008 survey by the Pew Forum on Religion and Public Life showed that 32.0% of Minnesotans were affiliated with Mainline Protestant traditions, 21.0% with Evangelical Protestant traditions, 28.0% with Roman Catholic traditions, 1.0% each with Jewish, Islamic, Buddhist, and Black Protestant traditions, smaller amounts for other faiths, and 13.0% unaffiliated.[27]
This is broadly consistent with a 2001 survey, which indicated that 25.0% of Minnesota's population was Roman Catholic, and 24.0% was Lutheran with the Evangelical Lutheran Church in America with 853,448; and the Lutheran Church–Missouri Synod with 203,863 adherents.[28] Other religious groups represented were Baptists (5.0%), Methodists (4.0%), Presbyterians (2.0%), the Assembly of God (2.0%), and the Church of God (2.0%). Christians with unstated or other denominational affiliations, including other Mainline Protestants, totaled 13.0%, bringing the total Christian population to 77.0%. Non-Christian religions, such as Judaism, Islam, Buddhism, and Hinduism, together represented 3.0% of the population. 14.0% of respondents were irreligious according to the survey, and 6.0% refused to answer.[29]
As of 2000, the RCMS[30] reported that the Catholic Church had the highest number of adherents in Minnesota (at 1,260,660), followed by the Evangelical Lutheran Church in America with 853,448 members reported and the Lutheran Church–Missouri Synod, reporting 203,863 adherents.
In 2006, Minnesota became the first state in the US to elect a Muslim representative (Keith Ellison) to Congress.
Education
Minnesota ranks near the top in terms of an educated populace, boasting that 91.3% of adult residents 25 years or older have achieved a high school diploma, and 31.4% have earned a bachelor's degree or higher.[31] In fall 2010, approximately 71 percent of Minnesota high school graduates enrolled in a postsecondary institution the fall following graduation.[32] The number of high school graduates in Minnesota is projected to decline over the next seven years from 65,073 in 2010 to 59,727 by 2017, a drop of 5,346 students.[33] The number of nonwhite graduates is projected to grow by 4,713 students, from 16 percent of all graduates in 2010 to 23 percent of all graduates in 13 years. During the same period, the number of white graduates is projected to decline 12 percent, or by 6,511 students.[33] Many Minnesota adults pursue higher education in one of the state-supported colleges or Universities. These include those in the University of Minnesota system, which had 68,418 enrollees in 2012,[34] and MnSCU which had 433,639 students in the 09-10 school year.[35]
Occupation
The state continues to transform from an agricultural and natural resource-based economy to a high-tech and financial services-based one. Minnesota ranks 2nd in the nation, with 72.2% of adults in the labor force and 5.5% are unemployed. Occupations estimated in 2005 are:
- Management/professional 36.0%
- Sales and other office 26.0%
- Service 15.0%
- Manufacturing/production/transportation 13.0%
- Construction/mining/maintenance/repair 9.0%
- Farming/logging/fishing 1.0%
Veterans of the armed forces account for 10.8% of the adult population, which is 40th in the nation. Adults with disabilities total 12.2% of the population.
Income
In 2011 the three-year average median household income in the state was $56,869, 12th highest statewide average in the nation. In contrast, 9.8% of individuals live below the poverty line, ranking 44th in the nation.
Home ownership
Minnesota ranks first in the nation in owner-occupied home ownership, with 75.8% of residents living in their own home, with an average mortgage payment of $1,351 per month. About 24.0% are tenants.
Marital status
The average adult Minnesotan is married, although the numbers are shrinking. In 2007, 53.7% of Minnesotans over the age of 15 were married. People who were widowed made up 5.5% and people who were divorced made up 9.5%. People who were separated made up a mere 1.2% and people who were never married made up the remaining 30.1%. In the year 2005, 56.0% of people aged over 15 were married and people who were never married made up 28.6%. This shows that the percentage of people who are married is declining while the percentage of people who have never been married is on the rise.
References
- Resident Population Data. "Resident Population Data – 2010 Census". 2010.census.gov. Archived from the original on October 19, 2013. Retrieved December 24, 2012.
- "QuickFacts Minnesota; UNITED STATES". 2019 Population Estimates. United States Census Bureau, Population Division. February 18, 2020. Retrieved February 18, 2020.
- "Archived copy". Archived from the original on October 19, 2013. Retrieved September 30, 2011.CS1 maint: archived copy as title (link)
- "Environmental Information Report, App. D Socioeconomic Information" (PDF). Minnesota Pollution Control Agency. May 30, 2003. Archived from the original (PDF) on April 6, 2008. Retrieved November 19, 2006.
- "Minnesota QuickFacts from the US Census Bureau". Archived from the original on December 2, 2006. Retrieved November 26, 2006.
- "statecenters". U.S. Census Bureau. 2000. Archived from the original on June 22, 2013. Retrieved November 21, 2006.
- "County Population Totals and Components of Change: 2010-2018". 2018 Population Estimates. United States Census Bureau, Population Division. April 30, 2019. Retrieved April 30, 2019.
- "Minnesota Population Projections by Race and Hispanic Origin" (PDF). Minnesota Department of Administration. 2004. Archived from the original (PDF) on August 22, 2006. Retrieved August 14, 2006.
- "Modern Language Ass'n List of Hmong Language speakers by State using 2000 census data; Minnesota is third in the nation". Modern Language Association. 2004. Archived from the original on September 30, 2007. Retrieved November 19, 2006.
- Historical Census Statistics on Population Totals By Race, 1790 to 1990, and By Hispanic Origin, 1970 to 1990, For The United States, Regions, Divisions, and States Archived December 24, 2014, at the Wayback Machine
- "Population of Minnesota: Census 2010 and 2000 Interactive Map, Demographics, Statistics, Quick Facts". censusviewer.com. Retrieved April 8, 2018.
- Promotions, Center for New Media and; Bureau, Public Information Staff, US Census. "US Census Bureau 2010 Census". www.census.gov. Retrieved April 8, 2018.
- – "German Migration to Minnesota". Minnesota State University Anthropology Department. Archived from the original on May 18, 2007. Retrieved May 12, 2007.
- Lass, William E. (1998) [1977]. Minnesota: A History (2nd ed.). New York, NY: W.W. Norton & Company. ISBN 0-393-04628-1.
- Henderson, O.Kay (March 14, 2005). "Mondale, Ray join to remember rescue of "boat people"". Radio Iowa. Learfield Communications, Inc. Archived from the original on September 27, 2007. Retrieved May 12, 2007.
- "2014 MAA-CBO Directory" (PDF). Minnesota DOH. Archived from the original (PDF) on October 31, 2017. Retrieved January 11, 2018.
- "Immigration & Language". Minnesota State Demographic Center. Retrieved January 2, 2018.
- "New Americans in the North Star State" (PDF). Immigration Policy Center. American Immigration Council. Archived from the original (PDF) on December 26, 2013. Retrieved October 30, 2017.
- "Immigrants blend Christmas traditions from home and America". startribune.com. Archived from the original on August 17, 2014. Retrieved April 8, 2018.
- https://www.cdc.gov/nchs/data/nvsr/nvsr64/nvsr64_01.pdf
- https://www.cdc.gov/nchs/data/nvsr/nvsr64/nvsr64_12.pdf
- https://www.cdc.gov/nchs/data/nvsr/nvsr66/nvsr66_01.pdf
- https://www.cdc.gov/nchs/data/nvsr/nvsr67/nvsr67_01.pdf
- https://www.cdc.gov/nchs/data/nvsr/nvsr67/nvsr67_08-508.pdf
- "Data" (PDF). www.cdc.gov. Retrieved December 21, 2019.
- Gilman, Rhonda R. (1989). The Story of Minnesota's Past. Saint Paul, Minnesota: Minnesota Historical Society Press. p. 99. ISBN 0-87351-267-7.
- "Religious Landscape Study". pewforum.org. May 11, 2015. Retrieved April 8, 2018.
- "The Association of Religion Data Archives - Maps & Reports". www.thearda.com. Retrieved April 8, 2018.
- "American Religious Identification Survey". Exhibit 15. The Graduate Center, City University of New York. Archived from the original on October 24, 2005. Retrieved November 24, 2006.
- "State Membership Reports". thearda.com. Retrieved June 15, 2010.
- "Minnesota Quickfacts". US Census. Archived from the original on December 2, 2006. Retrieved November 21, 2012.
- "Facts About High School Graduates". MN Office of Higher Education. Retrieved November 20, 2012.
- "High School Graduate Projections". Minnesota Office of Higher Education. Retrieved November 21, 2012.
- "Campus and Unit Enrollment by Academic Level for Fall 2012". University of Minnesota. Archived from the original on December 21, 2012. Retrieved November 21, 2012.
- "Enrollment Facts" (PDF). Amazing Facts. MNSCU. Archived from the original (PDF) on April 17, 2012. Retrieved November 21, 2012.
Further reading
- "Asian Pacific Islander Nonprofit Economy Report" (Archive). Minnesota Council of Arts. 2006. - Discusses nonprofit organizations established in the Asian American community.