Oklahoma County, Oklahoma
Oklahoma County is a county located in the central part of the U.S. state of Oklahoma. As of the 2010 census, the population was 718,633,[1] making it the most populous county in Oklahoma. The county seat is Oklahoma City,[2] the state capital and largest city.
Oklahoma County | |
|---|---|
.jpg.webp) | |
 Seal | |
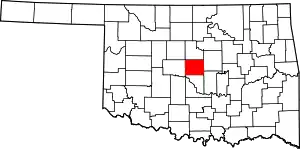 Location within the U.S. state of Oklahoma | |
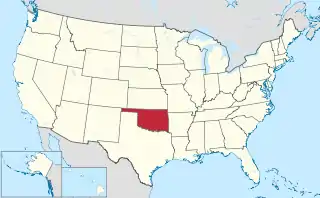 Oklahoma's location within the U.S. | |
| Coordinates: 35°29′N 97°32′W | |
| Country | |
| State | |
| Founded | 1890 |
| Seat | Oklahoma City |
| Largest city | Oklahoma City |
| Area | |
| • Total | 718 sq mi (1,860 km2) |
| • Land | 708.82 sq mi (1,835.8 km2) |
| • Water | 9.6 sq mi (25 km2) 1.3%% |
| Population (2010) | |
| • Total | 718,633 |
| • Estimate (2019) | 797,434 |
| • Density | 1,111.6/sq mi (429.2/km2) |
| Time zone | UTC−6 (Central) |
| • Summer (DST) | UTC−5 (CDT) |
| Congressional districts | 4th, 5th |
| Website | www |
Oklahoma County is at the heart of the Oklahoma City Metropolitan Statistical Area.
Oklahoma County is one of seven counties in the United States to share the same name as the state it is located in (the other six counties are Arkansas County, Hawaii County, Idaho County, Iowa County, New York County (known commonly as Manhattan), and Utah County), and the only one of the seven to contain the state capital.[3]
History
Oklahoma County was originally called County Two and was one of seven counties established by the Organic Act of 1890.[4]
County business initially took place in a building at the intersection of California Avenue and Robinson Street until the construction of the first Oklahoma County Courthouse at 520 West Main Street in the 1900s. In 1937, the county government was moved to a building at 321 Park Avenue, which now serves only as the county courthouse.[5]
Geography
According to the U.S. Census Bureau, the county has a total area of 718 square miles (1,860 km2), of which 709 square miles (1,840 km2) is land and 9.6 square miles (25 km2) (1.3%) is water.[6]
Major highways
Adjacent counties
- Logan County (north)
- Lincoln County (east)
- Pottawatomie County (southeast)
- Cleveland County (south)
- Canadian County (west)
- Kingfisher County (northwest)
National protected area
Demographics
| Historical population | |||
|---|---|---|---|
| Census | Pop. | %± | |
| 1890 | 11,742 | — | |
| 1900 | 25,915 | 120.7% | |
| 1910 | 85,232 | 228.9% | |
| 1920 | 116,307 | 36.5% | |
| 1930 | 221,738 | 90.6% | |
| 1940 | 244,159 | 10.1% | |
| 1950 | 325,352 | 33.3% | |
| 1960 | 439,506 | 35.1% | |
| 1970 | 526,805 | 19.9% | |
| 1980 | 568,933 | 8.0% | |
| 1990 | 599,611 | 5.4% | |
| 2000 | 660,448 | 10.1% | |
| 2010 | 718,633 | 8.8% | |
| 2019 (est.) | 797,434 | [7] | 11.0% |
| U.S. Decennial Census[8] 1790-1960[9] 1900-1990[10] 1990-2000[11] 2010-2019[1] | |||
As of the Census of 2010, there were 718,633 people, 277,615 households, and 172,572 families residing in the county. The population density was 1,013 people per square mile (391/km2). There were 319,828 housing units at an average density of 416 per square mile (161/km2). The racial makeup of the county was 64.6% White, 15.4% Black or African American, 3.5% Native American, 3% Asian, 0.1% Pacific Islander, 8.1% from other races, and 5.3% from two or more races. 15.1% of the population were Hispanic or Latino of any race.[12] 12.4% were of German, 12.3% Mexican, 10.1% Irish, 7.9% English, and 7.7% American ancestries according to the Census 2010. 84.4% spoke English and 11.5% Spanish as their first language.[13]
There were 277,615 households, out of which 28.5% had children under the age of 18 living with them, 43.1% were married couples living together, 15.4% had a female householder with no husband present, and 37.8% were non-families. 31.9% of all households were made up of individuals, and 9.7% had someone living alone who was 65 years of age or older. The average household size was 2.56 and the average family size was 3.26.
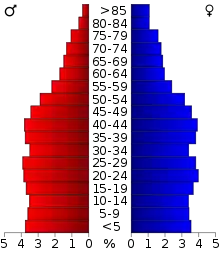
In the county, the population was spread out, with 25.60% under the age of 18, 10.90% from 18 to 24, 30.00% from 25 to 44, 21.40% from 45 to 64, and 12.20% who were 65 years of age or older. The median age was 34 years. For every 100 females, there were 94.20 males. For every 100 females age 18 and over, there were 90.80 males.
The median income for a household in the county was $42,916, and the median income for a family was $54,721. The per capita income for the county was $25,723. About 11.70% of families and 15.30% of the population were below the poverty line, including 21.70% of those under age 18 and 8.60% of those age 65 or over.[14]
Politics
Since the second half of the 20th century, Oklahoma County has been quite conservative for an urban county. It swung from a 20-point victory for Harry Truman in 1948 to a 15-point victory for Dwight Eisenhower in 1952. It has gone Republican in all but one presidential election since then; it narrowly voted for Lyndon Johnson in 1964. This mirrors the growing Republican trend in Oklahoma since the end of World War II.
However, the Republican share of votes for President has decreased in every election since the 2004 election. In the 2018 Oklahoma gubernatorial election, Oklahoma County gave Democratic candidate Drew Edmondson the largest vote share of any county, with 54.2% of the vote, whereas Republican Mary Fallin won the county with 51.3% of the vote four years prior.[15] Also, in the 2018 United States House of Representatives elections in Oklahoma, Democrat Kendra Horn received 52.3% of the vote in Oklahoma County, which was the only county in the state to vote for a Democratic House candidate.[16] In the 2020 United States Presidential election Republican incumbent Donald Trump only carried it over Joe Biden by just over one percentage point, down from his ten-point win in 2016. Trump carried the county by a razor-thin margin of 3,326 votes. Biden won 48 percent of the county's vote, the best showing by a Democrat in the county since 1964.
County Commissioners
| District | Name | Party | Took office |
|---|---|---|---|
| 1 | Carrie Blumert | Democratic | 2019 |
| 2 | Brian Maughan | Republican | 2009 |
| 3 | Kevin Calvey | Republican | 2019 |
County Offices
| Office | Name | Party | Took office |
|---|---|---|---|
| Assessor | Larry Stein | Republican | 2019 |
| County Clerk | David B. Hooten | Republican | 2017 |
| Court Clerk | Rick Warren | Republican | 2017 |
| District Attorney | David Prater | Democratic | 2007 |
| Sheriff | P.D. Taylor | Republican | 2017 |
| Treasurer | Forrest Freeman | Republican | 1993 |
Oklahoma House of Representatives
| District | Name | Party | Took office |
|---|---|---|---|
| 31 | Gary Mize | Republican | 2019 |
| 39 | Ryan Martinez | Republican | 2016 |
| 41 | Denise Crosswhite-Hader | Republican | 2019 |
| 54 | Kevin West | Republican | 2016 |
| 82 | Nicole Miller | Republican | 2019 |
| 83 | Chelsey Branham | Democratic | 2019 |
| 84 | Tammy West | Republican | 2016 |
| 85 | Cyndi Muson | Democratic | 2015 |
| 87 | Collin Walke | Democratic | 2016 |
| 88 | Mauree Turner | Democratic | 2020 |
| 89 | Jose Cruz | Democratic | 2020 |
| 90 | Jon Echols | Republican | 2013 |
| 92 | Forrest Bennett | Democratic | 2016 |
| 93 | Mickey Dollens | Democratic | 2016 |
| 94 | Andy Fugate | Democratic | 2019 |
| 95 | Kelley Albright | Democratic | 2019 |
| 96 | Lewis Moore | Republican | 2009 |
| 97 | Jason Lowe | Democratic | 2016 |
| 99 | Ajay Pittman | Democratic | 2019 |
| 100 | Marilyn Stark | Republican | 2019 |
| 101 | Robert Manger | Republican | 2019 |
Oklahoma Senate
| District | Name | Party | Took office |
|---|---|---|---|
| 15 | Rob Standridge | Republican | 2012 |
| 17 | Ron Sharp | Republican | 2012 |
| 22 | - | Vacant | - |
| 30 | Julia Kirt | Democratic | 2018 |
| 40 | Carrie Hicks | Democratic | 2018 |
| 41 | Adam Pugh | Republican | 2016 |
| 42 | Brenda Stanley | Republican | 2018 |
| 44 | Michael Brooks | Democratic | 2017 |
| 45 | Paul Rosino | Republican | 2017 |
| 46 | Kay Floyd | Democratic | 2014 |
| 47 | Greg Treat | Republican | 2011 |
| 48 | George Young | Democratic | 2018 |
Congressional
| District | Name | Party | Took office |
|---|---|---|---|
| OK-4 | Tom Cole | Republican | 2003 |
| OK-5 | Stephanie Bice | Republican | 2021 |
| Voter Registration and Party Enrollment as of January 15, 2021[17] | |||||
|---|---|---|---|---|---|
| Party | Number of Voters | Percentage | |||
| Democratic | 165,270 | 37.18% | |||
| Republican | 190,473 | 42.85% | |||
| Libertarian | 3,540 | 0.80% | |||
| Unaffiliated | 85,208 | 19.17% | |||
| Total | 444,491 | 100% | |||
| Year | Republican | Democratic | Third parties |
|---|---|---|---|
| 2020 | 49.2% 145,050 | 48.1% 141,724 | 2.7% 7,966 |
| 2016 | 51.7% 141,569 | 41.2% 112,813 | 7.1% 19,560 |
| 2012 | 58.3% 149,728 | 41.7% 106,982 | |
| 2008 | 58.4% 163,172 | 41.6% 116,182 | |
| 2004 | 64.2% 174,741 | 35.8% 97,298 | |
| 2000 | 62.3% 139,078 | 36.6% 81,590 | 1.1% 2,443 |
| 1996 | 54.7% 120,429 | 36.5% 80,438 | 8.8% 19,386 |
| 1992 | 48.8% 126,788 | 29.3% 76,271 | 21.9% 56,864 |
| 1988 | 63.6% 135,376 | 35.6% 75,812 | 0.8% 1,703 |
| 1984 | 71.7% 159,974 | 27.0% 60,235 | 1.4% 3,052 |
| 1980 | 66.1% 139,538 | 27.8% 58,765 | 6.1% 12,970 |
| 1976 | 56.7% 119,120 | 41.5% 87,185 | 1.8% 3,808 |
| 1972 | 75.2% 156,437 | 22.6% 46,986 | 2.2% 4,502 |
| 1968 | 49.7% 93,212 | 32.2% 60,395 | 18.1% 33,834 |
| 1964 | 48.0% 83,660 | 52.0% 90,641 | |
| 1960 | 61.4% 102,992 | 38.6% 64,648 | |
| 1956 | 59.8% 85,395 | 40.2% 57,512 | |
| 1952 | 57.6% 95,492 | 42.4% 70,199 | |
| 1948 | 40.1% 40,161 | 59.9% 59,954 | |
| 1944 | 42.3% 42,464 | 57.6% 57,812 | 0.1% 116 |
| 1940 | 39.8% 35,639 | 59.9% 53,649 | 0.4% 329 |
| 1936 | 32.2% 24,312 | 67.4% 50,946 | 0.5% 373 |
| 1932 | 34.1% 21,238 | 66.0% 41,130 | |
| 1928 | 69.1% 36,608 | 30.4% 16,073 | 0.5% 272 |
| 1924 | 40.6% 17,504 | 50.4% 21,708 | 9.0% 3,873 |
| 1920 | 44.7% 15,350 | 51.9% 17,820 | 3.5% 1,189 |
| 1916 | 36.3% 5,291 | 54.7% 7,971 | 8.9% 1,302 |
| 1912 | 42.0% 5,706 | 51.3% 6,963 | 6.7% 910 |
| 1908 | 50.0% 5,401 | 45.2% 4,876 | 4.8% 518 |
Communities
Cities
Unincorporated communities
See also
References
- "State & County QuickFacts". United States Census Bureau. Archived from the original on June 6, 2011. Retrieved November 12, 2013.
- "Find a County". National Association of Counties. Archived from the original on May 31, 2011. Retrieved June 7, 2011.
- Joseph Nathan Kane; Charles Curry Aiken (2005). The American Counties: Origins of County Names, Dates of Creation, and Population Data, 1950-2000. Scarecrow Press. ISBN 978-0-8108-5036-1.
- Wilson, Linda D. "Oklahoma County," Encyclopedia of Oklahoma History and Culture, Oklahoma Historical Society, 2009. Accessed April 4, 2015.
- "A Brief History of Oklahoma County Government." OklahomaCounty.org. Accessed September 17, 2009.
- "2010 Census Gazetteer Files". United States Census Bureau. August 22, 2012. Retrieved February 21, 2015.
- "County Population Totals and Components of Change: 2010-2019". United States Census Bureau. Retrieved March 26, 2020.
- "U.S. Decennial Census". United States Census Bureau. Retrieved February 21, 2015.
- "Historical Census Browser". University of Virginia Library. Retrieved February 21, 2015.
- Forstall, Richard L., ed. (March 27, 1995). "Population of Counties by Decennial Census: 1900 to 1990". United States Census Bureau. Retrieved February 21, 2015.
- "Census 2000 PHC-T-4. Ranking Tables for Counties: 1990 and 2000" (PDF). United States Census Bureau. April 2, 2001. Retrieved February 21, 2016.
- "Archived copy". Archived from the original on March 5, 2014. Retrieved November 25, 2012.CS1 maint: archived copy as title (link)
- "Oklahoma City, Oklahoma (OK) income map, earnings map, and wages data". www.city-data.com. Retrieved March 29, 2018.
- https://www.nytimes.com/elections/2014/oklahoma-elections
- https://results.okelections.us/OKER/?elecDate=20181106
- "Current Registration Statistics by County" (PDF). OK.gov (PDF). January 15, 2021. Retrieved February 7, 2021.
- Leip, David. "Dave Leip's Atlas of U.S. Presidential Elections". uselectionatlas.org. Retrieved March 29, 2018.
External links
| Wikimedia Commons has media related to Oklahoma County, Oklahoma. |
- Oklahoma County Government's website
- Oklahoma Digital Maps: Digital Collections of Oklahoma and Indian Territory
Places adjacent to Oklahoma County, Oklahoma | ||||||||||
|---|---|---|---|---|---|---|---|---|---|---|
| ||||||||||
Municipalities and communities of Oklahoma County, Oklahoma, United States | ||
|---|---|---|
| Cities | Oklahoma County map | |
| Towns | ||
| Unincorporated communities | ||
| Footnotes | ‡This populated place also has portions in an adjacent county or counties | |
| ||
Oklahoma City (capital) | ||
| Topics |
|  |
| Society |
| |
| Regions | ||
| Largest cities | ||
| Counties |
| |
| Authority control |
|---|