Harmon County, Oklahoma
Harmon County is a county in the southwest corner of the U.S. state of Oklahoma. As of the 2010 census, the population was 2,922,[1] making it the second-least populous county in Oklahoma, behind only Cimarron County. It has lost population in every census since the first in 1910, except 1930. The county seat is Hollis.[2]
Harmon County | |
|---|---|
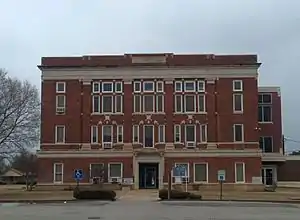 Harmon County Courthouse in January 2015 | |
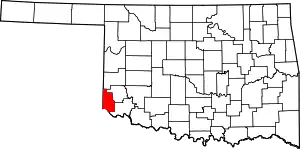 Location within the U.S. state of Oklahoma | |
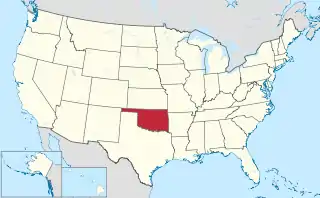 Oklahoma's location within the U.S. | |
| Coordinates: 34°44′N 99°50′W | |
| Country | |
| State | |
| Founded | 1909 |
| Seat | Hollis |
| Largest city | Hollis |
| Area | |
| • Total | 539 sq mi (1,400 km2) |
| • Land | 537 sq mi (1,390 km2) |
| • Water | 1.5 sq mi (4 km2) 0.3%% |
| Population (2010) | |
| • Total | 2,922 |
| • Estimate (2019) | 2,653 |
| • Density | 5.4/sq mi (2.1/km2) |
| Time zone | UTC−6 (Central) |
| • Summer (DST) | UTC−5 (CDT) |
| Congressional district | 3rd |
History
Following an election on May 22, 1909, Harmon County was created by proclamation of Governor Lee Cruce on June 2. Carved from adjacent Greer County, the new county was named in honor of Judson Harmon, who was Governor of Ohio at the time.[3] The area now covered by Harmon County had been a part of Texas until the U. S. Supreme Court awarded it to Oklahoma Territory in 1896.[4]
Another election held September 1, 1909, confirmed Hollis as the county seat. There were two other contestants: the towns of Harmon and Rosser. County offices operated in rented space until a courthouse was built in Hollis in 1926. In 1930, the U.S. Supreme Court ruled that the boundary between Texas and Oklahoma was actually 3,800 feet (1,200 m) farther east than originally believed. It returned the disputed land to Texas, reducing the county's area to its present size.[4]
A railroad built from Altus, Oklahoma to the Texas state line came to Hollis and Gould in 1910. The line was built by the Altus, Wichita Falls and Hollis Railway (later acquired by the Missouri, Kansas and Texas Railroad).[4]
Geography
According to the U.S. Census Bureau, the county has an area of 539 square miles (1,400 km2), of which 537 square miles (1,390 km2) is land and 1.5 square miles (3.9 km2) (0.3%) is water.[5] It lies in the Gypsum Hills physiographic region, and is drained by the Red River and its tributaries, the Salt and Elm forks of the Red River and Lebos and Turkey creeks.[4]
Major highways
 U.S. Highway 62
 State Highway 5
 State Highway 9
 State Highway 30
Adjacent counties
- Beckham County (north)
- Greer County (northeast)
- Jackson County (southeast)
- Hardeman County, Texas (south)
- Childress County, Texas (west)
- Collingsworth County, Texas (northwest)
Demographics
| Historical population | |||
|---|---|---|---|
| Census | Pop. | %± | |
| 1910 | 11,328 | — | |
| 1920 | 11,261 | −0.6% | |
| 1930 | 13,834 | 22.8% | |
| 1940 | 10,019 | −27.6% | |
| 1950 | 8,079 | −19.4% | |
| 1960 | 5,853 | −27.6% | |
| 1970 | 5,136 | −12.3% | |
| 1980 | 4,519 | −12.0% | |
| 1990 | 3,793 | −16.1% | |
| 2000 | 3,283 | −13.4% | |
| 2010 | 2,922 | −11.0% | |
| 2019 (est.) | 2,653 | [6] | −9.2% |
| U.S. Decennial Census[7] 1790-1960[8] 1900-1990[9] 1990-2000[10] 2010-2019[1] | |||
Common to many rural counties in the Great Plains the population of Harmon county has declined steadily since 1930. Between 1930 and 2010, Harmon County lost a greater percentage of its population than any other Oklahoma county, from 13,834 in 1930 to 2,922 in 2010, a decrease of 78.8%.[11]
As of the census[12] of 2000, there were 3,283 people, 1,266 households, and 863 families residing in the county. The population density was six persons per square mile (2 km2). There were 1,647 housing units at an average density of three per square mile (1/km2). The racial makeup of the county was 72.65% White, 9.78% Black or African American, 1.13% Native American, 0.18% Asian, 0.03% Pacific Islander, 14.32% from other races, and 1.92% from two or more races. The population was 22.78% Hispanic or Latino.
There were 1,266 households, out of which 30.20% had children under the age of 18 living with them, 55.70% were married couples living together, 9.20% had a female householder with no husband present, and 31.80% were non-families. 29.00% of all households were made up of individuals, and 17.50% had someone living alone who was 65 years of age or older. The average household size was 2.47 and the average family size was 3.03.
In the county, the population was spread out, with 25.90% under the age of 18, 7.90% from 18 to 24, 24.10% from 25 to 44, 21.10% from 45 to 64, and 21.00% who were 65 years of age or older. The median age was 40 years. For every 100 females there were 94.10 males. For every 100 females age 18 and over, there were 89.80 males.
The median income for a household in the county was $22,365, and the median income for a family was $29,063. Males had a median income of $21,530 versus $16,658 for females. The per capita income for the county was $13,464. About 23.50% of families and 29.70% of the population were below the poverty line, including 38.20% of those under age 18 and 19.90% of those age 65 or over.
Politics
| Voter Registration and Party Enrollment as of January 15, 2019[13] | |||||
|---|---|---|---|---|---|
| Party | Number of Voters | Percentage | |||
| Democratic | 838 | 59.14% | |||
| Republican | 437 | 30.84% | |||
| Others | 142 | 10.02% | |||
| Total | 1,417 | 100% | |||
| Year | Republican | Democratic | Third parties |
|---|---|---|---|
| 2016 | 73.2% 715 | 23.0% 225 | 3.8% 37 |
| 2012 | 71.4% 659 | 28.6% 264 | |
| 2008 | 69.5% 757 | 30.6% 333 | |
| 2004 | 70.3% 838 | 29.7% 354 | |
| 2000 | 57.4% 692 | 42.1% 507 | 0.5% 6 |
| 1996 | 33.8% 448 | 54.9% 729 | 11.3% 150 |
| 1992 | 30.8% 496 | 48.6% 783 | 20.6% 332 |
| 1988 | 40.6% 611 | 59.2% 890 | 0.2% 3 |
| 1984 | 55.9% 1,009 | 43.5% 785 | 0.6% 11 |
| 1980 | 40.5% 676 | 57.5% 961 | 2.0% 33 |
| 1976 | 32.6% 666 | 67.0% 1,371 | 0.4% 8 |
| 1972 | 68.4% 1,319 | 29.5% 568 | 2.2% 42 |
| 1968 | 30.0% 644 | 51.2% 1,097 | 18.8% 403 |
| 1964 | 26.6% 602 | 73.5% 1,665 | |
| 1960 | 47.4% 1,142 | 52.6% 1,265 | |
| 1956 | 32.4% 837 | 67.6% 1,743 | |
| 1952 | 35.7% 1,057 | 64.3% 1,904 | |
| 1948 | 10.2% 266 | 89.8% 2,340 | |
| 1944 | 20.6% 503 | 79.0% 1,933 | 0.4% 10 |
| 1940 | 24.0% 731 | 75.4% 2,292 | 0.6% 18 |
| 1936 | 11.4% 331 | 88.3% 2,570 | 0.4% 11 |
| 1932 | 5.9% 189 | 94.2% 3,042 | |
| 1928 | 56.9% 1,431 | 42.1% 1,060 | 1.0% 26 |
| 1924 | 23.3% 339 | 72.1% 1,049 | 4.7% 68 |
| 1920 | 34.2% 643 | 59.7% 1,123 | 6.1% 115 |
| 1916 | 9.8% 147 | 73.0% 1,091 | 17.1% 256 |
| 1912 | 14.3% 197 | 64.8% 895 | 21.0% 290 |
Economy
Agriculture has been the main component of the county economy. Cotton, wheat and sorghum have been the principal crops. By 1930, farmers had sizable holdings of cattle, poultry, horses, mules, swine, sheep and goats.[4]
References
- "State & County QuickFacts". United States Census Bureau. Archived from the original on June 6, 2011. Retrieved November 9, 2013.
- "Find a County". National Association of Counties. Retrieved June 7, 2011.
- Joseph Nathan Kane, The American Counties (4th Ed.), (The Scarecrow Press, 1983), p149; Arrell Morgan Gibson, Oklahoma: A History of Five Centuries (University of Oklahoma Press, 1981), p208.
- Wilson, Linda D. "Harmon County," Encyclopedia of Oklahoma History and Culture, Oklahoma Historical Society, 2009. Accessed April 4, 2015.
- "2010 Census Gazetteer Files". United States Census Bureau. August 22, 2012. Retrieved February 21, 2015.
- "County Population Totals: 2010-2019". Retrieved November 10, 2020.
- "U.S. Decennial Census". United States Census Bureau. Retrieved February 21, 2015.
- "Historical Census Browser". University of Virginia Library. Retrieved February 21, 2015.
- Forstall, Richard L., ed. (March 27, 1995). "Population of Counties by Decennial Census: 1900 to 1990". United States Census Bureau. Retrieved February 21, 2015.
- "Census 2000 PHC-T-4. Ranking Tables for Counties: 1990 and 2000" (PDF). United States Census Bureau. April 2, 2001. Retrieved February 21, 2015.
- "Oklahoma: Population of Counties by Dicennial Census," https://www.census.gov/population/www/censusdata/cencounts/files/ok190090.txt, accessed May 11, 2018
- "U.S. Census website". United States Census Bureau. Retrieved January 31, 2008.
- "Oklahoma Registration Statistics by County" (PDF). OK.gov. January 15, 2019. Retrieved February 27, 2019.
- Leip, David. "Dave Leip's Atlas of U.S. Presidential Elections". uselectionatlas.org. Retrieved March 29, 2018.
External links
- Encyclopedia of Oklahoma History and Culture - Harmon County
- Oklahoma Digital Maps: Digital Collections of Oklahoma and Indian Territory
Places adjacent to Harmon County, Oklahoma | |
|---|---|
Municipalities and communities of Harmon County, Oklahoma, United States | ||
|---|---|---|
| City | Harmon County map | |
| Town | ||
| Unincorporated communities | ||
| ||
Oklahoma City (capital) | ||
| Topics |
|  |
| Society |
| |
| Regions | ||
| Largest cities | ||
| Counties |
| |
| Authority control |
|---|