Kay County, Oklahoma
Kay County is a county located in the U.S. state of Oklahoma. As of the 2010 census, the population was 46,562.[1] Its county seat is Newkirk,[2] and the largest city is Ponca City.
Kay County | |
|---|---|
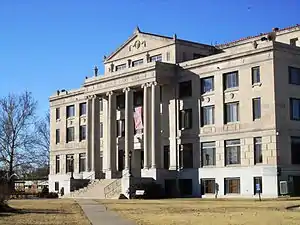 Kay County Courthouse in Newkirk (2010) | |
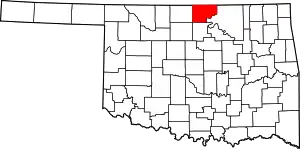 Location within the U.S. state of Oklahoma | |
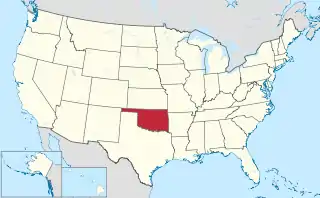 Oklahoma's location within the U.S. | |
| Coordinates: 36°49′N 97°08′W | |
| Country | |
| State | |
| Founded | 1893 |
| Seat | Newkirk |
| Largest city | Ponca City |
| Area | |
| • Total | 945 sq mi (2,450 km2) |
| • Land | 920 sq mi (2,400 km2) |
| • Water | 25 sq mi (60 km2) 2.7%% |
| Population (2010) | |
| • Total | 46,562 |
| • Estimate (2019) | 43,538 |
| • Density | 51/sq mi (20/km2) |
| Time zone | UTC−6 (Central) |
| • Summer (DST) | UTC−5 (CDT) |
| Congressional district | 3rd |
| Website | www |
Kay County comprises the Ponca City, OK Micropolitan Statistical Area. It is in north central Oklahoma on the Kansas state line.
Before statehood, Kay County was formed from the "Cherokee Strip" or "Cherokee Outlet" and originally designated as county "K." Its name means simply that.[3][4] Kay County is the only county to keep its same name as the Oklahoma area moved from a territory to a state.
History
The remains of two large 18th century villages, the Deer Creek/Bryson Paddock Sites, of Wichita Native Americans have been found overlooking the Arkansas River in Kay County. The Osage used Kay County for hunting in the late 18th and early 19th century. In 1825 the Osage ceded to the U.S. government their rights to a large expanse of land including Kay County and the government gave the Cherokee ownership of the land after their migration to Oklahoma in the 1830s.[3]
After the Civil War, the Cherokee Nation was forced to allow the Federal Government to relocate other Native American tribes to settle in the area known as the Cherokee Outlet, The Kansa (Kaw) arrived in June 1873, settling in what would become the northeastern part of Kay County. The Ponca followed in 1877. The Nez Perce came from the Pacific Northwest in 1879, but remained only until 1885, when they returned to their earlier homeland. Their assigned land in Oklahoma was then occupied by the Tonkawa and Lipan Apache people.Most of Kay County became open to non-Native American settlement in 1893 with the Cherokee Strip Land Run in which thousands of people rushed into Kay County to claim free land.[3]
The Chilocco Indian Agricultural School, north of Newkirk, was a boarding school for Indians that operated from 1884 to 1980. Its enrollment peaked at 1,300 in the 1950s and its graduates include members of 126 Indian tribes. The distinguished old buildings of the school were constructed of local limestone.[5]
In 2010, the Keystone-Cushing Pipeline (Phase II) was constructed north to south through Kay County to Cushing in Payne County.
Geography
According to the U.S. Census Bureau, the county has a total area of 945 square miles (2,450 km2), of which 920 square miles (2,400 km2) is land and 25 square miles (65 km2) (2.7%) is water.[6] The highest point in Kay County, Oklahoma, is west of North Sage Lane (36′56″12°N, 96′53″40°W), at 1,310 feet (400 m) above sea level. The lowest point is 891 feet (272 m) where the Arkansas River leaves the county.[7]
The northern boundary is the border with Kansas and its eastern boundary is with Osage County. Kaw Lake, a large reservoir on the Arkansas River completed in 1975 includes most of the water area of the country. East of Kaw Lake and the Arkansas River is the region called the Osage Hills or The Osage, a tall-grass prairie region of large livestock, mostly cattle, ranches. West of the Arkansas River the land is flatter and a mixture of cultivated lands and livestock ranches. Principal rivers flowing through the county are the Chikaskia River, the Arkansas River and the Salt Fork of the Arkansas River.[3]
Major highways
.svg.png.webp) Interstate 35
Interstate 35 U.S. Highway 60
 U.S. Highway 77
 U.S. Highway 177
 State Highway 11
 State Highway 156
Adjacent counties
- Cowley County, Kansas (north)
- Garfield County (southwest)
- Grant County (west)
- Noble County (south)
- Osage County (east)
- Sumner County, Kansas (north)
Demographics
| Historical population | |||
|---|---|---|---|
| Census | Pop. | %± | |
| 1900 | 22,530 | — | |
| 1910 | 26,999 | 19.8% | |
| 1920 | 34,907 | 29.3% | |
| 1930 | 50,186 | 43.8% | |
| 1940 | 47,084 | −6.2% | |
| 1950 | 48,892 | 3.8% | |
| 1960 | 51,042 | 4.4% | |
| 1970 | 48,791 | −4.4% | |
| 1980 | 49,852 | 2.2% | |
| 1990 | 48,056 | −3.6% | |
| 2000 | 48,080 | 0.0% | |
| 2010 | 46,562 | −3.2% | |
| 2019 (est.) | 43,538 | [8] | −6.5% |
| U.S. Decennial Census[9] 1790-1960[10] 1900-1990[11] 1990-2000[12] 2010-2019[1] | |||
As of the census[13] of 2000, there were 48,080 people, 19,157 households, and 13,141 families residing in the county. The population density was 52 people per square mile (20/km2). There were 21,804 housing units at an average density of 24 per square mile (9/km2). The racial makeup of the county was 84.16% White, 1.79% Black or African American, 7.53% Native American, 0.53% Asian, 0.02% Pacific Islander, 1.98% from other races, and 4.00% from two or more races. 4.25% of the population were Hispanic or Latino of any race.
There were 19,157 households, out of which 31.90% had children under the age of 18 living with them, 54.70% were married couples living together, 10.20% had a female householder with no husband present, and 31.40% were non-families. 27.90% of all households were made up of individuals, and 13.10% had someone living alone who was 65 years of age or older. The average household size was 2.45 and the average family size was 2.99.
In the county, the population was spread out, with 26.40% under the age of 18, 8.80% from 18 to 24, 25.00% from 25 to 44, 22.80% from 45 to 64, and 17.00% who were 65 years of age or older. The median age was 38 years. For every 100 females there were 93.70 males. For every 100 females age 18 and over, there were 89.90 males.
The median income for a household in the county was $30,762, and the median income for a family was $38,144. Males had a median income of $30,431 versus $19,617 for females. The per capita income for the county was $16,643. About 12.40% of families and 16.00% of the population were below the poverty line, including 22.70% of those under age 18 and 9.50% of those age 65 or over.
Life expectancy and health
Of 3,142 counties in the United States in 2014, the Institute for Health Metrics and Evaluation ranked Kay County 2,441 in the average life expectancy at birth of male residents and 2,650 in the life expectancy of female residents. Life expectancy in Kay county ranked in the bottom 20 percent of U.S. counties. Males in Kay County lived an average of 73.3 years and females lived an average of 78.0 years compared to the national average for life expectancy of 76.7 for males and 81.5 for females.[14] In the 1980-2014 period, the average life expectancy in Kay County for females increased by 0.1 years while male longevity increased by 3.0 years compared to the national average for the same period of an increased life expectancy of 4.0 years for women and 6.7 years for men.[15]
In 2020, the Robert Wood Johnson Foundation ranked Kay country as 47th of 77 counties in Oklahoma in "health outcomes," as measured by length and quality of life.[16]
Politics
At the presidential level, Kay County, as is generally the case throughout Oklahoma, has voted heavily Republican, with George Bush, while gaining the most votes of the three aspirants in 1992, being the only Republican since Thomas Dewey in 1948 to fail to obtain an outright majority.
| Voter Registration and Party Enrollment as of January 15, 2019[17] | |||||
|---|---|---|---|---|---|
| Party | Number of Voters | Percentage | |||
| Democratic | 6,934 | 28.58% | |||
| Republican | 13,553 | 55.87% | |||
| Others | 3,771 | 15.54% | |||
| Total | 24,258 | 100% | |||
| Year | Republican | Democratic | Third parties |
|---|---|---|---|
| 2016 | 72.4% 12,172 | 22.3% 3,738 | 5.3% 893 |
| 2012 | 71.3% 11,499 | 28.7% 4,627 | |
| 2008 | 70.8% 13,230 | 29.2% 5,463 | |
| 2004 | 70.3% 14,121 | 29.7% 5,957 | |
| 2000 | 64.8% 11,768 | 33.7% 6,122 | 1.5% 272 |
| 1996 | 49.9% 9,741 | 35.3% 6,882 | 14.8% 2,891 |
| 1992 | 39.9% 9,115 | 29.1% 6,643 | 31.0% 7,070 |
| 1988 | 61.5% 12,646 | 37.7% 7,751 | 0.8% 167 |
| 1984 | 73.0% 16,731 | 26.4% 6,044 | 0.6% 136 |
| 1980 | 67.2% 15,004 | 28.9% 6,449 | 4.0% 884 |
| 1976 | 56.3% 12,441 | 42.4% 9,371 | 1.2% 274 |
| 1972 | 78.4% 17,244 | 19.3% 4,246 | 2.3% 494 |
| 1968 | 59.1% 12,751 | 27.9% 6,031 | 13.0% 2,809 |
| 1964 | 51.6% 12,033 | 48.4% 11,296 | |
| 1960 | 64.8% 15,156 | 35.2% 8,249 | |
| 1956 | 64.8% 14,837 | 35.2% 8,071 | |
| 1952 | 66.3% 16,460 | 33.7% 8,382 | |
| 1948 | 47.0% 8,982 | 53.0% 10,119 | |
| 1944 | 52.1% 9,498 | 47.5% 8,656 | 0.5% 88 |
| 1940 | 47.9% 10,003 | 51.4% 10,725 | 0.8% 156 |
| 1936 | 35.8% 6,671 | 63.5% 11,846 | 0.7% 132 |
| 1932 | 31.4% 5,884 | 68.6% 12,841 | |
| 1928 | 76.2% 13,829 | 23.1% 4,196 | 0.8% 136 |
| 1924 | 51.2% 7,392 | 41.9% 6,049 | 7.0% 1,007 |
| 1920 | 55.5% 5,959 | 42.3% 4,546 | 2.2% 231 |
| 1916 | 46.7% 2,482 | 44.0% 2,340 | 9.3% 496 |
| 1912 | 47.6% 2,508 | 45.2% 2,380 | 7.2% 379 |
Communities
Cities
- Blackwell
- Kaw City
- Newkirk (county seat)
- Ponca City (largest city) (partially in Osage County)
- Tonkawa
Unincorporated communities
Notable people
- Joseph James, Mixed-blood Kaw native American, died in Kay County in 1898.
- Les Layton, baseball player.
- Jim Reese, former member of the Oklahoma House of Representatives and since 2011 the commissioner of the Oklahoma Department of Agriculture, was born in Kay County c. 1957.
References
- "State & County QuickFacts". United States Census Bureau. Archived from the original on June 6, 2011. Retrieved November 9, 2013.
- "Find a County". National Association of Counties. Archived from the original on May 31, 2011. Retrieved June 7, 2011.
- Linda D. Wilson, "KayCounty." Encyclopedia of Oklahoma History and Culture.
- Gannett, Henry (1905). The Origin of Certain Place Names in the United States. Govt. Print. Off. pp. 172.
- Brumley, Kim. Chilocco: Memories of a Native American Boarding School. Fairfax, OK: Guardian Publishing Co., 2010, p. 37
- "2010 Census Gazetteer Files". United States Census Bureau. August 22, 2012. Retrieved February 21, 2015.
- Google Earth
- "County Population Totals: 2010-2019". Retrieved November 10, 2020.
- "U.S. Decennial Census". United States Census Bureau. Retrieved February 21, 2015.
- "Historical Census Browser". University of Virginia Library. Retrieved February 21, 2015.
- Forstall, Richard L., ed. (March 27, 1995). "Population of Counties by Decennial Census: 1900 to 1990". United States Census Bureau. Retrieved February 21, 2015.
- "Census 2000 PHC-T-4. Ranking Tables for Counties: 1990 and 2000" (PDF). United States Census Bureau. April 2, 2001. Retrieved February 21, 2015.
- "U.S. Census website". United States Census Bureau. Retrieved January 31, 2008.
- "County Profiles: Kay County, Oklahoma" (PDF). Institute for Health Metrics and Evaluation. University of Washington. Retrieved 28 Dec 2020.
- "US Health Map". Institute of Health Metrics and Evaulation. University of Washington. Retrieved 28 December 2020.
- "2020 Oklahoma Report". Robert Wood Johnson Foundation. Retrieved 27 Dec 2020.
- "Oklahoma Registration Statistics by County" (PDF). OK.gov. January 15, 2019. Retrieved February 27, 2019.
- Leip, David. "Dave Leip's Atlas of U.S. Presidential Elections". uselectionatlas.org. Retrieved March 29, 2018.
Places adjacent to Kay County, Oklahoma | |
|---|---|
Municipalities and communities of Kay County, Oklahoma, United States | ||
|---|---|---|
| Cities | Kay County map | |
| Towns | ||
| CDP | ||
| Unincorporated communities | ||
| Ghost towns | ||
| ||
Oklahoma City (capital) | ||
| Topics |
|  |
| Society |
| |
| Regions | ||
| Largest cities | ||
| Counties |
| |
| Authority control |
|---|