Durham (provincial electoral district)
Durham is a provincial electoral district in Ontario, Canada, that has been represented in the Legislative Assembly of Ontario since 1999 and from 1926 to 1975.
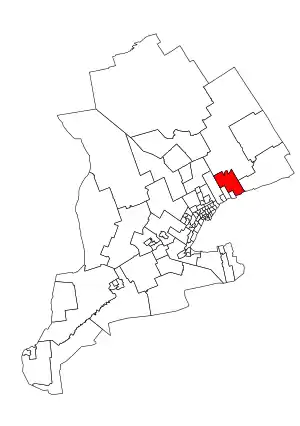 Durham in relation to other electoral districts in Southern Ontario | |||
| Provincial electoral district | |||
| Legislature | Legislative Assembly of Ontario | ||
| MPP |
Progressive Conservative | ||
| District created | 1999 | ||
| First contested | 1999 | ||
| Last contested | 2018 | ||
| Demographics | |||
| Population (2006) | 118,500 | ||
| Electors (2007) | 83,221 | ||
| Area (km²) | 1,625 | ||
| Pop. density (per km²) | 72.9 | ||
| Census division(s) | Durham | ||
| Census subdivision(s) | Clarington, Mississaugas of Scugog Island, Scugog, Uxbridge | ||
The Durham provincial riding was created in 1999 when Ontario adopted federal riding boundaries for provincial elections purposes. It was created from Durham East and Oshawa
It consisted initially of the Township of Scugog, Scugog Indian Reserve No. 34, the Town of Clarington, and the part of the City of Oshawa lying north of a line drawn from west to east along Taunton Road, south along Ritson Road North, east along Rossland Road East, south along Harmony Road North, and east along King Street East.
In 2007, the riding gained the Township of Uxbridge but lost all of its territory in Oshawa with the exception of the areas north of Taunton Road.
Members of Provincial Parliament
| Assembly | Years | Member | Party | |
|---|---|---|---|---|
| Riding created | ||||
| 15th | 1919–1923 | John Bragg | Liberal | |
| 16th | 1923–1926 | |||
| 17th | 1926–1929 | |||
| 18th | 1929–1934 | |||
| 19th | 1934–1937 | |||
| 20th | 1937–1943 | Cecil Mercer | ||
| 21st | 1943–1945 | Percival Vivian | Progressive Conservative | |
| 22nd | 1945–1948 | |||
| 23rd | 1948–1951 | John Foote | ||
| 24th | 1951–1955 | |||
| 25th | 1955–1959 | |||
| 26th | 1959–1963 | Hugh Carruthers | ||
| 27th | 1963–1967 | |||
| 28th | 1967–1971 | |||
| 29th | 1971–1975 | |||
| Riding dissolved | ||||
| Riding created from Durham East and Oshawa | ||||
| 37th | 1999–2003 | John O'Toole | Progressive Conservative | |
| 38th | 2003–2007 | |||
| 39th | 2007–2011 | |||
| 40th | 2011–2014 | |||
| 41st | 2014–2018 | Granville Anderson | Liberal | |
| 42nd | 2018–Present | Lindsey Park | Progressive Conservative | |
Election results
| 2018 Ontario general election | ||||||||
|---|---|---|---|---|---|---|---|---|
| Party | Candidate | Votes | % | ±% | ||||
| Progressive Conservative | Lindsey Park | 28,575 | 46.99% | +12.70 | ||||
| New Democratic | Joel Usher | 19,253 | 31.66% | +7.58 | ||||
| Liberal | Granville Anderson | 10,237 | 16.84% | −19.61 | ||||
| Green | Michelle Corbett | 2,360 | 3.88% | −0.51 | ||||
| Libertarian | Ryan Robinson | 382 | 0.63% | −0.17 | ||||
| Total valid votes | 60,807 | 100.0 | ||||||
| Progressive Conservative gain from Liberal | Swing | |||||||
Source(s)
"Summary of Valid Votes Cast for each Candidate" (PDF). Elections Ontario. Retrieved 16 January 2019. | ||||||||
| 2014 Ontario general election | ||||||||
|---|---|---|---|---|---|---|---|---|
| Party | Candidate | Votes | % | ±% | ||||
| Liberal | Granville Anderson | 19,816 | 36.45 | +7.10 | ||||
| Progressive Conservative | Mike Patrick | 18,640 | 34.29 | −14.78 | ||||
| New Democratic | Derek Spence | 13,094 | 24.08 | +6.49 | ||||
| Green | Halyna Zalucky | 2,382 | 4.39 | +1.70 | ||||
| Libertarian | Conner Toye | 434 | 0.80 | −0.13 | ||||
| Total valid votes | 54,336 | 100.0 | ||||||
| Liberal gain from Progressive Conservative | Swing | +10.94 | ||||||
Source(s)
Elections Ontario (2014). "Official result from the records, 019 Durham" (PDF). Retrieved 27 June 2015. | ||||||||
| 2011 Ontario general election | ||||||||
|---|---|---|---|---|---|---|---|---|
| Party | Candidate | Votes | % | ±% | ||||
| Progressive Conservative | John O'Toole | 22,393 | 49.07 | +2.14 | ||||
| Liberal | Betty Somerville | 13,394 | 29.35 | −2.83 | ||||
| New Democratic | James Terry | 8,027 | 17.59 | +5.53 | ||||
| Green | Edward Yaghledjian | 1,221 | 2.68 | −6.15 | ||||
| Libertarian | Blaize Barnicoat | 424 | 0.93 | |||||
| Freedom | David Strutt | 172 | 0.38 | |||||
| Total valid votes | 45,631 | 100.0 | −0.41 | |||||
| Total rejected, unmarked and declined ballots | 173 | 0.38 | −0.14 | |||||
| Turnout | 45,804 | 49.74 | −4.60 | |||||
| Eligible Voters | 92,906 | +9.62 | ||||||
| Progressive Conservative hold | Swing | +2.49 | ||||||
Source(s) "Summary of valid votes cast for each candidate – October 6, 2011 General Election" (PDF). Elections Ontario. Nov 18, 2011. Retrieved May 5, 2014. | ||||||||
| 2007 Ontario general election | ||||||||
|---|---|---|---|---|---|---|---|---|
| Party | Candidate | Votes | % | ±% | ||||
| Progressive Conservative | John O'Toole | 21,515 | 46.96 | −0.14 | ||||
| Liberal | Betty Somerville | 14,730 | 32.15 | −4.61 | ||||
| New Democratic | Catherine Robinson | 5,521 | 12.05 | −0.36 | ||||
| Green | June Davies | 4,053 | 8.85 | +6.51 | ||||
| Total valid votes | 45,819 | 100.0 | −9.39 | |||||
| Total Rejected Ballots | 240 | 0.52 | −0.22 | |||||
| Voter Turnout | 46,059 | 54.34 | −4.06 | |||||
| Eligible Voters | 84,755 | −2.85 | ||||||
| Sources: "Summary of valid votes cast for each candidate – October 10, 2007 General Election" (PDF). Elections Ontario. Aug 14, 2008. Retrieved May 21, 2014. "Statistical Summary — General Elections 2007" (PDF). Elections Ontario. May 8, 2008. Retrieved May 21, 2014. | ||||||||
| 2003 Ontario general election | ||||||||
|---|---|---|---|---|---|---|---|---|
| Party | Candidate | Votes | % | ±% | ||||
| Progressive Conservative | John O'Toole | 23,814 | 47.09 | −9.98 | ||||
| Liberal | Garry Minnie | 18,590 | 36.76 | +4.64 | ||||
| New Democratic | Teresa Williams | 6,274 | 12.41 | +3.15 | ||||
| Green | Gordon H. Macdonald | 1,183 | 2.34 | +1.32 | ||||
| Freedom | Cathy McKeever | 707 | 1.40 | |||||
| Total valid votes | 50,568 | 100.0 | +10.55 | |||||
| Total Rejected Ballots | 378 | 0.74 | +0.19 | |||||
| Voter Turnout | 50,946 | 58.40 | −0.11 | |||||
| Eligible Voters | 87,237 | +10.98 | ||||||
| Sources: "Summary of Valid Ballots by Candidate – General Election of October 2, 2003". Elections Ontario. Retrieved May 22, 2014. "Statistical Summary — General Elections of October 2, 2003". Elections Ontario. Retrieved May 22, 2014. | ||||||||
| 1999 Ontario general election | ||||||||
|---|---|---|---|---|---|---|---|---|
| Party | Candidate | Votes | % | |||||
| Progressive Conservative | John O'Toole | 26,103 | 57.07 | |||||
| Liberal | Garry Minnie | 14,694 | 32.12 | |||||
| New Democratic | Jim Morrison | 4,235 | 9.26 | |||||
| Green | Gail Thompson | 467 | 1.02 | |||||
| Natural Law | Jacinthe Millaire | 242 | 0.53 | |||||
| Total valid votes | 45,741 | 100.0 | ||||||
| Total Rejected Ballots | 253 | 0.55 | ||||||
| Voter Turnout | 45,994 | 58.51 | ||||||
| Eligible Voters | 78,608 | |||||||
| Sources: "Summary of Valid Ballots by Candidate – General Election June 3 1999". Elections Ontario. Retrieved May 22, 2014. "Statistical Summary — General Election of June 3 1999". Elections Ontario. Retrieved May 22, 2014. | ||||||||
2007 electoral reform referendum
| 2007 Ontario electoral reform referendum | |||
|---|---|---|---|
| Side | Votes | % | |
| First Past the Post | 30,290 | 67.3 | |
| Mixed member proportional | 14,750 | 32.7 | |
| Total valid votes | 45,040 | 100.0 | |
Sources
- Elections Ontario Past Election Results
- "Elections Ontario - 2011 General Election Results By District". Elections Ontario. 2011-10-07. Archived from the original on 2014-06-14. Retrieved 2011-10-08.