Sault Ste. Marie (provincial electoral district)
Sault Ste. Marie is a provincial electoral district in the Legislative Assembly of Ontario, representing the City of Sault Ste. Marie.
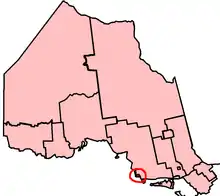 Sault Ste. Marie in relation to other Northern Ontario electoral districts | |||
| Provincial electoral district | |||
| Legislature | Legislative Assembly of Ontario | ||
| MPP |
Progressive Conservative | ||
| District created | 1902 | ||
| First contested | 1902 | ||
| Last contested | 2017 | ||
| Demographics | |||
| Population (2016) | 73,368 | ||
| Electors (2014) | 59,385 | ||
| Area (km²) | 247 | ||
| Pop. density (per km²) | 297 | ||
| Census division(s) | Algoma | ||
| Census subdivision(s) | Sault Ste. Marie | ||
History
The riding was created in 1902 from part of Algoma East, and originally consisted of a large section of Algoma District from the boundary of Thunder Bay District to the mouth of the Echo River. It has essentially had the same boundaries (that of the city of Sault Ste. Marie) since the 1966 redistribution.
Prior to 1996, Ontario was divided into the same electoral districts as those used for federal electoral purposes. They were redistributed whenever a readjustment took place at the federal level.
In 2005, legislation was passed by the Legislature to divide Ontario into 107 electoral districts, beginning with the next provincial election in 2007. The eleven northern electoral districts, including Sault Ste. Marie, are those defined for federal purposes in 1996, based on the 1991 census (except for a minor boundary adjustment). The 96 southern electoral districts are those defined for federal electoral purposes in 2003, based on the 2001 census. Without this legislation, the number of electoral districts in northern Ontario would have been reduced from eleven to ten.[1]
As a result, the provincial electoral district consists solely of the City of Sault Ste. Marie, while the federal electoral district also includes Prince Township, the Rankin, Garden River, Goulais Bay and Obadjiwan reserves, and a portion of Unorganized North Algoma District extending north to the Montreal River.
Demographics
According to the Canada 2011 Census[2][3]
- Ethnic Groups: 89.2% White, 9.2% Aboriginal
- Languages: 87.0% English, 4.9% Italian, 4.1% French
- Religion: 74.4% Christian (40.6% Catholic, 9.7% United Church, 6.4% Anglican, 2.7% Lutheran, 1.8% Presbyterian, 1.7% Pentecostal, 1.6% Baptist, 9.8% Other Christian), 24.6% No religion.
- Average household income: $69,456
- Median household income: $56,051
- Average individual income: $37,466
- Median individual income: $30,118
Members of Provincial Parliament
This riding has elected the following members of the Legislative Assembly of Ontario:
Election results
| 2018 Ontario general election | ||||||||
|---|---|---|---|---|---|---|---|---|
| Party | Candidate | Votes | % | ±% | ||||
| Progressive Conservative | Ross Romano | 13,498 | 42.03 | +1.66 | ||||
| New Democratic | Michele McCleave-Kennedy | 13,084 | 40.74 | +7.92 | ||||
| Liberal | Jaclynne Hamel | 3,199 | 9.96 | –13.05 | ||||
| Green | Kara Flannigan | 1,044 | 3.25 | +1.26 | ||||
| Northern Ontario | Sandy Holmberg | 993 | 3.09 | |||||
| Libertarian | Lance Brizard | 299 | 0.93 | +0.65 | ||||
| Total valid votes | 32,117 | 100.0 | ||||||
| Total rejected, unmarked and declined ballots | ||||||||
| Turnout | 54.79 | |||||||
| Eligible voters | 58,616 | |||||||
| Progressive Conservative hold | Swing | –3.13 | ||||||
| Source: Elections Ontario[4] | ||||||||
| Ontario provincial by-election, June 1, 2017 Resignation of David Orazietti | ||||||||
|---|---|---|---|---|---|---|---|---|
| Party | Candidate | Votes | % | ±% | ||||
| Progressive Conservative | Ross Romano | 10,411 | 40.37 | +27.98 | ||||
| New Democratic | Joe Krmpotich | 8,465 | 32.82 | +7.35 | ||||
| Liberal | Debbie Amaroso | 5,935 | 23.01 | –35.52 | ||||
| Green | Kara Flannigan | 512 | 1.99 | –1.24 | ||||
| None of the Above | Above Znoneofthe | 313 | 1.21 | |||||
| Libertarian | Gene Balfour | 71 | 0.28 | –0.11 | ||||
| Pauper | John Turmel | 47 | 0.18 | |||||
| Total valid votes | 25,754 | 100.0 | ||||||
| Turnout | 43.93 | |||||||
| Registered electors | 58,690 | |||||||
| Progressive Conservative gain from Liberal | Swing | +31.74 | ||||||
| Source: Elections Ontario[5] | ||||||||
| 2014 Ontario general election | ||||||||
|---|---|---|---|---|---|---|---|---|
| Party | Candidate | Votes | % | ±% | ||||
| Liberal | David Orazietti | 17,490 | 58.53 | +3.59 | ||||
| New Democratic | Celia Ross | 7,610 | 25.47 | -5.40 | ||||
| Progressive Conservative | Rod Fremlin | 3,704 | 12.39 | +0.56 | ||||
| Green | Kara Flannigan | 965 | 3.23 | +1.46 | ||||
| Libertarian | Austin Williams | 115 | 0.38 | |||||
| Total valid votes | 29,884 | 100.00 | ||||||
| Total rejected, unmarked and declined ballots | 266 | 0.88 | +0.38 | |||||
| Turnout | 30,150 | 50.77 | +1.42 | |||||
| Eligible voters | 59,385 | |||||||
| Liberal hold | Swing | +4.47 | ||||||
| Source: Elections Ontario[6] | ||||||||
| 2011 Ontario general election | ||||||||
|---|---|---|---|---|---|---|---|---|
| Party | Candidate | Votes | % | ±% | ||||
| Liberal | David Orazietti | 16,109 | 54.95 | -5.18 | ||||
| New Democratic | Celia Ross | 9,037 | 30.83 | +4.44 | ||||
| Progressive Conservative | Jib Turner | 3,477 | 11.86 | +4.55 | ||||
| Green | Luke Macmichael | 519 | 1.77 | -2.52 | ||||
| Family Coalition | Matthew Hunt | 172 | 0.59 | -1.30 | ||||
| Total valid votes | 29,314 | 100.00 | ||||||
| Total rejected, unmarked and declined ballots | 147 | 0.50 | -0.01 | |||||
| Turnout | 29,461 | 49.35 | -6.21 | |||||
| Eligible voters | 59,698 | |||||||
| Liberal hold | Swing | -4.81 | ||||||
| Source: Elections Ontario[7] | ||||||||
| 2007 Ontario general election | ||||||||
|---|---|---|---|---|---|---|---|---|
| Party | Candidate | Votes | % | ±% | ||||
| Liberal | David Orazietti | 19,316 | 60.13 | +3.09 | ||||
| New Democratic | Jeff Arbus | 8,475 | 26.38 | -5.99 | ||||
| Progressive Conservative | Josh Pringle | 2,349 | 7.31 | -0.29 | ||||
| Green | André Riopel | 1,377 | 4.29 | +3.03 | ||||
| Family Coalition | Bill Murphy | 605 | 1.88 | +0.16 | ||||
| Total valid votes | 32,122 | 100.00 | ||||||
| Total rejected, unmarked and declined ballots | 163 | 0.50 | ||||||
| Turnout | 32,285 | 55.56 | ||||||
| Eligible voters | 58,108 | |||||||
| Liberal hold | Swing | +4.54 | ||||||
| 2003 Ontario general election | ||||||||
|---|---|---|---|---|---|---|---|---|
| Party | Candidate | Votes | % | ±% | ||||
| Liberal | David Orazietti | 20,050 | 57.04 | +29.45 | ||||
| New Democratic | Tony Martin | 11,379 | 32.37 | -10.86 | ||||
| Progressive Conservative | Bruce Willson | 2,674 | 7.61 | -20.79 | ||||
| Family Coalition | Al Walker | 606 | 1.72 | |||||
| Green | Dan Brosemer | 441 | 1.25 | |||||
| Total valid votes | 35,150 | 100.00 | ||||||
| Liberal gain from New Democratic | Swing | +20.15 | ||||||
| 1999 Ontario general election | ||||||||
|---|---|---|---|---|---|---|---|---|
| Party | Candidate | Votes | % | ±% | ||||
| New Democratic | Tony Martin | 15,949 | 43.23 | -0.10 | ||||
| Progressive Conservative | James Caicco | 10,477 | 28.40 | +6.72 | ||||
| Liberal | Terry Sheehan | 10,180 | 27.59 | -5.27 | ||||
| Natural Law | Colleen Hibbs | 288 | 0.78 | |||||
| Total valid votes | 36,894 | 100.00 | ||||||
| New Democratic hold | Swing | -3.41 | ||||||
| 1995 Ontario general election | ||||||||
|---|---|---|---|---|---|---|---|---|
| Party | Candidate | Votes | % | ±% | ||||
| New Democratic | Tony Martin | 15,392 | 43.33 | +7.03 | ||||
| Liberal | Carmen Provenzano | 11,672 | 32.86 | -1.65 | ||||
| Progressive Conservative | Lou Turco | 7,699 | 21.67 | +13.11 | ||||
| Green | Paul Thompson | 757 | 2.13 | |||||
| Total valid votes | 35,520 | 100.00 | ||||||
| New Democratic hold | Swing | +4.34 | ||||||
| 1990 Ontario general election | ||||||||
|---|---|---|---|---|---|---|---|---|
| Party | Candidate | Votes | % | ±% | ||||
| New Democratic | Tony Martin | 14,013 | 36.30 | -12.69 | ||||
| Liberal | Don Macgregor | 13,322 | 34.51 | -7.59 | ||||
| Confederation of Regions | Don Edwards | 7,958 | 20.62 | |||||
| Progressive Conservative | John Solski | 3,308 | 8.57 | -0.33 | ||||
| Total valid votes | 38,601 | 100.00 | ||||||
| New Democratic hold | Swing | -2.55 | ||||||
| 1987 Ontario general election | ||||||||
|---|---|---|---|---|---|---|---|---|
| Party | Candidate | Votes | % | ±% | ||||
| New Democratic | Karl Morin-Strom | 19,064 | 49.00 | +4.15 | ||||
| Liberal | Albert Ferranti | 16,381 | 42.10 | +28.86 | ||||
| Progressive Conservative | Udo Rauk | 3,464 | 8.90 | -33.01 | ||||
| Total valid votes | 38,900 | 100.00 | ||||||
| New Democratic hold | Swing | -12.36 | ||||||
| 1985 Ontario general election | ||||||||
|---|---|---|---|---|---|---|---|---|
| Party | Candidate | Votes | % | ±% | ||||
| New Democratic | Karl Morin-Strom | 16,362 | 44.85 | +20.51 | ||||
| Progressive Conservative | Russ Ramsay | 15,293 | 41.92 | -8.08 | ||||
| Liberal | Ray Youngson | 4,830 | 13.24 | -12.43 | ||||
| Total valid votes | 36,485 | 100.00 | ||||||
| New Democratic gain from Progressive Conservative | Swing | +14.29 | ||||||
| 1981 Ontario general election | ||||||||
|---|---|---|---|---|---|---|---|---|
| Party | Candidate | Votes | % | ±% | ||||
| Progressive Conservative | Russ Ramsay | 14,712 | 49.99 | -5.29 | ||||
| Liberal | Albert Ferranti | 7,555 | 25.67 | +14.98 | ||||
| New Democratic | Susan Brothers | 7,162 | 24.34 | -9.22 | ||||
| Total valid votes | 29,429 | 100.00 | ||||||
| Progressive Conservative hold | Swing | -10.14 | ||||||
^ Change from general election
| Ontario provincial by-election, December 14, 1978 | ||||||||
|---|---|---|---|---|---|---|---|---|
| Party | Candidate | Votes | % | ±% | ||||
| Progressive Conservative | Russ Ramsay | 15,960 | 52.14 | -3.14 | ||||
| New Democratic | Ron Moreau | 10,145 | 33.14 | -0.42 | ||||
| Liberal | Ron Luciano | 4,505 | 14.72 | +4.03 | ||||
| Total valid votes | 30,610 | 100.00 | ||||||
| Progressive Conservative hold | Swing | -1.36 | ||||||
| 1977 Ontario general election | ||||||||
|---|---|---|---|---|---|---|---|---|
| Party | Candidate | Votes | % | ±% | ||||
| Progressive Conservative | John Rhodes | 19,209 | 55.28 | +12.83 | ||||
| New Democratic | Don Burgess | 11,660 | 33.56 | -6.12 | ||||
| Liberal | John Nelson | 3,715 | 10.69 | -6.49 | ||||
| Communist | Arlene Bovingdon | 162 | 0.47 | -0.22 | ||||
| Total valid votes | 34,746 | 100.00 | ||||||
| Progressive Conservative hold | Swing | +9.47 | ||||||
| 1975 Ontario general election | ||||||||
|---|---|---|---|---|---|---|---|---|
| Party | Candidate | Votes | % | ±% | ||||
| Progressive Conservative | John Rhodes | 14,415 | 42.46 | -0.54 | ||||
| New Democratic | Ron Moreau | 13,470 | 39.67 | -0.35 | ||||
| Liberal | Bob Gernon | 5,835 | 17.19 | +0.21 | ||||
| Communist | Gordon Massie | 232 | 0.68 | |||||
| Total valid votes | 33,952 | 100.00 | ||||||
| Progressive Conservative hold | Swing | -0.09 | ||||||
| 1971 Ontario general election | ||||||||
|---|---|---|---|---|---|---|---|---|
| Party | Candidate | Votes | % | ±% | ||||
| Progressive Conservative | John Rhodes | 14,983 | 43.00 | +0.79 | ||||
| New Democratic | Anne Valentine | 13,948 | 40.03 | +5.01 | ||||
| Liberal | Jim Hilsinger | 5,915 | 16.97 | -5.80 | ||||
| Total valid votes | 34,846 | 100.00 | ||||||
| Progressive Conservative hold | Swing | -2.11 | ||||||
| 1967 Ontario general election | ||||||||
|---|---|---|---|---|---|---|---|---|
| Party | Candidate | Votes | % | |||||
| Progressive Conservative | Arthur Wishart | 11,807 | 42.21 | |||||
| New Democratic | Earl Orchard | 9,797 | 35.02 | |||||
| Liberal | Frank Shunnock | 6,371 | 22.71 | |||||
| Total valid votes | 27,975 | 100.00 | ||||||
| 1963 Ontario general election | ||||||||
|---|---|---|---|---|---|---|---|---|
| Party | Candidate | Votes | % | |||||
| Progressive Conservative | Arthur Wishart | 11,559 | 42.24 | |||||
| Liberal | Frank Ianni | 9,359 | 34.20 | |||||
| New Democratic | Lloyd B. Hetherington | 6,446 | 23.56 | |||||
| Total valid votes | 27,364 | 100.00 | ||||||
| 1959 Ontario general election | ||||||||
|---|---|---|---|---|---|---|---|---|
| Party | Candidate | Votes | % | |||||
| Progressive Conservative | Harry Lyons | 8,260 | 40.10 | |||||
| Liberal | Joseph Hussey | 6,955 | 33.76 | |||||
| Co-operative Commonwealth | Leslie C. Woodckcok | 5,386 | 26.14 | |||||
| Total valid votes | 20,601 | 100.00 | ||||||
| 1955 Ontario general election | ||||||||
|---|---|---|---|---|---|---|---|---|
| Party | Candidate | Votes | % | |||||
| Progressive Conservative | Harry Lyons | 7,716 | 41.77 | |||||
| Co-operative Commonwealth | Harvey C. Willoughby | 5,785 | 31.32 | |||||
| Liberal | Wylie A. Rodman | 4,517 | 24.45 | |||||
| Labor–Progressive | Edward Bain | 453 | 2.45 | |||||
| Total valid votes | 18,471 | 100.00 | ||||||
| 1951 Ontario general election | ||||||||
|---|---|---|---|---|---|---|---|---|
| Party | Candidate | Votes | % | |||||
| Progressive Conservative | Harry Lyons | 7,359 | 39.42 | |||||
| Liberal | Norman S. Currie | 6,051 | 32.42 | |||||
| Co-operative Commonwealth | George Isaac Harvey | 5,257 | 28.16 | |||||
| Total valid votes | 18,667 | 100.00 | ||||||
| 1948 Ontario general election | ||||||||
|---|---|---|---|---|---|---|---|---|
| Party | Candidate | Votes | % | |||||
| Co-operative Commonwealth | George Isaac Harvey | 6,514 | 41.77 | |||||
| Progressive Conservative | Wesley W. Hill | 5,081 | 32.58 | |||||
| Liberal | W. A. Rodman | 4,000 | 25.65 | |||||
| Total valid votes | 15,595 | 100.00 | ||||||
| 1945 Ontario general election | ||||||||
|---|---|---|---|---|---|---|---|---|
| Party | Candidate | Votes | % | |||||
| Co-operative Commonwealth | George Isaac Harvey | 5,623 | 34.69 | |||||
| Progressive Conservative | W. J. McMeeken | 5,447 | 33.61 | |||||
| Liberal | T. McGee | 5,138 | 31.70 | |||||
| Total valid votes | 16,208 | 100.00 | ||||||
| 1943 Ontario general election | ||||||||
|---|---|---|---|---|---|---|---|---|
| Party | Candidate | Votes | % | |||||
| Co-operative Commonwealth | George Isaac Harvey | 7,173 | 55.70 | |||||
| Liberal | Colin Campbell | 3,069 | 23.83 | |||||
| Progressive Conservative | Earl Dinsmore | 2,637 | 20.48 | |||||
| Total valid votes | 12,879 | 100.00 | ||||||
| Ontario provincial by-election, November 23, 1937 | ||||||||
|---|---|---|---|---|---|---|---|---|
| Party | Candidate | Votes | ||||||
| Liberal | Colin Campbell | acclaimed | ||||||
| 1937 Ontario general election | ||||||||
|---|---|---|---|---|---|---|---|---|
| Party | Candidate | Votes | % | |||||
| Liberal | Richard McMeekin | 7,134 | 49.47 | |||||
| Conservative | James W. Lyons | 6,488 | 44.99 | |||||
| Co-operative Commonwealth | Herman J. Lefave | 798 | 5.53 | |||||
| Total valid votes | 14,420 | 100.00 | ||||||
| 1934 Ontario general election | ||||||||
|---|---|---|---|---|---|---|---|---|
| Party | Candidate | Votes | % | |||||
| Liberal | Augustus Roberts | 7,530 | 55.47 | |||||
| Conservative | James W. Lyons | 5,719 | 42.13 | |||||
| Co-operative Commonwealth | George Curry | 327 | 2.41 | |||||
| Total valid votes | 13,576 | 100.00 | ||||||
| 1929 Ontario general election | ||||||||
|---|---|---|---|---|---|---|---|---|
| Party | Candidate | Votes | % | |||||
| Conservative | James W. Lyons | 6,216 | 76.94 | |||||
| Liberal | Ernest DeCourcy | 1,863 | 23.06 | |||||
| Total valid votes | 8,079 | 100.00 | ||||||
| 1926 Ontario general election | ||||||||
|---|---|---|---|---|---|---|---|---|
| Party | Candidate | Votes | % | |||||
| Conservative | James W. Lyons | 5,497 | 77.38 | |||||
| Prohibition | James Bertram Cunningham | 1,607 | 22.62 | |||||
| Total valid votes | 7,104 | 100.00 | ||||||
| Ontario provincial by-election, 1923 | ||||||||
|---|---|---|---|---|---|---|---|---|
| Party | Candidate | Votes | ||||||
| Conservative | James W. Lyons | acclaimed | ||||||
| 1923 Ontario general election | ||||||||
|---|---|---|---|---|---|---|---|---|
| Party | Candidate | Votes | % | |||||
| Conservative | James W. Lyons | 2,839 | 43.27 | |||||
| Liberal | John A. McPhail | 2,395 | 36.50 | |||||
| Labour | James Bertram Cunningham | 1,327 | 20.23 | |||||
| Total valid votes | 6,561 | 100.00 | ||||||
| 1919 Ontario general election | ||||||||
|---|---|---|---|---|---|---|---|---|
| Party | Candidate | Votes | % | |||||
| Labour | James Bertram Cunningham | 4,444 | 59.11 | |||||
| Conservative | William Howard Hearst | 3,074 | 40.89 | |||||
| Total valid votes | 7,518 | 100.00 | ||||||
| 1914 Ontario general election | ||||||||
|---|---|---|---|---|---|---|---|---|
| Party | Candidate | Votes | % | |||||
| Conservative | William Howard Hearst | 2,231 | 60.92 | |||||
| Liberal | Francis E. Crawford | 1,431 | 39.08 | |||||
| Total valid votes | 3,662 | 100.00 | ||||||
| 1911 Ontario general election | ||||||||
|---|---|---|---|---|---|---|---|---|
| Party | Candidate | Votes | ||||||
| Conservative | William Howard Hearst | Acclaimed | ||||||
| 1908 Ontario general election | ||||||||
|---|---|---|---|---|---|---|---|---|
| Party | Candidate | Votes | % | |||||
| Conservative | William Howard Hearst | 1,406 | 54.69 | |||||
| Liberal | Charles Napier Smith | 1,165 | 45.31 | |||||
| Total valid votes | 2,571 | 100.00 | ||||||
| 1905 Ontario general election | ||||||||
|---|---|---|---|---|---|---|---|---|
| Party | Candidate | Votes | % | |||||
| Liberal | Charles Napier Smith | 1,396 | 52.05 | |||||
| Conservative | M. McFadden | 1,286 | 47.95 | |||||
| Total valid votes | 2,682 | 100.00 | ||||||
| Ontario provincial by-election, October 27, 1903 | ||||||||
|---|---|---|---|---|---|---|---|---|
| Party | Candidate | Votes | % | |||||
| Liberal | Charles Napier Smith | 1,254 | 55.46 | |||||
| Conservative | Andrew Miscampbell | 1,007 | 44.54 | |||||
| Total valid votes | 2,261 | 100.00 | ||||||
| 1902 Ontario general election | ||||||||
|---|---|---|---|---|---|---|---|---|
| Party | Candidate | Votes | % | |||||
| Conservative | Andrew Miscampbell | 1,359 | 53.95 | |||||
| Liberal | Charles Napier Smith | 1,160 | 46.05 | |||||
| Total valid votes | 2,519 | 100.00 | ||||||
2007 electoral reform referendum
| 2007 Ontario electoral reform referendum | |||
|---|---|---|---|
| Side | Votes | % | |
| First Past the Post | 22,830 | 73.79 | |
| Mixed member proportional | 8,110 | 26.21 | |
| Total valid votes | 30,940 | 100.00 | |
References
- Elections Ontario web site, “New Electoral Boundaries” Archived 2006-12-08 at the Wayback Machine
- "Summary of Valid Votes Cast for each Candidate" (PDF). Elections Ontario. p. 9. Retrieved 20 January 2019.
- "Online Election Night Results (174 of 174 polls reporting)". Elections Ontario. 1 June 2017. Retrieved 1 June 2017.
- Elections Ontario (2018). "June 12, 2014 general election poll by poll results and summaries: Sault Ste. Marie". Retrieved 1 June 2017.
- Elections Ontario (2011). "Official return from the records / Rapport des registres officiels - Sault Ste. Marie" (PDF). Retrieved 1 June 2014.
Sources
- Elections Ontario
- Centennial Edition of a History of the Electoral Districts, Legislatures and Ministries of the Province of Ontario 1867-1967
- Map of riding for 2018 election