York—Simcoe (provincial electoral district)
York—Simcoe is a provincial electoral district in Ontario, Canada, that has been represented in the Legislative Assembly of Ontario since the 2007 provincial election.
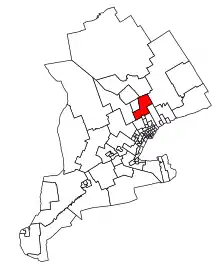 York—Simcoe in relation to Southern Ontario ridings | |||
| Provincial electoral district | |||
| Legislature | Legislative Assembly of Ontario | ||
| MPP |
Progressive Conservative | ||
| District created | 2006 | ||
| First contested | 2007 | ||
| Last contested | 2018 | ||
| Demographics | |||
| Population (2006) | 120,371 | ||
| Electors (2018) | 81,241 | ||
| Area (km²) | 1,194 | ||
| Pop. density (per km²) | 100.8 | ||
| Census division(s) | York, Simcoe County | ||
| Census subdivision(s) | Bradford West Gwillimbury, East Gwillimbury, Georgina, King | ||
It covers part of the region north of Toronto by Lake Simcoe. The riding includes the municipalities of Bradford West Gwillimbury, East Gwillimbury, Georgina and King north of Regional Road 31. It also includes the community of the Chippewas of Georgina Island First Nation Indian Reserve.
The provincial electoral district was created in 1999 when provincial ridings were defined to have the same borders as federal ridings.
Members of Provincial Parliament
| York—Simcoe | ||||
|---|---|---|---|---|
| Assembly | Years | Member | Party | |
| Riding created | ||||
| 39th | 2007–2011 | Julia Munro | Progressive Conservative | |
| 40th | 2011–2014 | |||
| 41st | 2014–2018 | |||
| 42nd | 2018–Present | Caroline Mulroney | ||
Election results
| 2018 Ontario general election | ||||||||
|---|---|---|---|---|---|---|---|---|
| Party | Candidate | Votes | % | ±% | ||||
| Progressive Conservative | Caroline Mulroney | 26,050 | 57.26 | +16.84 | ||||
| New Democratic | Dave Szollosy | 10,655 | 23.42 | +5.54 | ||||
| Liberal | Loralea Carruthers | 6,182 | 13.59 | -20.94 | ||||
| Green | Alexandra S. Zalucky | 2,195 | 4.83 | -1.45 | ||||
| Libertarian | Ioan Silviu Druma-Strugariu | 259 | 0.57 | -0.32 | ||||
| Ontario Moderate Party | Franco Colavecchia | 150 | 0.33 | – | ||||
| Total valid votes | 45,491 | 100.00 | ||||||
| Total rejected, unmarked and declined ballots | 553 | |||||||
| Turnout | 46,044 | 54.9 | ||||||
| Eligible voters | 83,837 | |||||||
| Progressive Conservative hold | Swing | +5.65 | ||||||
| Source: Elections Ontario[1][2] | ||||||||
| 2014 Ontario general election | ||||||||
|---|---|---|---|---|---|---|---|---|
| Party | Candidate | Votes | % | ±% | ||||
| Progressive Conservative | Julia Munro | 19,025 | 40.42 | -12.36 | ||||
| Liberal | Loralea Carruthers | 16,276 | 34.53 | +9.99 | ||||
| New Democratic | Laura Bowman | 8,420 | 17.88 | +0.81 | ||||
| Green | Peter Elgie | 2,946 | 6.28 | +2.46 | ||||
| Libertarian | Craig Wallace | 419 | 0.89 | -0.37 | ||||
| Total valid votes | 47,086 | 100.00 | ||||||
| Progressive Conservative hold | Swing | -11.18 | ||||||
| Source: Elections Ontario[3] | ||||||||
| 2011 Ontario general election | ||||||||
|---|---|---|---|---|---|---|---|---|
| Party | Candidate | Votes | % | ±% | ||||
| Progressive Conservative | Julia Munro | 20,425 | 52.78 | +6.55 | ||||
| Liberal | Gloria Reszler | 9,496 | 24.54 | -6.29 | ||||
| New Democratic | Megan Tay | 6,607 | 17.07 | +6.93 | ||||
| Green | Meade Helman | 1,479 | 3.82 | -7.43 | ||||
| Libertarian | Craig Hodgins | 489 | 1.26 | +0.42 | ||||
| Freedom | Mark Harrison | 201 | 0.52 | |||||
| Total valid votes | 38,697 | 100.00 | ||||||
| Total rejected, unmarked and declined ballots | 183 | 0.47 | ||||||
| Turnout | 38,880 | 42.91 | ||||||
| Eligible voters | 90,599 | |||||||
| Progressive Conservative hold | Swing | +6.42 | ||||||
| Source: Elections Ontario[4] | ||||||||
| 2007 Ontario general election | ||||||||
|---|---|---|---|---|---|---|---|---|
| Party | Candidate | Votes | % | |||||
| Progressive Conservative | Julia Munro | 19,173 | 46.23 | |||||
| Liberal | John Gilbank | 12,785 | 30.83 | |||||
| Green | Jim Reeves | 4,664 | 11.25 | |||||
| New Democratic | Nancy Morrison | 4,205 | 10.14 | |||||
| Libertarian | Caley McKibbin | 348 | 0.84 | |||||
| Family Coalition | Victor Carvalho | 297 | 0.72 | |||||
| Total valid votes | 41,472 | 100.0 | ||||||
| Source:[5] | ||||||||
2007 electoral reform referendum
| 2007 Ontario electoral reform referendum | |||
|---|---|---|---|
| Side | Votes | % | |
| First Past the Post | 26,145 | 64.6 | |
| Mixed member proportional | 14,302 | 35.4 | |
| Total valid votes | 40,447 | 100.0 | |
References
- "Summary of Valid Votes Cast for each Candidate" (PDF). Elections Ontario. Retrieved 16 January 2019.
- "Official Return from the Records: 2018 General Election: Electoral district - 121 York—Simcoe". Elections Ontario. Retrieved November 23, 2019.
- Elections Ontario. "General Election Results by District, 105 York-Simcoe". Archived from the original on June 14, 2014. Retrieved 13 June 2014.
- Elections Ontario (2011). "Official return from the records / Rapport des registres officiels - York—Simcoe" (PDF). Retrieved 2 June 2014.
- 2007 General Election - Summary of Valid Votes Cast for Each Candidate
This article is issued from Wikipedia. The text is licensed under Creative Commons - Attribution - Sharealike. Additional terms may apply for the media files.