Thornhill (provincial electoral district)
Thornhill is a provincial electoral district in Ontario, Canada, that has been represented in the Legislative Assembly of Ontario since 1999.
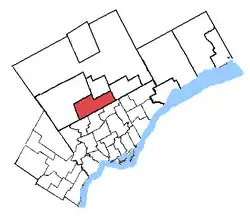
 Thornhill in relation to the other Toronto ridings | |||
| Provincial electoral district | |||
| Legislature | Legislative Assembly of Ontario | ||
| MPP |
Progressive Conservative | ||
| District created | 1996 | ||
| First contested | 1999 | ||
| Last contested | 2018 | ||
| Demographics | |||
| Population (2011) | 140,265 | ||
| Electors (2011) | 96,209 | ||
| Area (km²) | 75.73 | ||
| Pop. density (per km²) | 1,852.2 | ||
| Census division(s) | York | ||
| Census subdivision(s) | Markham, Vaughan | ||
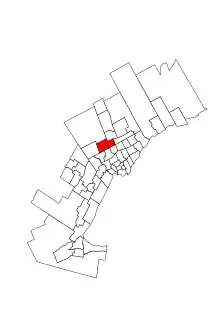
Thornhill 2003 to 2018
.png.webp)
Map of Thornhill riding
It covers the community of Thornhill, Ontario, which is made up of portions of Vaughan and Markham, and was created in 1999 from parts of Markham and York Centre ridings.
It consists of the part of the city of Vaughan that is east of Highway 400 and south of Rutherford Road, and the part of the city of Markham west of Bayview Avenue.[1]
It is the only riding in Ontario with a Jewish plurality. 32.8% of the population is Jewish, the highest in the province.[2]
Members of Provincial Parliament
| Thornhill | ||||
|---|---|---|---|---|
| Assembly | Years | Member | Party | |
| Riding created from Markham and York Centre | ||||
| 37th | 1999–2003 | Tina Molinari | Progressive Conservative | |
| 38th | 2003–2007 | Mario Racco | Liberal | |
| 39th | 2007–2011 | Peter Shurman | Progressive Conservative | |
| 40th | 2011–2013 | |||
| 2014–2014 | Gila Martow | |||
| 41st | 2014–2018 | |||
| 42nd | 2018–Present | |||
Election results
| 2018 Ontario general election | ||||||||
|---|---|---|---|---|---|---|---|---|
| Party | Candidate | Votes | % | ±% | ||||
| Progressive Conservative | Gila Martow | 28,889 | 61.13 | +17.18 | ||||
| New Democratic | Ezra Tanen | 9,134 | 19.33 | +11.17 | ||||
| Liberal | Sabi Ahsan | 6,985 | 14.78 | -29.00 | ||||
| Green | Rachel Dokhoian | 1,043 | 2.21 | -0.27 | ||||
| Libertarian | Mike Holmes | 621 | 1.31 | +0.15 | ||||
| None of the Above | Above Znoneofthe | 410 | 0.87 | |||||
| Ontario Moderate Party | Aleksei Polyakov | 177 | 0.37 | |||||
| Total valid votes | 47,259 | 100.0 | ||||||
| Progressive Conservative hold | Swing | +13.24 | ||||||
| Source: Elections Ontario[3] | ||||||||
| 2014 Ontario general election | ||||||||
|---|---|---|---|---|---|---|---|---|
| Party | Candidate | Votes | % | ±% | ||||
| Progressive Conservative | Gila Martow | 21,886 | 43.95 | -3.94 | ||||
| Liberal | Sandra Yeung Racco | 21,780 | 43.78 | +2.18 | ||||
| New Democratic | Cindy Hackelberg | 4,052 | 8.16 | +1.37 | ||||
| Green | David Bergart | 1,229 | 2.48 | +1.04 | ||||
| Libertarian | Gene Balfour | 571 | 1.16 | +0.11 | ||||
| Freedom | Erin Goodwin | 233 | 0.47 | -0.08 | ||||
| Total valid votes | 49,751 | 100.0 | ||||||
| Progressive Conservative hold | Swing | -3.06 | ||||||
| Source: Elections Ontario[4] | ||||||||
| Ontario provincial by-election, February 13, 2014 Resignation of Peter Shurman | ||||||||
|---|---|---|---|---|---|---|---|---|
| Party | Candidate | Votes | % | ±% | ||||
| Progressive Conservative | Gila Martow | 13,438 | 47.89 | +1.18 | ||||
| Liberal | Sandra Yeung Racco | 11,671 | 41.60 | +0.68 | ||||
| New Democratic | Cindy Hackelberg | 1,905 | 6.79 | -2.17 | ||||
| Green | Teresa Pun | 404 | 1.44 | -0.24 | ||||
| Libertarian | Gene Balfour | 296 | 1.05 | -0.34 | ||||
| Freedom | Erin Goodwin | 153 | 0.55 | +0.22 | ||||
| People's Political Party | Kevin Clarke | 144 | 0.51 | |||||
| Pauper | John Turmel | 47 | 0.17 | |||||
| Total valid votes | 28,058 | 100.00 | ||||||
| Total rejected, unmarked and declined ballots | 126 | 0.45 | ||||||
| Turnout | 28,184 | 27.36 | ||||||
| Eligible voters | 103,021 | |||||||
| Progressive Conservative hold | Swing | +0.25 | ||||||
| Source: Elections Ontario[5] | ||||||||
| 2011 Ontario general election | ||||||||
|---|---|---|---|---|---|---|---|---|
| Party | Candidate | Votes | % | ±% | ||||
| Progressive Conservative | Peter Shurman | 20,971 | 46.71 | +0.81 | ||||
| Liberal | Bernie Farber | 18,373 | 40.92 | -1.38 | ||||
| New Democratic | Cindy Hackelberg | 4,024 | 8.96 | +3.46 | ||||
| Green | Steff Duncan | 756 | 1.68 | -3.54 | ||||
| Libertarian | Gene Balfour | 623 | 1.39 | |||||
| Freedom | Erin Gorman | 149 | 0.33 | +0.03 | ||||
| Total valid votes | 44,896 | 100.00 | ||||||
| Total rejected, unmarked and declined ballots | 239 | 0.53 | ||||||
| Turnout | 45,135 | 45.35 | ||||||
| Eligible voters | 99,517 | |||||||
| Progressive Conservative hold | Swing | +1.10 | ||||||
| Source: Elections Ontario[6] | ||||||||
| 2007 Ontario general election | ||||||||
|---|---|---|---|---|---|---|---|---|
| Party | Candidate | Votes | % | ±% | ||||
| Progressive Conservative | Peter Shurman | 22,153 | 45.90 | +0.74 | ||||
| Liberal | Mario Racco | 20,420 | 42.31 | -4.59 | ||||
| New Democratic | Sandra Parrott | 2,656 | 5.50 | -0.23 | ||||
| Green | Lloyd Helferty | 2,520 | 5.22 | +3.68 | ||||
| Family Coalition | Nathan Kidd | 218 | 0.45 | |||||
| Independent | Malcolm Kojokaro | 156 | 0.32 | |||||
| Freedom | Lindsay King | 145 | 0.30 | -0.37 | ||||
| Total valid votes | 48,268 | 100.00 | ||||||
| 2003 Ontario general election | ||||||||
|---|---|---|---|---|---|---|---|---|
| Party | Candidate | Votes | % | ±% | ||||
| Liberal | Mario Racco | 21,419 | 46.90 | -0.46 | ||||
| Progressive Conservative | Tina Molinari | 20,623 | 45.16 | -3.05 | ||||
| New Democratic | Laurie Orrett | 2,616 | 5.73 | +2.19 | ||||
| Green | Bridget Haworth | 705 | 1.54 | +0.65 | ||||
| Freedom | Lindsay G. King | 304 | 0.67 | |||||
| Total valid votes | 45,667 | 100.00 | ||||||
| 1999 Ontario general election | ||||||||
|---|---|---|---|---|---|---|---|---|
| Party | Candidate | Votes | % | |||||
| Progressive Conservative | Tina Molinari | 19,580 | 48.21 | |||||
| Liberal | Dan Ronen | 19,237 | 47.36 | |||||
| New Democratic | Nathan David Rotman | 1,438 | 3.54 | |||||
| Green | Ruth von Bezold | 360 | 0.89 | |||||
| Total valid votes | 40,615 | 100.00 | ||||||
2007 electoral reform referendum
| 2007 Ontario electoral reform referendum | |||
|---|---|---|---|
| Side | Votes | % | |
| First Past the Post | 29,007 | 62.2 | |
| Mixed member proportional | 17,659 | 37.8 | |
| Total valid votes | 46,666 | 100.0 | |
References
- https://www.elections.on.ca/content/dam/NGW/sitecontent/2017/preo/2017atlasmaps/104ThornhillAtlasMap.pdf
- http://www12.statcan.gc.ca/nhs-enm/2011/dp-pd/prof/details/page.cfm?Lang=E&Geo1=FED&Code1=35089&Data=Count&SearchText=Thornhill&SearchType=Begins&SearchPR=01&A1=All&B1=All&Custom=&TABID=1
- "Summary of Valid Votes Cast for each Candidate" (PDF). Elections Ontario. p. 8. Retrieved 20 January 2019.
- "General Election Results by District, 089 Thornhill". Elections Ontario. 2014. Archived from the original on 17 June 2014. Retrieved 17 June 2014.
- "Official return from the records / Rapport des registres officiels - Thornhill by-election" (PDF). Elections Ontario. 2014. Archived from the original (PDF) on 2014-06-06. Retrieved 5 June 2014.
- "Official return from the records / Rapport des registres officiels - Thornhill" (PDF). Elections Ontario. 2011. Retrieved 5 June 2014.
This article is issued from Wikipedia. The text is licensed under Creative Commons - Attribution - Sharealike. Additional terms may apply for the media files.