Nickel Belt (provincial electoral district)
Nickel Belt is a provincial electoral district located in the Canadian province of Ontario. It elects one member to the Legislative Assembly of Ontario. The district is located in Northern Ontario and includes much of the eastern and southern parts of the District of Sudbury, as well as most of Greater Sudbury outside the city's urban core. Communities include Lively, Onaping, Levack, Dowling, Chelmsford, Naughton, Azilda, Coniston, Wahnapitae, Garson, Val Caron, Val Thérèse, Hanmer and Capreol.
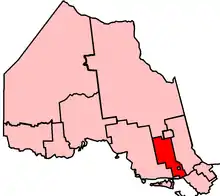 Nickel Belt in relation to other electoral districts in Northern Ontario | |||
| Provincial electoral district | |||
| Legislature | Legislative Assembly of Ontario | ||
| MPP |
New Democratic | ||
| First contested | 1955 | ||
| Last contested | 2018 | ||
| Demographics | |||
| Population (2016)[1] | 84,520 | ||
| Electors (2007) | 58,293 | ||
| Area (km²) | 25,548 | ||
| Pop. density (per km²) | 3.3 | ||
| Census division(s) | Sudbury District, Greater Sudbury | ||
| Census subdivision(s) | Markstay-Warren, St. Charles, Killarney | ||
Boundary redistribution
Prior to redistribution in 1998, the district included all of Sudbury District except the southeastern portion, as well as the western half of what was then the Regional Municipality of Sudbury (Walden, Rayside-Balfour and Onaping Falls). The eastern half of the current Nickel Belt comprised the separate district of Sudbury East.
In 1998, Ontario was divided into the same electoral districts as those used for federal electoral purposes. They were redistributed whenever a readjustment took place at the federal level. This change resulted in Sudbury East being reabsorbed back into Nickel Belt.
In 2005, legislation was passed by the Legislature to divide Ontario into 107 electoral districts, beginning with the next provincial election in 2007. The eleven northern electoral districts, including Nickel Belt, are those defined for federal purposes in 1996, based on the 1991 census (except for a minor boundary adjustment). The 96 southern electoral districts are those defined for federal electoral purposes in 2003, based on the 2001 census. Without this legislation, the number of electoral districts in northern Ontario would have been reduced from eleven to ten.[2]
This change primarily affects the Walden area, which is part of the Sudbury riding federally but remains in Nickel Belt provincially, and the West Nipissing area, which is part of Nickel Belt federally but Timiskaming—Cochrane provincially.
Members of Provincial Parliament
| Nickel Belt | ||||
|---|---|---|---|---|
| Assembly | Years | Member | Party | |
| Riding created | ||||
| 25th | 1955–1959 | Rhéal Bélisle | Progressive Conservative | |
| 26th | 1959–1963 | |||
| 27th | 1963–1967 | Gaston Demers | ||
| 28th | 1967–1971 | |||
| 29th | 1971–1975 | Floyd Laughren | New Democratic | |
| 30th | 1975–1977 | |||
| 31st | 1977–1981 | |||
| 32nd | 1981–1985 | |||
| 33rd | 1985–1987 | |||
| 34th | 1987–1990 | |||
| 35th | 1990–1995 | |||
| 36th | 1995–1998 | |||
| 1998–1999 | Blain Morin | |||
| 37th | 1999–2003 | Shelley Martel | ||
| 38th | 2003–2007 | |||
| 39th | 2007–2011 | France Gélinas | ||
| 40th | 2011–2014 | |||
| 41st | 2014–2018 | |||
| 42nd | 2018–Present | |||
Election results since 1977
| 2018 Ontario general election | ||||||||
|---|---|---|---|---|---|---|---|---|
| Party | Candidate | Votes | % | ±% | ||||
| New Democratic | France Gélinas | 23,157 | 63.50 | +0.84 | ||||
| Progressive Conservative | Jo-Ann Cardinal | 8,018 | 21.99 | +10.11 | ||||
| Liberal | Tay Butt | 3,182 | 8.73 | -13.19 | ||||
| Green | Bill Crumplin | 1,137 | 3.12 | -0.41 | ||||
| Northern Ontario | Matthew Del Papa | 373 | 1.02 | |||||
| Libertarian | James Chretien | 220 | 0.60 | |||||
| Consensus Ontario | Kevin R. Brault | 214 | 0.59 | |||||
| None of the Above | Bailey Burch-Belanger | 166 | 0.46 | |||||
| Total valid votes | 36,467 | 100.0 | ||||||
| Turnout | 57.00 | |||||||
| Eligible voters | 63,973 | |||||||
| New Democratic hold | Swing | |||||||
| Source: Elections Ontario[3] | ||||||||
| 2014 Ontario general election | ||||||||
|---|---|---|---|---|---|---|---|---|
| Party | Candidate | Votes | % | ±% | ||||
| New Democratic | France Gélinas | 19,941 | 62.66 | +7.77 | ||||
| Liberal | James Tregonning | 6,977 | 21.92 | -2.33 | ||||
| Progressive Conservative | Marck Blay | 3,782 | 11.88 | -6.47 | ||||
| Green | Heather K. Dahlstrom | 1,123 | 3.53 | +1.03 | ||||
| Total valid votes | 31,823 | 100.00 | ||||||
| New Democratic hold | Swing | +5.05 | ||||||
| Source: Elections Ontario[4] | ||||||||
| 2011 Ontario general election | ||||||||
|---|---|---|---|---|---|---|---|---|
| Party | Candidate | Votes | % | ±% | ||||
| New Democratic | France Gélinas | 16,876 | 54.89 | +8.26 | ||||
| Liberal | Tony Ryma | 7,434 | 24.25 | -13.79 | ||||
| Progressive Conservative | Paula Peroni | 5,625 | 18.35 | +8.29 | ||||
| Green | Stephanie-Lynn Russell | 770 | 2.50 | -1.72 | ||||
| Total valid votes | 30,762 | 100.00 | ||||||
| Total rejected, unmarked and declined ballots | 96 | 0.31 | ||||||
| Turnout | 30,858 | 49.55 | ||||||
| Eligible voters | 62,276 | |||||||
| New Democratic hold | Swing | +11.03 | ||||||
| Source: Elections Ontario[5] | ||||||||
| 2007 Ontario general election | ||||||||
|---|---|---|---|---|---|---|---|---|
| Party | Candidate | Votes | % | ±% | ||||
| New Democratic | France Gélinas | 15,126 | 46.63 | +0.11 | ||||
| Liberal | Ron Dupuis | 12,341 | 38.04 | -0.60 | ||||
| Progressive Conservative | Renée Germain | 3,264 | 10.06 | -3.43 | ||||
| Green | Fred Twilley | 1,368 | 4.22 | +2.87 | ||||
| Family Coalition | Richard St-Denis | 341 | 1.05 | |||||
| Total valid votes | 32,440 | 100.00 | ||||||
| 2003 Ontario general election | ||||||||
|---|---|---|---|---|---|---|---|---|
| Party | Candidate | Votes | % | ±% | ||||
| New Democratic | Shelley Martel | 16,567 | 46.52 | +4.57 | ||||
| Liberal | Alex McCauley | 13,759 | 38.64 | +9.89 | ||||
| Progressive Conservative | Dave Kilgour | 4,804 | 13.49 | -15.81 | ||||
| Green | Robert Nevin | 479 | 1.35 | |||||
| Total valid votes | 35,609 | 100.00 | ||||||
| 1999 Ontario general election | ||||||||
|---|---|---|---|---|---|---|---|---|
| Party | Candidate | Votes | % | ±% | ||||
| New Democratic | Shelley Martel | 14,833 | 41.95 | +1.08 | ||||
| Progressive Conservative | Gerry Courtemanche | 10,359 | 29.30 | -1.51 | ||||
| Liberal | Ron Dupuis | 10,165 | 28.75 | +0.43 | ||||
| Total valid votes | 35,357 | 100.00 | ||||||
| Ontario provincial by-election, October 1998, resignation of Floyd Laughren | ||||||||
|---|---|---|---|---|---|---|---|---|
| Party | Candidate | Votes | % | ±% | ||||
| New Democratic | Blain Morin | 5,537 | 40.88 | -5.66 | ||||
| Progressive Conservative | Gerry Courtemanche | 4,173 | 30.81 | +11.60 | ||||
| Liberal | Frank Madigan | 3,836 | 28.32 | -3.93 | ||||
| Total valid votes | 13,546 | 100.00 | ||||||
| 1995 Ontario general election | ||||||||
|---|---|---|---|---|---|---|---|---|
| Party | Candidate | Votes | % | ±% | ||||
| New Democratic | Floyd Laughren | 8,007 | 46.54 | -12.00 | ||||
| Liberal | Betty Rheaume | 5,549 | 32.25 | +12.98 | ||||
| Progressive Conservative | Frank Deburger | 3,305 | 19.21 | +13.51 | ||||
| Independent | Michel Chartrand | 225 | 1.31 | |||||
| Natural Law | Grace Tancock | 119 | 0.69 | |||||
| Total valid votes | 17,205 | 100.00 | ||||||
| 1990 Ontario general election | ||||||||
|---|---|---|---|---|---|---|---|---|
| Party | Candidate | Votes | % | ±% | ||||
| New Democratic | Floyd Laughren | 9,925 | 58.54 | +0.33 | ||||
| Liberal | Betty Rheaume | 3,267 | 19.27 | -3.56 | ||||
| Confederation of Regions | Gren Rogers | 2,796 | 16.49 | |||||
| Progressive Conservative | Paul Demers | 967 | 5.70 | -13.26 | ||||
| Total valid votes | 16,955 | 100.00 | ||||||
| 1987 Ontario general election | ||||||||
|---|---|---|---|---|---|---|---|---|
| Party | Candidate | Votes | % | ±% | ||||
| New Democratic | Floyd Laughren | 9,849 | 58.21 | +5.84 | ||||
| Liberal | Leo Pevato | 3,863 | 22.83 | +9.58 | ||||
| Progressive Conservative | Evelyn Dutrisac | 3,208 | 18.96 | -15.31 | ||||
| Total valid votes | 16,920 | 100.00 | ||||||
| 1985 Ontario general election | ||||||||
|---|---|---|---|---|---|---|---|---|
| Party | Candidate | Votes | % | ±% | ||||
| New Democratic | Floyd Laughren | 8,912 | 52.37 | -2.48 | ||||
| Progressive Conservative | Evelyn Dutrisac | 5,849 | 34.37 | +21.94 | ||||
| Liberal | Trudy Bolduc | 2,255 | 13.25 | -19.47 | ||||
| Total valid votes | 17,016 | 100.00 | ||||||
| 1981 Ontario general election | ||||||||
|---|---|---|---|---|---|---|---|---|
| Party | Candidate | Votes | % | ±% | ||||
| New Democratic | Floyd Laughren | 8,451 | 54.85 | -2.60 | ||||
| Liberal | Elmer Sopha | 5,041 | 32.72 | +14.12 | ||||
| Progressive Conservative | Andre Lalande | 1,915 | 12.43 | -11.52 | ||||
| Total valid votes | 15,407 | 100.00 | ||||||
| 1977 Ontario general election | ||||||||
|---|---|---|---|---|---|---|---|---|
| Party | Candidate | Votes | % | |||||
| New Democratic | Floyd Laughren | 9,410 | 57.45 | |||||
| Progressive Conservative | Marty McAllister | 3,923 | 23.95 | |||||
| Liberal | Paul Adam | 3,046 | 18.60 | |||||
| Total valid votes | 16,379 | 100.00 | ||||||
2007 electoral reform referendum
| 2007 Ontario electoral reform referendum | |||
|---|---|---|---|
| Side | Votes | % | |
| First Past the Post | 21,313 | 68.9 | |
| Mixed member proportional | 9,609 | 31.1 | |
| Total valid votes | 30,912 | 100.0 | |
Notes
- https://voterinformationservice.elections.on.ca/en/electoral-district/71-Nickel%20Belt
- Elections Ontario web site, “New Electoral Boundaries” Archived 2006-12-08 at the Wayback Machine
- "Summary of Valid Votes Cast for each Candidate" (PDF). Elections Ontario. p. 7. Archived from the original (PDF) on 28 December 2018. Retrieved 20 January 2019.
- Elections Ontario (2014). "General Election Results by District 056, NIckel Belt". Archived from the original on 14 June 2014. Retrieved 13 June 2014.
- Elections Ontario (2011). "Official return from the records / Rapports des registres officiels - Nickel Belt" (PDF). Retrieved 1 June 2014.
Sources
- Elections Ontario Results
- Map of riding for 2018 election