Nipissing (provincial electoral district)
Nipissing is a provincial electoral district in the Canadian province of Ontario, which elects one member to the Legislative Assembly of Ontario. It is located in the northeastern part of Ontario, centred on the city of North Bay.
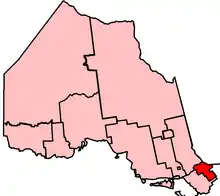 Nipissing in relation to other electoral districts | |||
| Provincial electoral district | |||
| Legislature | Legislative Assembly of Ontario | ||
| MPP |
Progressive Conservative | ||
| District created | 1890 | ||
| First contested | 1890 | ||
| Last contested | 2018 | ||
| Demographics | |||
| Population (2016)[1] | 75,060 | ||
| Electors (2007) | 57,124 | ||
| Area (km²) | 8,121 | ||
| Pop. density (per km²) | 9.2 | ||
| Census division(s) | Nipissing, Parry Sound | ||
History
The district was first contested in the 1890 election, but was divided into the separate districts of Nipissing East and Nipissing West for the 1902 election. By 1908, however, demographic changes resulted in Nipissing West being divided into two new districts, Sudbury and Sturgeon Falls, and the single riding of Nipissing was thus reconstituted and has been represented consistently in the Legislative Assembly ever since.
In 1996, Ontario was divided into the same electoral districts as those used for federal electoral purposes. They were redistributed whenever a readjustment took place at the federal level.
In 2005, legislation was passed by the Legislature to divide Ontario into 107 electoral districts, beginning with the provincial election in 2007. The eleven northern electoral districts are those defined for federal purposes in 1996, based on the 1991 census (except for a minor boundary adjustment). The 96 southern electoral districts are those defined for federal electoral purposes in 2003, based on the 2001 census. Without this legislation, the number of electoral districts in northern Ontario would have been reduced from eleven to ten.[2]
In 1996, it was defined to consist of parts of the eastern part of territorial district of Parry Sound, and the western part of the Territorial District of Nipissing.
The federal electoral district was abolished in 2003 when it was merged into Nipissing—Timiskaming riding.
Members of Provincial Parliament
Election results
| 2018 Ontario general election | ||||||||
|---|---|---|---|---|---|---|---|---|
| Party | Candidate | Votes | % | ±% | ||||
| Progressive Conservative | Vic Fedeli | 17,598 | 49.93 | +8.12 | ||||
| New Democratic | Henri Giroux | 12,994 | 36.87 | +11.13 | ||||
| Liberal | Stephen Glass | 2,794 | 7.93 | -18.85 | ||||
| Green | Kris Rivard | 997 | 2.83 | -0.97 | ||||
| Northern Ontario | Trevor Holliday | 738 | 2.09 | |||||
| Libertarian | Bond Keevil | 122 | 0.35 | |||||
| Total valid votes | 35,243 | 100.0 | ||||||
| Turnout | 59.7 | |||||||
| Eligible voters | 59,031 | |||||||
| Progressive Conservative hold | Swing | |||||||
| Source: Elections Ontario[3] | ||||||||
| 2014 Ontario general election | ||||||||
|---|---|---|---|---|---|---|---|---|
| Party | Candidate | Votes | % | ±% | Expenditures | |||
| Progressive Conservative | Vic Fedeli | 13,085 | 41.81 | -8.30 | $ 68,985.53 | |||
| Liberal | Catherine Whiting | 8,382 | 26.78 | -1.81 | 19,619.56 | |||
| New Democratic | Henri Giroux | 8,057 | 25.74 | +7.60 | 25,285.23 | |||
| Green | Nicole Peltier | 1,188 | 3.80 | +0.64 | 227.04 | |||
| Libertarian | Derek Elliott | 377 | 1.20 | 0.00 | ||||
| Independent | Patrick Clement | 208 | 0.66 | 14.45 | ||||
| Total valid votes/Expense limit | 31,297 | 100.0 | +1.96 | $ 77,340.16 | ||||
| Total rejected, unmarked, and declined ballots | 416 | 1.31 | +0.82 | |||||
| Turnout | 31,713 | 52.49 | +0.63 | |||||
| Eligible voters | 60,422 | +1.58 | ||||||
| Progressive Conservative hold | Swing | -3.25 | ||||||
Source(s)
"Valid Votes Cast for Each Candidate.pdf" (PDF). Elections Ontario. 2014. Retrieved 19 October 2015. "General Election Candidate Annual Financial Statements". Retrieved 20 October 2015. | ||||||||
| 2011 Ontario general election | ||||||||
|---|---|---|---|---|---|---|---|---|
| Party | Candidate | Votes | % | ±% | ||||
| Progressive Conservative | Vic Fedeli | 15,381 | 50.11 | +9.40 | ||||
| Liberal | Catherine Whiting | 8,775 | 28.59 | -13.52 | ||||
| New Democratic | Henri Giroux | 5,567 | 18.14 | +5.50 | ||||
| Green | Scott Haig | 971 | 3.16 | -0.65 | ||||
| Total valid votes | 30,694 | 100.00 | -6.21 | |||||
| Total rejected, unmarked and declined ballots | 152 | 0.49 | ||||||
| Turnout | 30,846 | 51.86 | ||||||
| Eligible voters | 59,481 | |||||||
| Progressive Conservative gain from Liberal | Swing | +11.46 | ||||||
| Source: Election Ontario[4] | ||||||||
| 2007 Ontario general election | ||||||||
|---|---|---|---|---|---|---|---|---|
| Party | Candidate | Votes | % | ±% | ||||
| Liberal | Monique Smith | 13,781 | 42.11 | -7.49 | ||||
| Progressive Conservative | Bill Vrebosch | 13,323 | 40.71 | -0.55 | ||||
| New Democratic | Henri Giroux | 4,136 | 12.64 | +5.45 | ||||
| Green | Amy Brownridge | 1,248 | 3.81 | * | ||||
| Family Coalition | Suzanne Plouffe | 238 | 0.73 | |||||
| Total valid votes | 32,726 | 100.00 | -9.40 | |||||
| Liberal hold | Swing | -3.47 | ||||||
^ Changed based on redistributed results
| 2003 Ontario general election | ||||||||
|---|---|---|---|---|---|---|---|---|
| Party | Candidate | Votes | % | ±% | ||||
| Liberal | Monique Smith | 18,003 | 49.84 | +6.70 | ||||
| Progressive Conservative | Al McDonald | 14,978 | 41.47 | -8.95 | ||||
| New Democratic | Terry O'Connor | 2,613 | 7.23 | +2.37 | ||||
| Green | Jaimie Board | 528 | 1.46 | +0.51 | ||||
| Total valid votes | 36,122 | 100.00 | +17.58 | |||||
| Ontario provincial by-election, May 2, 2002 Resignation of Mike Harris | ||||||||
|---|---|---|---|---|---|---|---|---|
| Party | Candidate | Votes | % | ±% | ||||
| Progressive Conservative | Al McDonald | 13,989 | 45.54 | -4.88 | ||||
| Liberal | George Maroosis | 13,970 | 45.48 | +2.34 | ||||
| New Democratic | Wendy Young | 1,821 | 5.93 | +1.07 | ||||
| Green | Todd Lucier | 940 | 3.06 | +2.11 | ||||
| Total valid votes | 30,720 | 100.00 | -20.56 | |||||
| 1999 Ontario general election | ||||||||
|---|---|---|---|---|---|---|---|---|
| Party | Candidate | Votes | % | |||||
| Progressive Conservative | Mike Harris | 19,498 | 50.42 | |||||
| Liberal | George Maroosis | 16,682 | 43.14 | |||||
| New Democratic | Wendy Young | 1,878 | 4.86 | |||||
| Green | Jaimie Board | 366 | 0.95 | |||||
| Natural Law | Michaele Morris | 246 | 0.64 | |||||
| Total valid votes | 38,670 | 100.00 | ||||||
2007 electoral reform referendum
| 2007 Ontario electoral reform referendum | |||
|---|---|---|---|
| Side | Votes | % | |
| First Past the Post | 23,095 | 72.9 | |
| Mixed member proportional | 8,596 | 27.1 | |
| Total valid votes | 31,691 | 100.0 | |
Notes
- https://voterinformationservice.elections.on.ca/en/electoral-district/72-Nipissing
- Elections Ontario web site, “New Electoral Boundaries” Archived 2006-12-08 at the Wayback Machine
- "Summary of Valid Votes Cast for each Candidate" (PDF). Elections Ontario. pp. 7–8. Archived from the original (PDF) on 28 December 2018. Retrieved 20 January 2019.
- Elections Ontario (2011). "Official return from the records / Rapport des registres officiels - Nipissing" (PDF). Retrieved 1 June 2014.
Sources
- Elections Ontario
- Map of riding for 2018 election